Electronic Research Archive of Blekinge Institute of Technology
http://www.bth.se/fou/
This is an author produced version of a conference paper. The paper has been peer-reviewed
but may not include the final publisher proof-corrections or pagination of the proceedings.
Citation for the published Conference paper:
Title:
Author:
Conference Name:
Conference Year:
Conference Location:
Access to the published version may require subscription.
Published with permission from:
Towards a Prediction Model for People Movements in Urban Areas
Paul Davidsson, Marie Gustafsson Friberger, Niklas Lavesson, Jan A. Persson
1st International Workshop on Multiagent-based Societal Systems
2013
ACM
Towards a Prediction Model for People Movements in
Urban Areas
Paul Davidsson
Technology and Society Malmö University 205 06 Malmö, Sweden
Paul.Davidsson@mah.se
Marie Gustafsson
Friberger
Technology and Society Malmö University 205 06 Malmö, Sweden
Marie.Friberger@mah.se
Niklas Lavesson
School of Computing Blekinge Institute of Technology 371 79 Karlskrona, SwedenNiklas.Lavesson@bth.se
Jan A. Persson
Technology and Society Malmö University 205 06 Malmö, Sweden
Jan.A.Persson@mah.se
ABSTRACT
The aim of this work is to develop a new type of service for pre-dicting and communicating urban activity. This service provides short-term predictions (hours to days), which can be used as a ba-sis for different types of resource allocation and planning, e.g. con-cerning public transport, personnel, or marketing. The core of the service consists of a forecasting engine that based on a prediction model processes data on different levels of detail and from various providers. This paper explores the requirements and features of the forecast engine. We conclude that agent-based modeling seems as the most promising approach to meet these requirements. Fi-nally, some examples of potential applications are described along with analyses of scientific and engineering issues that need to be addressed.
1.
INTRODUCTION
Urbanization is ever increasing in the developed world. A more recent phenomenon is that the amount of digitized data is grow-ing rapidly. Some of the obvious reasons behind this development are that data storage and computing resources are inexpensive, and that most people are able to create and share content and social in-formation via the Internet. Moreover, companies, authorities, and individuals are steadily increasing their visibility and availability through mobile and Internet services, for various reasons. Inhabitants in the traditional urban environment have been used to turn to specific, often monopolized, services or authorities to gather insight into various questions about time tables for public trans-portation, the occurrence of special events, the likelihood of traffic congestions, and so on. In contrast, inhabitants of the modern urban environments can access multiple sources of information, about
anything, instantaneously through smart phones and wifi-connected laptops and tablets.
This paper suggests a new type of urban forecast engine, which is based on efficient processing of available sources of urban data. The engine tries to estimate, for a designated urban area and a par-ticular point in time, where people will be gathering. The scope of the forecast engine is perhaps most accurately described as the class of urban forecasting applications that depend on immediate changes, as opposed to applications for which it may be more im-portant to discern facts about historical developments or to make long-term predictions about urban development. It is argued that the scope of the engine is relevant for a large number of applica-tions. The list below describes some of the potential applicaapplica-tions.
• Demand-driven Staff Re-location: Various authorities and companies could decrease resource utilization by re-locating staff members based on predicted service demand. Notable examples include city cleaners, fast food chains, mobile sales persons, market survey companies, taxi companies, as well as law enforcement and fire departments.
• Public Transport Resource Allocation: Accurate predic-tions about traffic congespredic-tions, entertainment and sport events, and the impact of various weather conditions could serve as a basis for re-locating, adding, or removing specific units of public transport.
• Marketing and News Dissemination: Knowledge about large gatherings of people or particular hotspots in the city could serve as valuable venues for marketing campaigns or the dis-tribution of free newspapers.
• Public Safety Improvement: Public authorities work dili-gently to keep most cities safe but some urban areas may be more prone to dangerous encounters than others, especially during certain hours of the day. The identification of large crowds, or indeed abandoned areas, could be used as a basis for advice about which parts of the city are safe to frequent. • Service Improvement: Some companies and authorities may
be able to improve their service through the use of informa-tion from forecasts. For example, driving schools could use
the forecasts to design suitable routes for driving students of different levels of proficiency.
• Military and Law Enforcement Intelligence: Several stake-holders of law enforcement, and even branches of the armed forces, could improve intelligence gathering and analysis of potentially hazardous scenarios based on the forecasts. • Urban Service Provision: New services, such as mobile
stack-parking elevators could be provisioned on the basis of the predictions.
In these applications, the intended users are professional planners of operations. It would be possible also to make the predictions publicly available to citizens, and to application developers, who then could implement new types of services based on the forecast-ing engine.
Typically, the professional planners in the applications listed above use the predictions of the situation hours or days ahead in order to decide where to allocate staff an other resources for the next hours or days. Potentially, one could also use the forecasting engine for another type of service, namely to make different kinds of what–if projections. For example, what happens if there is rain tomorrow at 14 instead of the forecasted sunshine?
The remainder of this paper is organized as follows. First, the cur-rent state of knowledge with regard to relevant urban models is analyzed. Then, the requirements for the urban forecast engine are identified. After this, we discuss how to meet these requirements and how to construct the engine. This is followed by a discussion of a number of open questions that must be addressed in order to re-alize the forecasting service. Finally, we present some conclusions and pointers to future work.
2.
RELATED WORK
There is a long tradition in urban planning that seeks to model cities at various abstraction levels and using different perspectives. Ac-cording to [17], it is possible to identify four types of urban models, characterized by the targeted rate of change:
• Slow change: models city network infrastructure like trans-port, energy and land use,
• Medium change: models the buildings in the city,
• Fast change: modeling the housing and employment of the population of the city,
• Immediate change: modeling transport and inhabitant ac-tivities in the city.
The forecast engine requires a model of type immediate change but which may also be used for prediction of future changes based on historical data. The latter requirement excludes models that are specifically designed with the aim to explain and increase under-standing of the historical changes. There are several theories about how urban environments can be simulated to make it possible to predict the urban changes and developments. One study [16] uses the term urban metabolism to describe the city or the pace of some district, and argue that traditional forecasting models are too fo-cused on predicting the long-term development of the city. The same study [16] also indicates that the modern city can be difficult
to simulate and predict due to that the boundaries between leisure activities and work are being erased or changed. It is also worth-while to point out that the quality, scope, and type of data affect the forecast engine and, as such, may also affect the results of the forecast engine end-product quality.
There are a few traffic prediction models that can predict the con-ditions in the road network, such as the travel time or speed for a certain distance. Dynamite [2] and Dyna Smart [7] are examples of models that predict the flow in order to estimate the driving time in the near future. The term near here refers to the next hour. This type of traffic flow prediction could be relevant to the forecasting engine even if the time horizon is close.
In the case of the prediction of human activities and other urban developments or changes, promising solutions are even harder to identify. There are a few examples of models of single individu-als: Jyotish [9] predicts the location at which a particular person will stop and for how long based on wifi or Bluetooth while Next Place [13] uses non-linear time series analysis to estimate arrival and departure time to and from various locations. It is unclear what these models could provide in terms of enhancements for the fore-cast engine.
An important component of the forecast engine is the construction of a reliable model of the normal case. Then information about changes to the normal case can be added to describe more interest-ing situations (e.g. when an event occurs). Intuitively, a functional normal model is constructed by both the statistical data (concern-ing holidays, seasons, and so on) and dynamic data. A well studied area is the estimation of Origin and Destination pairs, i.e. OD Es-timation which can form OD-matrices [1]. The OD matrices are typically used in traffic assignment model. The computations of the estimates are based on mathematical models of the transport network enabling a connection between (measures of) flow and OD data. The models can typically use different data sources (e.g. traffic counts, travel surveys and various ITS services). Typically OD-matrices are estimated for different time periods. Limitations of OD-pair estimation models are that they often focus on a single mode of transport (e.g. private cars) and relies on the availability of a transport network model. However, OD estimations are probably very relevant for the computation of the normal case.
There are other types of approaches that do not use transport net-work models such as the initiative taken by [15] who examined ur-ban mobility by analyzing the use of mobile phones in Rome. The work shows that it is possible to create a reliable normal model by using identified patterns of recurring events on an annual, weekly, and hourly basis. Results are reported for a number of years of re-search that was initiated when [12] studied the construction and use of so-called mobile landscapes. The method was based on studying the use of mobile phones to measure the intensity of urban activi-ties at a given time or the change in the intensity of urban activiactivi-ties between locations and over different time periods. There are also some well-known services such as Google Maps1and Trafiken.nu
2
that provide some information on the current traffic system situa-tion.
Model-based assimilation of observations, or data assimilation, rep-resents a suitable approach by which to design the urban prediction
1
maps.google.com
2
engine. It has been studied extensively in meteorology and related areas [8] but the general approach is suitable for our application domain as well. Data assimilation can be described as the process by which observations are included in a model of a real system. In data assimilation, observations of the current state or historical states of the system are combined with the results from a forecast to generate new forecasts, or new estimations of the current state. These forecasts can be viewed as probability distributions. The pro-cess of iteratively updating the prognoses by incorporating obser-vations is based on Bayesian inference. It is necessary to integrate multiple types of data and probably also different types of models to create a reliable and efficient forecast engine. To manage this data and model integration, some form of meta data gathering may be required and there is some research on the semantics of urban models that could be used: LarKC is an open source platform for distributed reasoning based on large data sets. The platform has been developed within the framework of an EU FP7 project and the project results have been reported in numerous research arti-cles, but few of these contributions concern or focus on urban anal-ysis and prediction. The reason is that the LarKC project focuses on developing a general platform for various applications of large-scale, distributed systems. One of the exceptions, reported by [5] concerns traffic prediction based on machine learning (neural net-works) and operations research (route planning). The model pre-sented can distinguish between normal traffic situations and traffic jams.
The current state of knowledge is rather difficult to describe con-cisely as the main problem, urban forecasting, has been studied in several disciplines and from different perspectives. The most practical, and seemingly successful, applications have a number of things in common: they are clearly scoped and limited in terms of functionality and include a generic interface for data storage and processing.
3.
FORECAST ENGINE REQUIREMENTS
The number of requirements that need to be met by the forecast engine is going to increase as more ideas for practical services are conceived. In general, the requirements are divided into three cat-egories: usability, computational efficiency, and forecast accuracy. It is quite likely that requirements from these categories will be in conflict with each other. Thus, it is necessary to clearly define the aim of the forecast engine and to delimit the scope.
The forecast engine must satisfy a number of time constraints to be useful in practice. Firstly, forecasts will need to have been pro-duced a certain amount of time ahead, for it to be useful. For many of the potential application areas described above, we estimate that this will be at least 24 hours, though in some cases it may be more. Secondly, the amount of time necessary to compute a forecast has to be sufficiently small, which may vary between 1 minute and 1 hour depending on the application area. Thirdly, the response time for outputting a computed forecast should be small to not affect usability negatively.
If the forecasts for several points in time are to be generated, this can be done with parallel computing in order to adhere to the com-putation time limit. Moreover, the prediction engine could be sepa-rated from the server that handles user application calls in order to adhere to the response time limit.
3.1
Delimitations of the Engine Design
The appropriate spatial accuracy, i.e., the size of the smallest ar-eas that forecasts take into account, depends on the application and which input is available. However, we believe that an appropriate size is between city blocks and districts, i.e., approximately be-tween 1000 and 1000000m2. The suitable level of accuracy with respect to the projected number of people in an area may be be-tween 100 and 1000, depending on the application and the size of the city. Although the location of people is what should be pre-dicted, the movement of people is also relevant in many applica-tions. Only people who are in the (semi-) public space will be considered in the forecast. People who are at home or at work / daycare / school creates no “pressure” (in terms of the number of people situated in a given area) in public spaces, which is the most interesting for most applications. However, the engine will proba-bly still keep record on where everyone in the city is located. For this purpose, real-time public transport ticket counts can be used as one source of input. The prediction engine will not try to cate-gorize people according to age, gender, whether they are tourists, and so on. Although this would be helpful information for many applications, it would probably be difficult to implement and could quite possibly be privacy intrusive. The prediction engine will not make any difference on what activities people perform (in addition to whether they are moving between two areas or not).
3.2
A Preliminary Example
In order to support the intended application, the output of the pre-diction engine could be a forecast for every 10 minutes the next 24 hours, which would correspond to 6 ∗ 24 = 144 forecasts. Possibly, one could have more time distance between the longer-term predictions. If we define a time horizon of 24 hours ahead, it could for instance have the following time-resolution forecasts: every 10 minutes for the next three hours, every 20 minutes for the next three hours, every 30 minutes for 6 hours that follows, and finally an hour for the last 12 hours (which would thus correspond to 6 ∗ 3 + 3 ∗ 3 + 2 ∗ 6 + 1 ∗ 12 = 51 forecasts). The idea is that these forecasts are updated (or recalculated) as often as pos-sible, preferably every 10 minutes so that the engine can create a sliding windowof 24 hours that is constantly moving forward, and where the forecasts are becoming increasingly reliable as more and higher quality input can be used. However, the requirement for the time resolution of the forecasts depends on their intended use and in particular which services are demanding the forecasts.
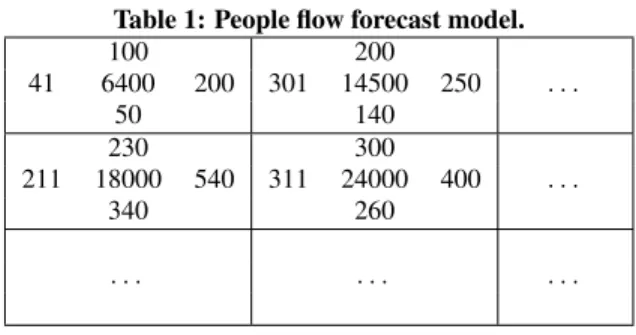
The forecast made in the simplest case consists solely of the pre-dicted number of people in the area at that time for each area of the city. A more advanced version of the engine would also be able to identify the number of people entering the area during a given pe-riod of time (the inflow to the area) and the number of leaving the area during this time (outflow from the area). A variant of this is would be an engine that predicts the outflow from each area to all of its adjacent areas. The output of the latter approach is illustrated in Table 1. If we regard the area in the middle, the prediction is that there will be 24000 people in the area, the number of people moving to the area northwards will be 300 during the time period, 311 to the west, etc.
A complicating situation occurs when people arrive in an area of the city without actually passing adjacent areas (e.g., arrive via a long-distance rail, subway or airplane). In such case, it is probably meaningless to model which areas of the city are passed on the way to the station / airport. One possible approach to address this type of situation is to model the event as an individual pop up in an area
Table 1: People flow forecast model. 100 200 41 6400 200 301 14500 250 . . . 50 140 230 300 211 18000 540 311 24000 400 . . . 340 260 . . . .
without specifying from which area the individual arrives. This represents the second way of presenting predictions as described above.
Alternatively, one could present the “pressure”, e.g. in people / m2,
but it is basically a variant of what has been described above. Pos-sibly, one could make the pressure area-dependent, and compare with normal pressure of the area. How one chooses to present the forecast has insignificant impact on the forecast engine design.
4.
FORECAST ENGINE CONSTRUCTION
The basic idea for computing a forecast is that the engine takes as its starting point the normal state for a given time on a certain type of day, such as the normal distribution of people in public spaces at 10:30 AM on a Saturday. The normal state is estimated through statistical predictive analysis of historical data, combined with the prognosis for the previous time step, if available. The normal state itself can be seen as a primitive forecast, but the idea is that it can be improved by using additional information.
4.1
Data and Semantics
Data is needed both to calculate the normal state and to improve upon this model using the gathered knowledge of current and up-coming circumstances that deviate from the normal state. For ex-ample, real-time information about the current situation (about traf-fic flows, weather, etc.) can be used to adjust the forecast in one direction or another.
Other types of information that can be used to improve the forecast relate to events, such as football games and concerts, but also infor-mation about school holidays and days salaries are paid. Additional information related to these, such as the expected number of peo-ple who will attend an event, may further improve the forecast. In summary, the effects of events, weather, traffic flows, etc. are used to adjust the normal state in different ways and thus improve the forecast. Data access can be defined at various levels such as:
• only historical data • weather forecast • information about events
• voluntary disclosure of real-time information about people’s current positions (such as Google Latitude)
• information from social networks, such as status updates • real-time information on traffic flows
• real-time information about people’s current positions from mobile phone networks
The basic forecast engine, which only presents the normal state, is using only the first level. By adding data sources from the later lev-els, the generated forecasts can be improved. However, the higher levels can be more difficult to get access to and more resource in-tensive, though the ordering of these in the list above can be dis-cussed. Some levels, such as weather forecasts and information about events, are fairly easy to access. While information from social networks may be fairly easy to access, some extra natural language processing may be necessary to determine geographic lo-cations and how the user is referring to it. Real-time information on traffic flows and people’s positions are dependent on collaboration with organizations who have this type of data. For each category and data source, there are potentially multiple sources that must be combined, such as event information from several different orga-nizers or aggregators. Semantic alignment, to determine how their models correspond, has to be carried out to make these useful. Fur-thermore, each source and source type need to be analyzed and annotated with information about what type of source they are and how their contents can be used.
4.2
The Prediction Model
The forecast engine uses a prediction model of the city and together with the available input data to create forecasts. There are basically three possibilities as to what level this modeling can take place on:
• Macro-level: based on the flows of people and the average number of persons in an area. Such models are based on statistics and correlation.
• Micro-level: based on information at the level of the individ-ual. Such models are often based on simulation and causality. • Meso-level: based on both flows and individuals.
As Parunak et al.[11] have pointed out, the micro-level (agent-based) and the macro-level (equation-(agent-based) approaches have their relative strengths and weaknesses. They concluded that “[..] agent-based modeling is most appropriate for domains characterized by a high degree of localization and distribution and dominated by dis-crete decision. Equation-based modeling is most naturally applied to systems that can be modeled centrally, and in which the dynam-ics are dominated by physical laws rather than information process-ing”. Since the behavior of people in a city is dominated by local discrete decisions by distributed decision-makers, modeling on the micro-level seems as a promising approach. In fact, there are a large number of agent-based urban models, but they do mostly con-cern slow to fast change, e.g. land use [14, 6] and housing [4]. The agent-based urban models that do include immediate change, on the other hand, are often not useful due to their level of detail, e.g., concerning low level driver behavior in intersections [10]. A sig-nificant obstacle to the application of agent-based models concerns the scalability. To have millions of agents is a challenge, both from a modeling and computational perspective. One would probably need to use representative samples of the population rather than the complete population. Moreover, we believe that a hybrid approach on the meso-level have great potential, making use of macro-level models improve the scalability of agent-based models.
5.
OPEN QUESTIONS
There are a number of issues related to the forecast engine that re-quire further investigation. These relate to various aspects of the model that the forecast engine uses: how different types of input data affect the model, the model’s structure and level of detail, how the normal state can be created, how to handle conflicts and un-certainty in the input data, as well as how to evaluate the forecast quality and how the forecasts can be improved.
5.1
Input Data Influence on the Forecast
One set of open questions relate to determining how different input data influence the forecast. For example, how do different types of events and weather affect people’s locations and movements. Infor-mation about the current situation of the transport network also af-fects people’s locations and movements, but the effect on the “pres-sure” of an area of traffic only passing through is not clear. Differ-ent kinds of input data are relevant for differDiffer-ent time horizons. For the next few hours, real-time information about the current situation is important; for longer term forecasts, events and weather forecasts are more important. Probably a mixture of models are needed, with different weighting of the input data at different lengths.
5.2
Model Construction and Level of Detail
As concluded above, agent-based micro-level modeling seems to be the logical choice when considering the characteristics of the system to be modeled. However, in order to handle the scalabil-ity issues some hybrid meso-level approaches that incorporate also macro-level aspects need probably to be considered. There may already exist some models that are useful to the forecast engine, such as existing traffic models. How can these be combined with other relevant models? Related to traffic, open questions are how to handle different types of vehicles (such as cars, buses and trucks) as well as people in transit. Another issue is to determine suitable sizes for the geographic units to divide the city into, and, related to this, if these sizes should be the same for all areas of the city. Finally, should the flows of people be modeled explicitly between neighboring areas or just flows in to and out from an area?
5.3
Creation of a Normal State
A major part of constructing the forecast engine is to create a model of the normal state from historical data. That is, what is the default urban pressure for a given geographical area for a certain time of a certain time of day? One step in creating this model is to de-termine what classification of days is appropriate. For example, one category of days may be weekend days and regular weekdays. However, these probably have to be further subdivided, as more people leave work early on Fridays than other weekdays. Another possible division of days is by season, but this difference can prob-ably be captured by differences in the weather. Different kinds of historical data can be used to create the normal state, but we need to determine what sources are relevant to building the model and to determine how these can be accessed.
5.4
Handling of Conflict and Uncertainty
In the simplest case, different input data can be considered to be independent of each other, so that their effects can be added. If the input data concern the same category, such as events, a single event may occur several times, sometimes with slightly different names. In such a case, these would have to be resolved to one event. In a more complex case, several different input types may interact, such as weather and outdoor events. Furthermore, different sources
may be providing conflicting information, requiring some form of conflict resolution.
5.5
Forecast Quality and Improvements
The main task of the forecast engine is to perform forecasts of ur-ban activity based on various sources of data. The ability to per-form these forecasts can be evaluated by measuring the accuracy and computational efficiency of the forecasts. Without this evalu-ation it is impossible to compare alternative prediction algorithms and to determine whether a particular solution satisfies the time constraints. These comparisons and determinations are required to reject inferior solutions. Whereas it is straight forward to assess the computational efficiency of the forecast engine by obtaining measurements of the time required to compute the forecasts, it is difficult to evaluate the accuracy of the forecasts and to measure the precision, i.e., the reproducibility of the forecasts. Accuracy estimations are difficult to perform mainly due to two reasons: an arbitrary forecast comprises a matrix of results (recall Table 1) and forecasts may influence the urban activity and thus contribute to the introduction of a strange loop. Suppose that the forecast engine is employed to provide a basis for path planning to a particular event. If a large number of citizens are traveling to the event at approxi-mately the same time, it is likely that the regions that are predicted to be inactive will be heavily populated. Thus, users may end up following an inferior path to the event and subsequently perceive the forecast as being inaccurate. Precision estimations are difficult to perform due to the dependence relationship between the forecast engine and the data sources, and due to the evolving nature of the learning mechanism in the forecast engine. We want the forecast engine to improve the predictive performance through adaptation (online learning) and user interaction (data sharing of anonymized content) but these features make it inherently hard to measure the precision of the forecast engine since they will contribute to a grad-ual change of the forecast computations. Thus, if two forecast en-gine instances from time t and t + 1 compute forecasts based on identical data sources it is likely that the forecasts differ.
5.6
Prediction Effects
There are several ways in which predictions affect people’s behav-ior. One aspect of this is captured in the game theoretic El Farol Bar problem [3], where attending the one bar in town on a given night comes down to a decision of whether or not one thinks it will be too crowded or not, and where the individual inductive predic-tions affect the outcome. (Of course, one can also imagine situa-tions where the factor used in deciding is that there is a sufficient number of attendees for something to be interesting.)
With regard to the forecast engine, these predictions and corre-sponding decisions need to be taken into account. A person’s pre-diction of the number of people attending an event may affect their willingness to attend themselves. If they know of the event, but will not be attending, they may adjust their movement to avoid the crowds associated with it.
The forecast engine could also be seen as a prediction that may af-fect the actual behavior of a person in an urban environment. In the application mentioned above, the users of the forecasts are only people involved professional decision making. This makes this ef-fect manageble. However, If the forecasts were made public or used in services intended for citizens, one would need to further take into consideration how the decisions of citizens based on the forecasts may interfere with the predicted results.
6.
CONCLUSIONS AND FUTURE WORK
This paper proposes a forecast engine as the main component of a new service for predicting urban activity. Related work is success-ful for specific applications within this problem domain. Existing generic platforms for large-scale data management and computing may be appropriate for the domain due to that many conceivable urban forecasting applications are dependent on efficient process-ing of data from multiple incompatible sources. We need to explore the research gap between the generic platforms and specific appli-cation solutions. A particular class of forecasting and visualization applications is identified within this gap. This class comprises ap-plications for which it is important to monitor fast to immediate change of “pressure”. An accurate analysis of urban pressure can be used for decision support and control systems for traffic and transport management. Several open questions must be addressed. For example, an accurate normal model must be constructed from historical data. Future work will address the questions of how to evaluate forecasts and how to generate reliable models for people in transit.
ACKNOWLEDGEMENTS
This work has been carried out in the project “Urban Insight” funded by VINNOVA, the Swedish Governmental Agency for Innovation Systems (http:/www.vinnova.se). We would like to thank the other project partners and the anonymous reviewers of this paper for valuable input.
7.
REFERENCES
[1] T. Abrahamsson. Estimation of origin-destination matrices using traffic counts. A literature survey. IIASA Interim Report IR-98-021/May, 1, 1998.
[2] C. Antoniou, H. Koutsopoulos, M. Ben-Akiva, and A. S. Chauhan. Evaluation of diversion strategies using dynamic traffic assignment. Transportation Planning and Technology, 34(3):199–216, 2011.
[3] W. B. Arthur. Inductive reasoning and bounded rationality. The American Economic Review, 84(2):406–411, 1994. [4] I. Benenson. Agent-based modeling: From individual
residential choice to urban residential dynamics. In D. G. J. M. F. Goodchild, editor, Spatially Integrated Social Science: Examples in Best Practice, pages 67–95. Oxford University Press, 2004.
[5] I. Celino, D. Dell’Aglio, E. Della Valle, F. Steinke,
R. Groth Mann, and V. Tresp. Integrating machine learning in a platform for semantic web traffic forecasting and routing. In Third International Workshop on Inductive Reasoning and Machine Learning for the Semantic Web. Springer, 2011. [6] R. Fu, L. Pu, M. Qian, and M. Zhu. Multi-agent system in
land-use change modeling. Communications in Computer and Information Science, 201(1):288–295, 2011.
[7] T. Hu and T. Liao. An empirical study of simulation-based dynamic traffic assignment procedures. Transportation Planning and Technology, 34(5):467–485, 2011. [8] K. Ide, P. Courtier, M. Ghil, and A. C. Lorenc. Unified
notation for data assimilation: Operational, sequential and variational. Journal of the Meteorological Society of Japan, 75(1B):181–189, 1997.
[9] V. Long, D. Quang, and K. Nahrstedt. Jyotish: A novel framework for constructing predictive models of people movement from joint wifi / bluetooth trace. In International Conference on Pervasive Computing and Communications. IEEE Press, 2011.
[10] R. Mandiau, A. Champion, J.-M. Auberlet, S. Espie, and C. Kolski. Behaviour based on decision matrices for a coordination between agents in a urban traffic simulation. Applied Intelligence, 28(2):121–138, 2008.
[11] H. V. D. Parunak, R. Savit, and R. Riolo. Agent-based modeling vs. equation-based modeling: A case study and users guide. In Multi-Agent Systems and Agent-Based Simulation, volume 1534 of Lecture Notes in Artificial Intelligence, pages 10–25. Springer, 1998.
[12] C. Ratti, R. M. Pulselli, S. Williams, and D. Frenchman. Mobile landscapes: Using location data from cell phones for urban analysis. Environment and Planning, 33(5):727–748, 2006.
[13] S. Scellato, M. Musolesi, C. Mascolo, V. Latora, and A. Campbell. the next place: A spatio-temporal prediction framework for pervasive systems. In Ninth International Conference on Pervasive Computing. Springer, 2011. [14] N. Schwarz, D. Kahlenberg, D. Haase, and R. Seppelt.
ABMland - a tool for agent-based model development on urban land use change. Journal of Artificial Societies and Social Simulation, 15(2):8, 2012.
[15] A. Sevtsuk and C. Ratti. Does urban mobility have a daily routine? Learning from aggregate data of mobile networks. Urban Technology, 17(1):41–60, 2010.
[16] A. M. Townsend. Life in the realtime city: mobile tele phones and urban metabolism. Urban Technology, 7(2):85–104, 2000.
[17] M. Wegener. Operational urban models: state of the art. American Planning Association, 60:17–29, 1994.