Contents lists available at ScienceDirect
Internet
of
Things
journal homepage: www.elsevier.com/locate/iot
Quality
attributes
in
edge
computing
for
the
Internet
of
Things:
A
systematic
mapping
study
Majid
Ashouri
∗,
Paul
Davidsson
,
Romina
Spalazzese
Department of Computer Science and Media Technology , Internet of Things and People Research Center, Malmö University , Bassänggatan 2 , SE-205 06 Malmö, Sweden
a
r
t
i
c
l
e
i
n
f
o
Article history: Received 29 April 2020 Revised 30 October 2020 Accepted 5 December 2020 Available online 15 December 2020 Keywords:
Internet of Things Edge computing Quality attributes Metrics
Systematic mapping study
a
b
s
t
r
a
c
t
Many Internet of Things (IoT) systems generate a massive amount of data needing to be processed and stored efficiently. Cloud computing solutions are often used to handle these tasks. However, the increasing availability of computational resources close to the edge has prompted the idea of using these for distributed computing and storage. Edge computing may help to improve IoT systems regarding important quality attributes like latency, en- ergy consumption, privacy, and bandwidth utilization. However, deciding where to deploy the various application components is not a straightforward task. This is largely due to the trade-offs between the quality attributes relevant for the application. We have performed a systematic mapping study of 98 articles to investigate which quality attributes have been used in the literature for assessing IoT systems using edge computing. The analysis shows that time behavior and resource utilization are the most frequently used quality attributes; further, response time, turnaround time, and energy consumption are the most used met- rics for quantifying these quality attributes. Moreover, simulation is the main tool used for the assessments, and the studied trade-offs are mainly between only two qualities. Finally, we identified a number of research gaps that need further study.
© 2020 The Authors. Published by Elsevier B.V. This is an open access article under the CC BY license ( http://creativecommons.org/licenses/by/4.0/)
1. Introduction
During the last decade, cloud infrastructures have become the main solution for hosting services due to their elasticity and cost-effectiveness. In other words, the trend has been to use centralized architectures for data processing and storage in large data centers. Simultaneously, the rapid development of the Internet of Things (IoT) affects nearly all aspects of society, including health care, transportation, and production industry. Many IoT systems have devices residing at the edge of the network that generate huge amounts of data, which requires heavy resources for processing and storage [1] . This poses a significant challenge for cloud solutions to provide efficient service provisioning [2] . Additional challenges include spatial distribution of sensors and actuators, latency requirements, privacy issues, and transport of massive amounts of data, which together motivate the development of new solutions alongside cloud computing [3] .
The idea of utilizing the resources at the edge of the network, known as edge computing, has been proposed in order to perform computation and storage closer to where the data is generated. This may help address the aforementioned
∗Corresponding author.
E-mail addresses: majid.ashouri@mau.se (M. Ashouri), paul.davidsson@mau.se (P. Davidsson), romina.spalazzese@mau.se (R. Spalazzese). https://doi.org/10.1016/j.iot.2020.100346
2542-6605/© 2020 The Authors. Published by Elsevier B.V. This is an open access article under the CC BY license ( http://creativecommons.org/licenses/by/4.0/ )
Fig. 1. Hybrid Edge-Cloud reference architecture for IoT systems. There are many options of where to deploy the software components to the right.
challenges by lowering latency, handling privacy issues, reducing data communication, and reducing energy consumption [3,4] . Moreover, distributed edge computing can be integrated with centralized processing in the cloud, resulting in a hybrid Edge-Cloud model [5,6] that may combine the strengths of both approaches.
Fig. 1 illustrates the continuum of computation and storage capacities from the edge to the cloud in a hybrid Edge- Cloud reference architecture. The Thing nodes are devices that typically have limited computational and storage resources that enable them to host only simple applications, such as sensing, actuating based on certain events, and sending and receiving data. Local nodes possess more computational, storage, and communication capabilities than Thing nodes, which enables them to manipulate, analyze, dispatch data, interact with the cloud and Thing nodes, and host IoT applications or components located at the network edge. Examples of Local nodes include gateways, access points, routers, switches, local servers, smartphones, and connected vehicles. Further, some physical devices can play different roles. For example, a traffic light can simultaneously act both as a Thing node that senses the environment and actuates and as a Local node that aggregates data, processes it, and hosts other applications. The cloud consists of centralized data centers with massive computational, storage, and communication capabilities that enable cloud solutions to host various kinds of IoT application components with high demand for physical resources.
There are highly distributed solutions relying heavily on edge computing using Things and Local nodes, and highly cen- tralized solutions relying heavily on cloud computing. Using the hybrid Edge-Cloud architecture enables system designers to benefit from the strengths of both distributed and centralized solutions. However, this adds more complexity when design- ing IoT applications and poses challenges regarding where to deploy application components among all possible combina- tions. In a hybrid architecture, there are several possible options to deploy the different components of an IoT application in distributed edge devices or centralized data centers. Making the decisions on where to deploy each application compo- nent is challenging and requires analyzing the various aspects impacting the quality of service. Thus, it would be useful to provide different decision support tools for the system designers to aid them in making appropriate deployment deci- sions. The software component deployment problem in an Edge-Cloud architecture has been investigated in several studies [7–9] . However, these studies mostly focus on how to efficiently allocate the available resources in the edge or cloud infras- tructure to handle the received requests from different IoT applications in order to optimize the resource utilization of the system with minimum cost. In other words, they investigate the problem from the infrastructure providers’ point of view and explore how to optimize the use of the available resources, but they do not provide any decision support to the system designers.
To support IoT system designers in evaluating different design options, we need to identify the key quality attributes that influence the decision-making. Previous work mostly focuses on a few quality attributes, like energy consumption and latency [7,8] , probably because they can easily be measured. However, we know from a previous study that there are more qualities (or quality attributes; we will use these terms interchangeably) that may impact decisions [10] . For example, let us consider the use case of red light violationdetection and accident prevention in intersections. One solution is to track objects via the surveillance cameras. This use case consists of several components such as movement capturing, object tracking, data compression, abnormal behavior detection, warning management, warning display, and overall long-term sys- tem optimization. To find the best option for distributing each component, a number of qualities should be considered. In this use case, there is an obvious real-time requirement with a high degree of accuracy. Compared to a cloud comput- ing solution, an edge computing solution will result in low communication latency but high computation latency and may reduce the event-detection accuracy by having access to less data. Moreover, streaming a massive amount of data to the cloud in the form of high-resolution images imposes considerable energy consumption and bandwidth cost for some extra processing features. Processing images also demands a high degree of privacy and security. Being reliable and available, hav-
ing acceptable performance in a rapid change of traffic, and having scalability are the other key qualities that impact the decision.
Accordingly, identifying the key quality attributes and corresponding metrics to quantify them are an important step towards supporting IoT system designers, as well as better understanding IoT systems in general. This will not only guide the designers in the selection of deployment solutions but may also help them make better decisions in choosing programming frameworks, hardware, and algorithms, as well as aid them in the requirement engineering process. To achieve this, we have conducted a systematic mapping study to investigate which quality attributes have been considered in previous studies that analyze IoT applications using edge computing. Moreover, we have investigated the following important factors: metrics for each quality attribute, trade-offs among the qualities, research type, and validation type. Finally, we propose a number of potential research areas that need further investigation to pave the way for design-time decision support for software component deployment. Specifically, the contributions of this paper are as follows:
• Identification of the qualities considered in the design of IoT applications using edge computing. • An analysis of the trade-offs between qualities that have been considered.
• Identification of the metrics used to quantify the qualities. This will both provide the researchers with a set of metrics for each quality and show the gaps in proposing new metrics.
• An analysis of the types of methods used to assess an IoT system with respect to the qualities, such as prototyping, simulation, and mathematical analysis.
• Identification of the knowledge gaps and future research directions.
The remainder of the paper is organized as follows. We discuss related work in Section 2 . In Section 3 , we describe the research method for our systematic mapping study and the mapping classification. We present the results of the mapping study in Section 4 in terms of the mapping classification which also corresponds to the answers to the research questions, and in Section 5 , we critically discuss the findings of the study and suggest future works.
2. Relatedwork
2.1. Edgecomputing
The research on edge computing is currently in a relatively early stage, and many challenges are yet to be solved [11] . The terms edge and fog computing are often used interchangeably [3] .
The concept fogcomputing was originally proposed by Cisco, and it is defined as an “extension of the cloud computing paradigm that provides computation, storage, and networking services between end devices and traditional cloud servers” [12] . Others (e.g. [2,13] ) have also proposed the idea of extending cloud computing and supporting multi-tenancy. NIST [14] has defined fog computing as “a horizontal, physical, or virtual resource paradigm that resides between smart end- devices and traditional cloud or data centers.” They propose six characteristics to distinguish fog computing from other computing paradigms: contextual location awareness and low latency, geographical distribution, heterogeneity, interoper- ability and federation, real-time interactions, and scalability and agility of federated fog-node clusters.
Similarly, the term edge computing is used with various meanings in the literature. Narrowly defined, it refers to lo- cal processing excluding both fog and cloud computing [2] ; in a broader definition, it is considered as any computing and network resources along the path between data sources and cloud data centers with the rationale of happening at the prox- imity of data sources [3] . In this article, we use the term edge computing in its broader scope and include any computing and storage resources (including fog computing) along the path between sensors/actuators and cloud servers.
2.2. Qualitiesinedgecomputing
In edge computing, different use cases utilize different architectures for the optimal support of end-users [14] . Accord- ingly, one of the challenges for IoT systems based on edge computing is where to deploy the application components to achieve the desired system qualities. A number of studies have investigated and compared various deployment alterna- tives. For instance, Sarkar et al. [15] compare edge and cloud computing by considering generalized models of delay, power consumption, and cost in order to evaluate the performance of IoT applications with and without the use of edge com- puting. Based on a simple simulation setup, they conclude that edge computing reduces energy consumption, latency, and cost [15] . To minimize the system cost, which is a weighted sum of delay and energy consumption, while guaranteeing the maximum tolerable delay, Du et al. [7] propose a centralized decision-making model to decide where the applications should be processed. Yousefpour et al. [16] , Taneja and Davy [9] , and Li et al. [17] propose application distribution solu- tions for a Fog-Cloud scenario based on minimizing IoT nodes delay. Liu et al. [18] propose a multi-objective optimization model for computation offloading. The approach processes requests for application distribution based on minimizing energy consumption, execution delay, and cost. Although some studies address the IoT application distribution problem in hybrid architectures, they usually consider a limited number of qualities for making a decision on where to deploy the application components. By considering Edge computing for IoT systems, Singh and Baranwal [19] propose several QoS metrics for com-
Table 1
The comparison of literature review studies.
Target domain Research Focus Reference model Shahzadi et al. [20] Edge computing frameworks Properties of edge computing
frameworks None – uses customized performance metric model Orsini et al. [21] Mobile Edge Computing (MEC) Characteristics of MEC
solutions
ISO/IEC 25010 quality characteristics Odun-Ayo et al. [22] IoT systems using edge and
cloud computing
Research methods and architectures
Not studied
White et al. [23] IoT systems IoT systems layers and
investigated qualities ISO/IEC 25010 quality characteristics Muccini et al. [24] IoT systems IoT architecture styles and
related qualities
None – uses customized quality model
This study IoT systems using edge
computing
Qualities and metrics in IoT systems using edge computing
ISO/IEC 25010 quality characteristics ISO/IEC 25023 quality measures
munications, things, and computation parts. However, they do not follow a systematic approach for extracting the quality metrics.
2.3. Literaturereviews
Few surveys or literature reviews consider the qualities of systems using edge computing. For example, Shahzadi et al. [20] conducted a survey to analyze the properties of edge computing frameworks. They consider several qualities for com- paring the frameworks, but the focus is on performance metrics only, like execution time, power consumption, scalability, network latency, and throughput. Additionally, they mainly focus on some of the existing frameworks for edge computing. Another study [21] investigates and compares existing Mobile Edge Computing (MEC) solutions. To achieve this, they use the ISO/IEC 25010 quality model to check which qualities each solution provides. They focus on MEC solutions that are considered a special case of edge computing, not on IoT applications.
Odun-Ayo et al. [22] conducted a systematic mapping study of the IoT systems utilizing edge and cloud computing. In this study, they focus on the research methods and architectures in this domain, but they do not consider any relevant qualities. By focusing on the QoS aspect of IoT systems, White et al. [23] investigate what layers of the IoT architecture and what quality attributes have been the most researched. They also consider ISO/IEC 25010 as a base model for quality mapping. Muccini and Moghaddam [24] conducted a systematic mapping to study IoT architecture styles. Among other things, they investigate the quality attributes supposed to be satisfied with a proper IoT architecture—namely, scalability, security, interoperability, and performance. However, neither of these two mapping studies investigates qualities for IoT systems using edge computing and the related metrics.
We argue that there is a lack of systematic literature studies identifying relevant quality attributes for IoT systems us- ing edge computing (see Table 1 ). We believe the study presented in this article is an important step toward a general framework for supporting IoT system designers considering various influencing qualities.
3. Researchmethod
In this section, we provide detailed information about the method used for this study. We conducted a systematic map- ping study following the guidelines proposed by Petersen et al. [25,26] . After specifying the research questions, we defined and applied a search string to find relevant papers. After defining and applying inclusion and exclusion criteria, we selected the most relevant papers. We classified the papers into identified categories based on the research questions, and in the next step, we extracted the data. We then analyzed the results to answer the research questions.
3.1. Researchmotivationsandquestions
Making decisions in the design of IoT systems—such as where to host the different components of IoT applications or what type of hardware, development frameworks, and algorithms to use—is not simple and straightforward [10] . A system designer needs to take several quality attributes into consideration. The emergence of edge computing and the possibility to host IoT application components in local nodes or even in things make design decisions even more challenging. The main motivation for our work is to understand which qualities have been considered for IoT applications using edge computing and how they have been measured. Accordingly, we have conducted a mapping study to extract the investigated qualities, the tradeoffs between qualities, and the metrics used for assessing these qualities in order to identify the gaps and future research directions. Moreover, we have identified the types of research that have been conducted (e.g., solution proposal
Table 2
Number of downloaded papers from the different databases. IEEE Xplore 103 Scopus 233 Science direct 27 Web of Science 80 Total 443
and experimental studies) and the validation methods that have been used (e.g., simulation and prototyping). The following research questions guided our study:
RQ1: What quality attributes have been considered for IoT systems using edge computing? RQ2: What metrics have been used for measuring the qualities?
RQ3: What trade-offs between qualities have been investigated? RQ4: What types of research have been conducted in this area? RQ5: What methods of validation have been used?
3.2. Search
Following [27] and [25] , we used the PICO (Population, Intervention, Comparison, and Outcome) method to construct the search string based on the research questions. However, as discussed in [25] , PICO is not always fully applicable for systematic mapping studies, and using Population and Intervention is sufficient to construct the search string. In this study, we also identified our keywords by Population and Intervention.
Population: Based on our research aim, the population of this research is IoT systems that use edge computing. Therefore, two basic keywords of “IoT” and “Edge computing” were extracted from the population part.
Intervention: Intervention refers to a tool, technology, methodology, or procedure. In the context of this study, the inter- vention is the quality attributes that have been used in the literature to evaluate IoT systems. Thus, “quality attribute” is a keyword extracted from intervention.
Based on the identified keywords “IoT,” “Edge computing,” and “quality attributes,” we constructed three sets of keywords in order to organize the search string with synonyms and related keywords.
Set1: Search terms directly related to edge computing. We identified the keywords “edge computing” and “fog comput- ing” used interchangeably in the literature.
Set2: Search terms directly related to IoT. For this set, the terms “IoT” or “Internet of Things” are used interchangeably.
Set 3: Search terms directly related to evaluating quality attributes. The “attributes” keyword has also been referred to as “criteria” or “metrics” in the literature. Consequently, we structured the primary search keywords for this set as follows: “quality attributes” OR “quality metrics” OR “quality criteria.”
The final search string contains a logical OR between all of the synonyms with a logical AND between the three sets. To begin with, we used the following search string: (((“fog computing”) OR (“edge computing”)) AND (“IoT” OR “Internet of Things”) AND (“quality attributes” OR “quality metrics” OR “quality criteria”)). However, the search result was limited, and we believed it was not representative of the literature. We found many papers using the term “performance” in the evaluation of an IoT system quality. Consequently, we added this term and modified Set 3 as follows: “quality attributes” OR “quality metrics” OR “quality criteria” OR “performance attributes” OR “performance metrics” OR “performance criteria.” However, after analyzing the search results, we found it was biased towards the performance quality attribute and did not capture other attributes mentioned in the ISO/IEC standard 15,010 [28] , for example, security that is well-studied in the literature. Then we changed Set 3 to just capture “quality” without “metrics,” “criteria,” and “attributes.” However, the result was too noisy, and we found many unrelated papers. By removing “quality” from Set 3, we found good coverage of the literature with an acceptable number of noisy findings. Thus, the final search string was as follows:
(((“fog computing”) OR (“edge computing”)) AND (“IoT” OR “Internet of Things”) AND (“metrics” OR “attributes” OR “cri- teria”)).
From the well-known databases in the field of computer science, we followed the suggestions by Petersen et al. [25] and selected Scopus, IEEE Xplore, Science Direct, and Web of Science for our search. These databases support nested Boolean operators and searching for titles, abstracts, and keywords. When applying the final search string to the four databases, we got 443 hits in total, see Table 2 .
3.3. Studyselection
To select the relevant papers, we needed to define inclusion and exclusion criteria. To form these criteria, we followed Petersen et al.’s [25] suggestion and did a pilot study on 20 papers. The following criteria were applied to the papers, first based on the abstract and, where necessary, the full paper.
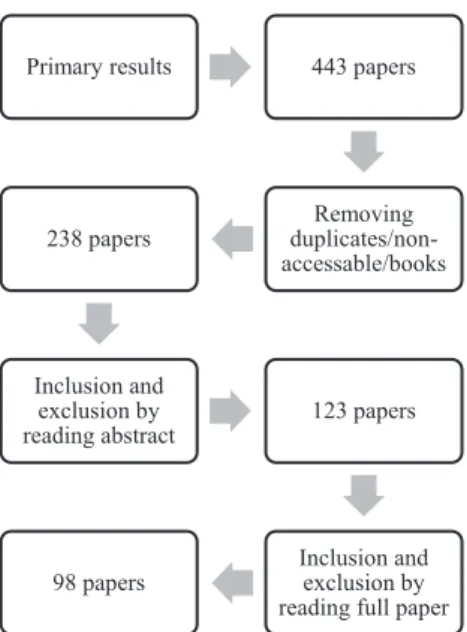
Fig. 2. The paper selection process.
Inclusioncriteria:
• Studies published online before 01/01/2020.
• Studies evaluating and measuring qualities using at least one metric. • Studies considering the usage of edge computing for IoT systems.
Exclusioncriteria:
• Studies presenting non-peer-reviewed material.
• Studies referring to the words “metric”, “attribute”, and “criteria” for purposes not related to qualities. For example, if a paper uses attribute-based encryption, the word “attribute” refers to a specific technique for encryption, not to a quality attribute.
• Books and book chapters. • Studies not accessible in full-text. • Duplicates.
• Secondary studies, e.g., literature reviews. • Studies not written in English.
We took the following steps to select the papers to be included in the mapping study, which are also illustrated in Fig. 2: • Removing duplicates/books/non-accessible/non-English papers: We removed identical papers based on the paper title and authors (one was kept). Moreover, we set aside non-accessible papers, as well as books and book chapters. This step eliminated 205 papers.
• Applying inclusion and exclusion criteria to abstracts: We removed 115 papers based on applying inclusion and exclusion criteria to the abstracts.
• Applying inclusion and exclusion criteria to the full paper: After reading the full text of the remaining papers, we re- moved 25 papers, resulting in 98 papers.
3.4. Dataextraction
As suggested by [25] , we performed a group discussion based on a pilot study to construct the mapping classifications for extracting data. Based on several iterations and group discussions among the authors, the data extraction followed five classification perspectives. After resolving disagreements, the first author performed the extraction of data for the remaining papers, but the other authors also verified the results. The details of each classification are discussed below.
3.4.1. Qualityattributes
This mapping study’s main motivation was to identify the quality attributes that have been taken into account when evaluating IoT systems. For this study, we used the ISO/IEC 25010 quality model [28] to classify the quality attributes. The quality model comprises eight root quality attributes (with sub-qualities for each root quality) as shown in Fig. 3 and ex- plained in the following (based on the ISO/IEC 25010 definitions):
Fig. 3. ISO/IEC 25010 quality model, including eight root qualities and their sub-qualities.
• Functional suitability: the degree to which a product or system provides functions that meet stated and implied needs when used under specified conditions.
Performance efficiency: the performance relative to the amount of resources used under stated conditions.
• Compatibility: the degree to which a product, system, or component can exchange information with other products, sys- tems, or components and/or perform its required functions while sharing the same hardware or software environment. • Usability: the degree to which a product or system can be used by specified users to achieve specified goals with effec-
tiveness, efficiency, and satisfaction in a specified context of use.
• Reliability: the degree to which a system, product, or component performs specified functions under specified conditions for a specified period of time.
• Security: the degree to which a product or system protects information and data so that persons or other products or systems have the degree of data access appropriate to their types and levels of authorization.
• Maintainability: the degree of effectiveness and efficiency with which a product or system can be modified to improve it, correct it, or adapt it to changes in environment and in requirements.
• Portability: the degree of effectiveness and efficiency with which a system, product, or component can be transferred from one hardware, software, or other operational or usage environment to another.
3.4.2. Metrics
A metric (or measure) is used to quantitatively evaluate a quality. In this study, we used the ISO/IEC 25023 standard for quality measures [33] to classify the metrics. ISO/IEC 25023 standard is based on the ISO/IEC 25010 quality model and defines a large number of metrics and metric categories for the eight root quality attributes listed above.
3.4.3. Trade-off betweenqualities
Studying trade-offs between different aspects of a system is highly beneficial for decision-making. We categorized the papers based on whether they have investigated trade-offs between the quality attributes. A paper is considered as investi- gating trade-offs if it explicitly states or considers trade-off handling as one of the contributions.
3.4.4. Researchtype
Considering topic-independent and general classifications enable researchers to compare different mapping studies from a similar perspective [25] . Here, we use the research type classification schema proposed by [29] , which consists of six research types as follows:
• Solution proposal: proposes a solution technique, which must be novel or at least a significant improvement of an exist- ing technique.
• Validation research: investigates the properties of a solution proposal that has not yet been implemented in practice. The same authors or others may have proposed the solution elsewhere. Possible research methods are experiments, simulation, prototyping, mathematical analysis, mathematical proof of properties, etc.
• Evaluation research: investigates a problem in practice or an implementation of a technique in practice, such as case study, field study, field experiment, or survey. The novelty of the technique is not an evaluation criterion for the paper. • Philosophical paper: aims for a new way of looking at things, a new conceptual framework, etc.
• Personal experience paper: documents the author’s experience about one (or more) project and contains a list of lessons learned.
• Opinion paper: contains the author’s opinion about what is wrong or good about something, how we should do some- thing, etc.
3.4.5. Validationmethods
Different methods can be used to validate a research study [29] . In this study, the following categories of validation methods are considered:
• Experiments: Performing large-scale experiments in a test bed or the real world. • Simulation: Modeling and simulating the environment and the problem. • Prototyping: Developing a small-scale lab demo system for validation.
• Mathematical analysis: Mathematically analyzing some aspects, such as time behavior. • Mathematical proof: Mathematically proving a hypothesis or a proposed solution.
3.5. Validityevaluation
To evaluate the validity of the mapping study, we follow the suggestions by [25] . Below we discuss how we addressed threats to validity in this study.
Descriptivevalidity is the extent to which observations are described accurately and objectively, and threats to descriptive
validity are generally higher for qualitative studies than for quantitative ones [25] . We used quantitative data collection and visualization in this mapping study, which reduces the risk of this threat. Moreover, we tried to clearly state the paper se- lection, inclusion and exclusion, classification, and data extraction steps. We also tried to describe the results of the mapping study in detail in Section 4 .
Theoreticalvalidity should take into account the quality of the sample of studies obtained from the population and po-
tential researcher bias in the study selection and data extraction and classification.
• Study identification: It is possible that two mapping studies with the same subject select different sets of articles [30] . To reduce this threat, we used the PICO approach to systematically extract the keywords according to the aim of the research. We also performed group discussions to find the keywords based on known terms in the literature. Regarding the paper selection, we used well-known databases and a clear search string to reduce this threat. In order to identify the candidate papers for the mapping study, we also conducted a pilot study with group discussion to clearly define inclusion and exclusion criteria. Selecting papers by the inclusion/exclusion criteria was performed by the first author, which may incur a bias in study selection. To reduce this threat, all authors verified the application of the criteria for the borderline cases.
• Data extraction and classification: As explained in Sections 3.4 , the first author extracted the data, which may introduce bias to the final results. To reduce this threat, we performed group discussions on unclear data extraction parts to reach an agreement. However, human judgment is generally prone to bias and cannot be completely eliminated.
Interpretivevalidity takes into account the validity of mapping study discussion and conclusions based on the results. In
the mapping study, we relied on a quantitative analysis of the extracted data. In the discussion and conclusions, we tried to draw conclusions based solely on the quantitative results to reduce the risk of unclear conclusions.
Generalizability considers the degree to which we can generalize the results inside or outside of the studied population.
By utilizing a systematic way to construct the search string, identify studies, and extract results and by having continuous group meetings to clarify the unclear parts, we believe this work provides a good population sample that can be generalized inside the population. However, since the study was designed for IoT systems using edge computing, the results may not apply to other related populations, like IoT systems in general or cloud computing.
4. Results
In this section, we present the findings of our study structured in terms of the classification provided in the previous section (which also corresponds to the answers to the investigated research questions). The section is concluded by summary of the main findings through answering the research questions.
4.1. Qualityattributes(RQ1)
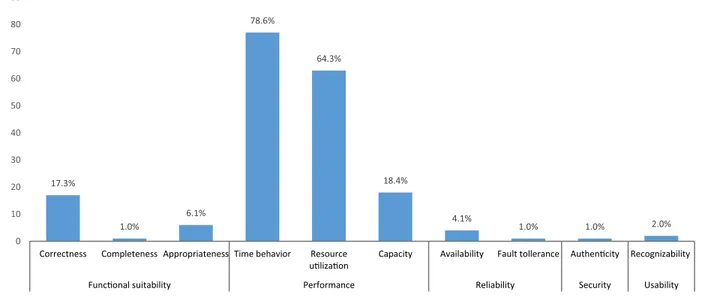
Fig. 4 shows the extent to which different qualities have been studied in the reviewed papers. More details about which papers address the different quality attributes are presented in Table B.1 .
Fig. 4. The ISO/IEC 25010 qualities used by the literature and how often they are used.
The most commonly studied quality type is performance efficiency. Among the performance qualities, time-behavior has been studied by 78.6%, resource utilization by 64.3%, and capacity by 18.4% of the papers. According to the ISO/IEC 25010 definition, timebehavior refers to “response and processing times and throughput rates of a product or system.” In the re- viewed studies, time behavior mainly refers to the different types of latency in the system. Latency has been mentioned as one of the main motivations for moving from the centralized cloud-based approaches to the distributed edge-based service provisioning [2] , which is supported by its frequent use in the reviewed studies (e.g., P2, P10, P19, P119, and P137). Through- put of processed tasks or requests is another important aspect of the time behavior quality that has been investigated (e.g., P16 and P37).
Resource utilization, the second most studied quality, refers to “amounts and types of resources used by a product or
system”. In the studied literature, this quality mainly refers to the efficiency of the use of the available processing, storage, and network resources, as well as to the system’s energy consumption. Efficient resource allocation is one of the main challenges in computation and consequently edge computing [4] . Thus, a major portion of the papers predictably consider it one of the main qualities for their evaluations (e.g., P2, P81, P110, and P133).
Capacity is the third most commonly used performance quality. It refers to the “maximum limits of a product or system”.
In the context of edge computing, the maximum amount of processed services, processing, and network capacity have usually been used to refer to the capacity of the system (e.g., P35 and P68).
As shown in Fig. 4 , functional suitability is the second most used quality type, and there are three qualities studied: functional completeness, correctness, and appropriateness. The most common is functionalcorrectness, defined as “degree of precision of a product or system.” In edge computing, this mainly refers to accuracy or precision (e.g., P1, P9, and P100).
Functionalappropriateness is defined as “facilitating the accomplishment of specified tasks and objectives.” Functional
com-pleteness refers to “covering all the specified tasks and user objectives.” It is used only in one paper (P74).
Reliability, security, and usability are the other quality types investigated by the reviewed literature. While edge devices vary in type and capabilities with different types of failure protection, providing highly reliable services for the end-users is one of the major challenges. For reliability, five papers investigated availability, and only one paper investigated fault
tolerance.Availability is the “degree to which a system, product or component is operational and accessible when required
for use,” and faulttolerance refers to “operating as intended despite the presence of hardware or software faults.” Regarding
security, we found only one paper that used the authenticity quality (P4), which is measured by the degree of trust. Finally,
concerning usability, two papers (P9 and P111) measured appropriatenessrecognizability, which is defined as recognizing the appropriateness of a product or system by the user.
4.1.1. Thenumberofqualities
The number of measured qualities shows how well different aspects of a solution have been investigated quantitatively (see Fig. 5 ). The number of qualities for each paper is presented in Table B.1 . As we can see in Fig. 5 , about half of the papers consider two qualities. Most of them consider time behavior and resource utilization (e.g., P19, P23, and P29). Moreover, 27% of the papers consider only one quality attribute, and as expected, time behavior (P20, P27, and P31) and resource utilization (P93, P112, and P133) are the most used ones. Among the papers that considered three qualities, time behavior, resource utilization, and capacity are the most common (P16, P37, P62, P64, P68, P98, and P107). Functional correctness (P91, P115, and P139) and functional appropriateness (P106 and P117) are also considered in the literature, alongside resource utilization
Fig. 5. The percentage of the number of qualities used in the literature to evaluate an IoT system.
Table 3
The most used metrics for the most used qualities.
Quality Most used metrics
Time behavior Response time, turnaround time, throughput
Resource utilization Processor utilization, bandwidth utilization, energy consumption, edge/cloud devices utilization Capacity Transaction processing capacity
Functional correctness Functional correctness (accuracy, precision and errors)
and time behavior. Finally, four qualities were used in three studies (P53, P68, and P125) for evaluating by measurement. Importantly, some papers measure several aspects of a specific quality attribute. For example, P53 evaluates time behavior through end-to-end delay, waiting time, and completion time. However, based on the ISO/IEC 25010 standard these different aspects refer to one quality that is time behavior.
4.1.2. Qualitiesstudiedincomparisonsbetweenedgeandcloudcomputing
The comparison of deployment on edge and cloud computing is another aspect we investigated in this study. We found 20 papers that performed a comparison: P8, P11, P35, P40, P42, P43, P53, P62, P75, P90, P97, P103, P104, P105, P108, P114, P119, P124, P136, and P137. The most commonly used quality for the comparison is time behavior, which was studied in 19 papers (all except P35). Resource utilization was used in 10 papers (P8, P42, P43, P62, P75, P90, P104, P119, P124, and P126), capacity in two papers (P35 and P75), fault tolerance in one paper (P53), and functional appropriateness in one paper (P103). Considering other qualities for this comparison is clearly a gap that needs to be addressed by future studies.
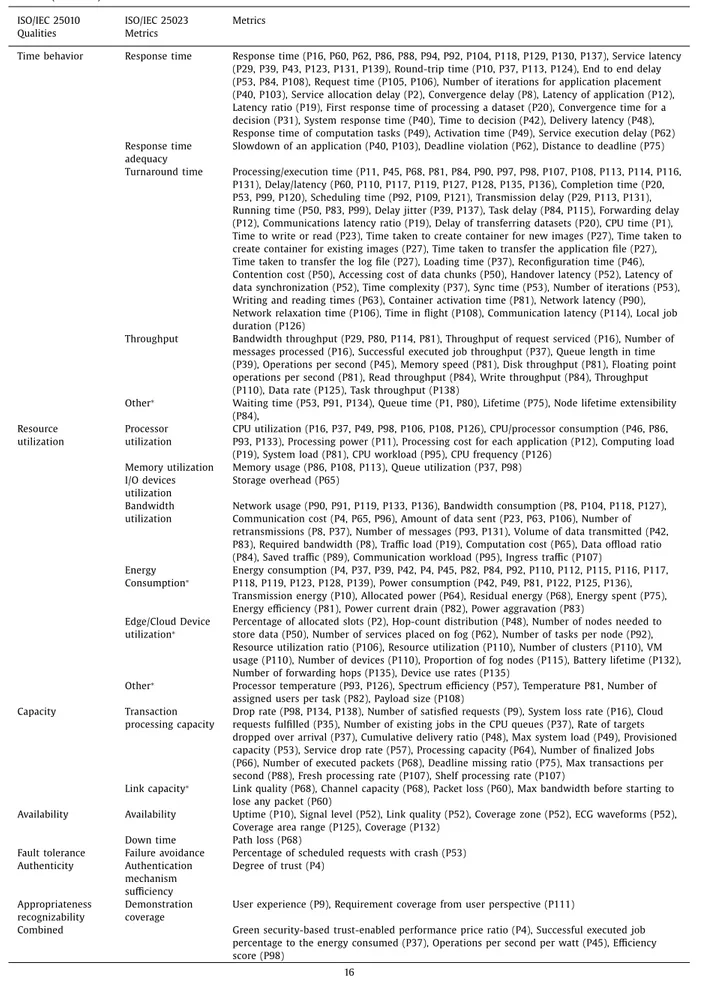
4.2. Metrics(RQ2)
To address RQ2, we considered the quantitative measurement of the qualities to extract the utilized metrics. After ex- tracting the metrics, we found that a large number of different metrics have been used for each quality. To handle this complexity, we classified them by considering suggested metric categories in ISO/IEC 25023 [33] . Additionally, we found that some of the extracted metrics cannot be classified according to the ISO/IEC metrics, so we considered new categories for those metrics. Table B.2 shows detailed information of the extracted metrics. For increased readability, we removed statistical terms like “average,” “mean,” and “total amount.” Moreover, we introduce a combined category for the metrics referring to more than one quality. A summary of the most used metrics for the most used qualities is provided in Table 3 .
4.3. Trade-offsbetweenqualities(RQ3)
For studying trade-off handling, we included papers that explicitly state and consider trade-off handling as one of the contributions. Although 73% of papers considered two or more qualities, only 9% of papers used a method to handle trade- off among different qualities. Considering a trade-off between time behavior and resource utilization has been the most frequent (P39, P43, P50, P62, P64, and P68). In addition to time behavior and resource utilization, P64 considered capacity in the tradeoff. In two papers (P96 and P115), a trade-off between resource utilization and functional correctness has been studied. Finally, P4 proposed a tradeoff evaluation between resource utilization and authenticity.
The papers used various techniques for trade-off handling. To find optimal point considering delay and energy, P 39 used Lyapunov optimization technique, whereas P43 used BIP and genetic algorithms for the same trade-off. P62 considered genetic algorithm (GA) as a heuristic approach to maximize the number of service placements to fog resources. Meanwhile,
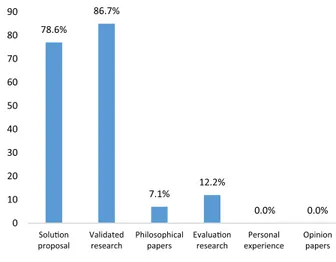
Fig. 6. Number of papers for each research type.
P50 used an approximation algorithm for the Connected Facility Location (ConFL) problem for handling a trade-off between latency and resource usage. In P64, an optimization problem is formulated and solved with a binary-search water-filling algorithm. The authors in P68 proposed their own heuristic algorithm to handle the trade-off between latency and energy consumption. In P4, they utilized a Bi-level programming model (horizontal and vertical optimization) to find the optimal point in multi-objective NP-hard problem for multiple qualities. Finally, to achieve a tradeoff between energy consumption and the fair task offloading, P115 defined a new metric.
4.4. Researchtypes(RQ4)
As Fig. 6 shows, the majority of the papers are solution proposals and validated research. About 86% of the papers validated a solution through prototyping, simulation, or mathematical analysis. A common process was to propose a new solution and then validated the solution by prototyping or simulation (e.g., P16, P19, and P20). Moreover, some of the pa- pers have performed evaluation research (e.g. P10) and conducted a philosophical type of research (e.g., P11 and P45). The domination of solution proposal and validated research may be due to the fact that the concept of edge computing was introduced recently and there are still many opportunities to explore. Therefore, a high portion of research mainly proposes new solutions in order to make it mature enough for practical use cases in the near future. More details about the papers’ research type can be found in Table B.2 .
4.5. Validationmethods(RQ5)
Research on Edge-Cloud architectures for IoT systems analyzes quality attributes in various ways. We extracted the vali- dation types based on the definition of validationresearch. Since edge computing is still in an early stage and real implemen- tations are few, the reviewed papers often utilized simulation or prototyping to evaluate a system or validate their proposed solution. As can be seen in Fig. 7 , simulation is by far the most popular method (e.g., P29, P30, and P35). While Prototyping is also a popular method (P27, P46, and P49), the problems of scalability and limited real-world conditions are weaknesses of this type of evaluation. Mathematical analysis and mathematical proof are the other approaches to validate proposed claims, and they are specifically used for optimization and resource allocation problems (P19 and P20). A few studies (P23 and P63) considered large-scale existing test-beds to evaluate a solution in terms of quality attributes. More details can be found in Table B.3 .
4.6. Summaryofmainfindings
Below we list the main findings from our study structured according to the research questions: • RQ1: What quality attributes have been considered for IoT systems using edge computing?
◦ The most investigated qualities relate to performance efficiency, in particular time behavior and resource utilization, which were studied in a majority of the papers.
◦ Functional suitability was studied in about 20% and reliability in about 5% of the papers.
◦ Very few studies measured security and usability qualities, and no studies were found that measured compatibility, maintainability, and adaptability, although they can be considered important for IoT systems.
Fig. 7. The validation methods used in the papers that included validated research.
◦ The majority of the papers considered just one or two qualities for quantitative evaluation. • RQ2: What metrics have been used for measuring the qualities?
◦ The most used metric categories are response time, turnaround time, throughput, correctness, processor utilization, bandwidth utilization, energy consumption, edge/cloud device utilization of devices, and transaction processing ca- pacity.
• RQ3: What trade-offs between qualities have been investigated?
◦ The trade-off between time behavior and resource utilization is the most commonly studied. ◦ The papers consider the trade-offs among just two or three qualities.
• RQ4: What types of research have been conducted in this area?
◦ Solution proposal and validated research are by far the dominating research types. • RQ5: What methods of validation have been used?
◦ Simulation is by far the most used validation method.
5. Discussion
We conducted this mapping study mainly to identify the qualities that have been considered by the literature on IoT systems using edge computing and investigate how those qualities were used. . Below we provide a discussion regarding the findings, challenges, and research gaps.
5.1. Investigatedqualitiesandmetrics
As shown in Fig. 4 , performance qualities consisting of timebehavior, resource utilization, and capacity were the most investigated qualities in the literature. Completeness,appropriateness, and correctness for functionalsuitability;availability and
fault tolerance for reliability;security; and usability have also been investigated but to a much lesser extent. However, there
is just one paper focusing on security, while a large portion of the research studies on IoT and edge computing focus on security [31] . This may relate to the fact that studies investigating security do not evaluate their results using security met- rics; they usually consider the performance-related qualities such as latency and resource usage to measure the efficiency of a security solution.
We also found that compatibility,portability, and maintainability have not been addressed by the literature. This can be interpreted in two ways: (1) these qualities are not relevant in the studied domain; or (2) there is a gap in the research, and more studies should be conducted for those qualities. We argue that these qualities are important in the edge com- puting domain. Portability refers to “degree of effectiveness and efficiency with which a system, product or component can be transferred from one hardware, software or other operational or usage environment to another.” Clearly, service migra- tion and dynamic placement of application components on different edge resources are one of the main features in edge computing investigated in several research studies [34] [35] . Similarly, compatibility, which refers to the “degree to which a product, system or component can exchange information with other products, systems or components,” is relevant for edge computing. Heterogeneous devices and applications should work together to provide the required infrastructure for IoT ap- plications [35] . The relevance of maintainability for edge computing may be motivated, for example, through its sub-quality
modularity, which refers to the “degree to which a system or computer program is composed of discrete components such
Table 4
Supported metrics by edge computing simulators.
Simulators Supported metrics
iFogSim [36] Response time, processing delay, bandwidth utilization, processing utilization, energy consumption FogNetSim ++ [37] Processing delay, network delay, energy consumption, transaction processing capacity
EdgeCloudSim [38] Response time, processing delay, network delay, bandwidth utilization, capacity IoTSim [39] Processing delay, bandwidth utilization, processing utilization
FogTorchII [40] Processing delay, network delay, bandwidth utilization, memory utilization, I/O device utilization EmuFog [41] Response time, network delay
FogBed [42] Response time
distributed way in edge and cloud solutions, its components need to be modular. A higher degree of modularity will provide more possibilities for distributed deployment.
Another finding is related to the quality model in ISO/IEC 25010. We found that this model does not include some well- known qualities studied in the IoT literature, such as energy consumption and trust. Although energyconsumption has been broadly used in the literature, there is no good match for this metric in the ISO/IEC standard. In this study, we classified energy consumption under the resourceutilization quality, considering power as a resource of a system. For trust (studied in P4), we found authenticity as the closest quality to map it to, although we believe there are some differences.
Moreover, the number of measured qualities shows how different aspects of a solution have been investigated quantita- tively. The results presented in Fig. 5 imply that 80% of the papers consider just one or two quality attributes for quantitative evaluation. We believe that although research directions on measuring specific qualities are highly beneficial to understand the behavior of the system from a certain point of view, there is also a need for more general frameworks that consider measuring more qualities and propose an overall evaluation based on different qualities and their trade-offs. We also investi- gated comparisons between different cloud and edge computing solutions. Based on the findings, timebehavior and resource
utilization are the most used quality attributes. Clearly, there is a gap in comparing cloud vs. edge solutions by considering
other qualities.
It is also worth mentioning that there are several important aspects of IoT systems, such as the heterogeneity and loca- tion of edge nodes, and the mobility of devices as well as end-users, which influence the deployment decisions. How well an IoT system can manage these aspects can be captured by qualities like interoperability,availability, and adaptability. For example, to support mobility, it is typically important that the system has high availability and low latency. Regarding the heterogeneity and location of edge nodes, the physical infrastructure is in some cases already in place when the system designer makes the deployment decisions, whereas in other cases the designer also specifies the physical infrastructure in- cluding the placement and type of the edge devices. We believe that the relation between quality attributes and aspects such as heterogeneity, location, and mobility needs further study.
5.2. Trade-off handling
Our analysis shows that the main focus has been on handling trade-offs among performance qualities. Moreover, in han- dling the trade-offs, the papers usually consider two or a very limited number of qualities. However, in many applications, additional key qualities need to be considered in the trade-offs, for example, trade-offs between correctness, availability, la- tency, resource usage, capacity, and energy consumption. Based on the presented results, the common trend is to investigate a trade-off between timebehavior and resourceutilization. Thus, two major gaps are evident: (1) considering other qualities in a trade-off and (2) considering a trade-off among all qualities in a single framework. For the first gap, a trade-off needs to be considered between each quality and other qualities that may impact, for example, considering a trade-off between
availability and latency or resourceutilization. For the second gap, a general framework needs to be proposed that contains
all the important qualities. Then, insights about different possibilities can be provided based on the design requirements and preferences.
5.3. Researchtypesandvalidationmethods
As shown in Fig. 6 , solutionproposal and validatedresearch are the dominant research types. This seems reasonable since we focused on the metrics, attributes, and criteria for assessing IoT systems that use edge computing. However, as the re- search in edge computing is still at an early stage, more philosophical studies are expected in the future. Additionally, among the validated research types, we found that simulation is the most popular. This is also reasonable due to budget limitations and the lack of practically implemented solutions for edge computing. However, simulation hinders or at least complicates measuring some of the quality attributes like security and interoperability. Another reason why some qualities like latency, energy consumption, and resource usage have been explored the most might be that using simulation to measure such qualities is easier compared to others. In Table 4 a list of edge computing simulators and the supported metrics is provided (more details are available in [32] ). Further, we believe that research should be conducted to identify the quality attributes
and metrics currently supported by the simulators and investigate additional potential capabilities that could support more realistic simulations by considering various quality aspects.
5.4. Futureresearchdirections
Based on the results and discussion, we identified several research gaps that require future studies. One of the primary findings is that the literature utilizes only a few metrics to measure some of the qualities (e.g., security and usability). Thus, quantitatively formulating these qualities and providing metrics for their measurement is an important direction for future work. Moreover, some of the qualities in ISO/IEC 25010 (e.g., compatibility, portability, and maintainability) have not been addressed by researchers even though they can be influential in the decision making process. Conducting more studies on the impact of these qualities for the deployment of IoT systems will provide a deeper understanding of their role in this domain.
Another gap is related to the number of qualities used for making a decision and comparing edge and cloud computing deployment solutions. Time-behavior and resource utilization are dominant qualities for making decisions and comparing deployment choices. We identified a similar trend for the trade-off handling among the qualities. It was evident that the literature mainly focused on handling trade-offs among performance qualities. Thus, another research direction is to consider other qualities for making a decision among different deployment solutions and to handle the trade-off between those qualities. Moreover, future research could also consider providing a decision-support framework that includes mechanisms to handle the trade-off among several qualities.
Finally, it would be interesting to know more about the impact of the application type with respect to the used qualities and metrics. However, in our study it was not possible to study this since only a few papers in the literature considered a specific application and analyzed the relevant qualities and metrics. The majority of the papers considered in our study did not focus on a specific application type, but rather, they proposed a general solution for all types of applications. The relation between application types and qualities is a topic that requires further investigation.
6. Conclusions
In this paper, we conducted a systematic mapping study aiming to identify the quality attributes and metrics used to evaluate IoT systems using an edge computing architecture. By applying inclusion and exclusion criteria, we selected 98 pa- pers for data extraction. By analyzing the papers, we identified the current trends and research gaps about quality attributes. Regarding the popularity of qualities, performances (i.e., time behavior, resource utilization, and capacity) were the most commonly used. We also found that although quantitative measurement of a quality is the typical evaluation method, there is a lack of established metrics for some of them, such as security, compatibility, portability, and maintainability. Moreover, the literature often evaluated only one or two qualities, and the analysis of the trade-offs between them was limited.
The following are some of the main research gaps that should be addressed in future work: (1) metrics for the less measured qualities, i.e., security, usability, compatibility, maintainability, and portability; (2) general frameworks considering measurements of multiple qualities and the trade-off between them; (3) considering qualities other than time behavior and resource utilization for making deployment decisions; and (4) extension of the available IoT simulators to support additional measurements.
DeclarationofCompetingInterest
The authors declare that they have no known competing financial interests or personal relationships that could have appeared to influence the work reported in this paper.
Acknowledgment
This work is partially financed by the Knowledge Foundation through the Internet of Things and People research profile (Malmö University, Sweden 20140035).
AppendixA.Listofallincludedpapersinthemappingstudy
P1 [43] , P2 [ 44 ] P3 [45] , P4 [46] , P8 [47] , P9 [48] , P10 [49] , P11 [50] , P12 [51] , P16 [52] , P19 [53] , P20 [54] , P23 [55] , P27 [56] , P29 [57] , P31 [58] , P35 [59] , P37 [60] , P39 [61] , P40 [62] , P42 [63] , P43 [64] , P45 [65] , P46 [66] , P48 [67] , P49 [68] , P50 [69] , P52 [70] , P53 [71] , P54 [72] , P57 [73] , P60 [74] , P62 [75] , P63 [76] , P64 [77] , P65 [78] , P66 [79] , P68 [80] , P74 [81] , P75 [82] , P78 [83] , P80 [84] , P81 [85] , P82 [86] , P83 [87] , P84 [88] , P85 [89] , P86 [90] , P87 [91] , P88 [92] , P89 [93] , P90 [94] , P91 [95] , P92 [96] , P93 [97] , P94 [98] , P95 [99] , P96 [100] , P97 [101] , P98 [102] , P99 [103] , P100 [104] , P101 [105] , P102 [106] , P103 [107] , P104 [108] , P105 [109] , P106 [110] , P107 [111] , P108 [112] , P109 [113] , P110 [114] , P111 [115] , P112 [116] , P113 [117] , P114 [118] , P115 [119] , P116 [120] , P117 [121] , P118 [122] , P119 [123] , P120 [124] , P121 [125] , P122 [126] , P123 [127] , P124 [128] , P125 [129] , P126 [130] , P127 [131] , P128 [132] , P129 [133] , P130 [134] , P131 [135] , P132 [136] , P133 [137] , P134 [138] , P135 [139] , P136 [140] , P137 [141] , P138 [142] , P139 [143] .
AppendixB.TheTables
Table B1
List of papers for each quality based on the evaluation methods. ISO/IEC 25010 root category Qualities Papers Functional suitability Correctness P1, P9, P48, P53, P80, P82, P87, P89, P91, P96, P100, P115, P120, P121, P122, P132, P139 Completeness P74 Performance Time-behavior P1, P2, P8, P10, P11, P12, P16, P19, P29, P23, P27, P29, P31, P37, P39, P40, P42, P43, P45, P46, P48, P49, P50, P52, P53, P60, P62, P63, P65, P68, P75, P80, P81, P83, P84, P85, P86, P88, P90, P91, P92, P94, P97, P98, P99, P103, P104, P105, P106, P107, P108, P109, P110, P113, P114, P115, P116, P117, P118, P119, P120, P121, P122, P123, P124, P125, P126, P127, P128, P129, P130, P131, P134, P135, P136, P137, P138, P139 Resource utilization P2, P4, P8, P10, P11, P12, P16, P19, P23, P37, P39, P42, P43, P45, P46, P48, P49, P50, P57, P62, P63, P64, P65, P68, P75, P81, P82, P83, P84, P86, P89, P90, P91, P92, P93, P95, P96, P98, P104, P106, P107, P108, P110, P112, P113, P115, P116, P117, P118, P119, P123, P124, P125, P126, P127, P128, P131, P132, P133, P135, P136, P139 Capacity P9, P12, P16, P37, P48, P49, P53, P57, P60, P64, P66, P68, P75, P88, P98, P107, P134, P138 Reliability Availability P10, P68, P125, P132 Fault tolerance P53 Security Authenticity P4 Usability Appropriateness recognizability P9, P111 Table B2
Extracted metrics, categorized by ISO/IEC 25023 (The metrics marked ∗are not included in ISO/IEC 25023.). ISO/IEC 25010
Qualities ISO/IEC 25023 Metrics Metrics Functional
Correctness Functional correctness Accuracy (P53, P89, P100), Square error (P80, P100), Number of raw data messages discarded (P1), Normalized mutual information (P48), Number of accomplished tasks (P82), Relative percentage deviation (P87), Total tardiness (P87), Successful rate (P87), Fair load balancing (P91), Top 1 accuracy (P96), Detection rate (P100), False positive rate (P100), False negative rate (P100), Precision (P100), F1-measure (P100), Mathew correlation coefficient (P100), Cohen’s Kappa K coefficient (P100), Fairness index (P115), Bonus score (P120), Service time error (P121), Recognition accuracy (P122), Packet reception rate (P132), Executed and failed tasks (P139) Functional
Completeness Functional coverage Requirements fulfillment index (P74) Functional
appropriateness
Functional appropriateness of usage objective
Number of task migrations (P101), Task disutility (P101), Compression rate (P102), Number of required runtimes (P103), Percentage of QoS satisfied applications (P106), Offloading overhead (P117), Preference level (P125)
Table B2 ( continued ) ISO/IEC 25010
Qualities ISO/IEC 25023 Metrics Metrics
Time behavior Response time Response time (P16, P60, P62, P86, P88, P94, P92, P104, P118, P129, P130, P137), Service latency (P29, P39, P43, P123, P131, P139), Round-trip time (P10, P37, P113, P124), End to end delay (P53, P84, P108), Request time (P105, P106), Number of iterations for application placement (P40, P103), Service allocation delay (P2), Convergence delay (P8), Latency of application (P12), Latency ratio (P19), First response time of processing a dataset (P20), Convergence time for a decision (P31), System response time (P40), Time to decision (P42), Delivery latency (P48), Response time of computation tasks (P49), Activation time (P49), Service execution delay (P62) Response time
adequacy
Slowdown of an application (P40, P103), Deadline violation (P62), Distance to deadline (P75) Turnaround time Processing/execution time (P11, P45, P68, P81, P84, P90, P97, P98, P107, P108, P113, P114, P116,
P131), Delay/latency (P60, P110, P117, P119, P127, P128, P135, P136), Completion time (P20, P53, P99, P120), Scheduling time (P92, P109, P121), Transmission delay (P29, P113, P131), Running time (P50, P83, P99), Delay jitter (P39, P137), Task delay (P84, P115), Forwarding delay (P12), Communications latency ratio (P19), Delay of transferring datasets (P20), CPU time (P1), Time to write or read (P23), Time taken to create container for new images (P27), Time taken to create container for existing images (P27), Time taken to transfer the application file (P27), Time taken to transfer the log file (P27), Loading time (P37), Reconfiguration time (P46), Contention cost (P50), Accessing cost of data chunks (P50), Handover latency (P52), Latency of data synchronization (P52), Time complexity (P37), Sync time (P53), Number of iterations (P53), Writing and reading times (P63), Container activation time (P81), Network latency (P90), Network relaxation time (P106), Time in flight (P108), Communication latency (P114), Local job duration (P126)
Throughput Bandwidth throughput (P29, P80, P114, P81), Throughput of request serviced (P16), Number of messages processed (P16), Successful executed job throughput (P37), Queue length in time (P39), Operations per second (P45), Memory speed (P81), Disk throughput (P81), Floating point operations per second (P81), Read throughput (P84), Write throughput (P84), Throughput (P110), Data rate (P125), Task throughput (P138)
Other ∗ Waiting time (P53, P91, P134), Queue time (P1, P80), Lifetime (P75), Node lifetime extensibility (P84),
Resource utilization
Processor utilization
CPU utilization (P16, P37, P49, P98, P106, P108, P126), CPU/processor consumption (P46, P86, P93, P133), Processing power (P11), Processing cost for each application (P12), Computing load (P19), System load (P81), CPU workload (P95), CPU frequency (P126)
Memory utilization Memory usage (P86, P108, P113), Queue utilization (P37, P98) I/O devices
utilization
Storage overhead (P65) Bandwidth
utilization
Network usage (P90, P91, P119, P133, P136), Bandwidth consumption (P8, P104, P118, P127), Communication cost (P4, P65, P96), Amount of data sent (P23, P63, P106), Number of retransmissions (P8, P37), Number of messages (P93, P131), Volume of data transmitted (P42, P83), Required bandwidth (P8), Traffic load (P19), Computation cost (P65), Data offload ratio (P84), Saved traffic (P89), Communication workload (P95), Ingress traffic (P107)
Energy
Consumption ∗ Energy consumption (P4, P37, P39, P42, P4, P45, P82, P84, P92, P110, P112, P115, P116, P117, P118, P119, P123, P128, P139), Power consumption (P42, P49, P81, P122, P125, P136), Transmission energy (P10), Allocated power (P64), Residual energy (P68), Energy spent (P75), Energy efficiency (P81), Power current drain (P82), Power aggravation (P83)
Edge/Cloud Device
utilization ∗ Percentage of allocated slots (P2), Hop-count distribution (P48), Number of nodes needed to store data (P50), Number of services placed on fog (P62), Number of tasks per node (P92), Resource utilization ratio (P106), Resource utilization (P110), Number of clusters (P110), VM usage (P110), Number of devices (P110), Proportion of fog nodes (P115), Battery lifetime (P132), Number of forwarding hops (P135), Device use rates (P135)
Other ∗ Processor temperature (P93, P126), Spectrum efficiency (P57), Temperature P81, Number of assigned users per task (P82), Payload size (P108)
Capacity Transaction
processing capacity
Drop rate (P98, P134, P138), Number of satisfied requests (P9), System loss rate (P16), Cloud requests fulfilled (P35), Number of existing jobs in the CPU queues (P37), Rate of targets dropped over arrival (P37), Cumulative delivery ratio (P48), Max system load (P49), Provisioned capacity (P53), Service drop rate (P57), Processing capacity (P64), Number of finalized Jobs (P66), Number of executed packets (P68), Deadline missing ratio (P75), Max transactions per second (P88), Fresh processing rate (P107), Shelf processing rate (P107)
Link capacity ∗ Link quality (P68), Channel capacity (P68), Packet loss (P60), Max bandwidth before starting to lose any packet (P60)
Availability Availability Uptime (P10), Signal level (P52), Link quality (P52), Coverage zone (P52), ECG waveforms (P52), Coverage area range (P125), Coverage (P132)
Down time Path loss (P68)
Fault tolerance Failure avoidance Percentage of scheduled requests with crash (P53) Authenticity Authentication mechanism sufficiency Degree of trust (P4) Appropriateness recognizability Demonstration coverage
User experience (P9), Requirement coverage from user perspective (P111)
Combined Green security-based trust-enabled performance price ratio (P4), Successful executed job percentage to the energy consumed (P37), Operations per second per watt (P45), Efficiency score (P98)