Geographical Information Systems as a Tool in
Sustainable Urban Development
Author: Emelie Walsund
Master Thesis in Built Environment (15 credits) Tutor: Joseph Strahl
Title: Geographical Information Systems as a Tool in Sustainable Urban Development
Author: Emelie Walsund
Master Thesis in Built Environment (15 credits) Tutor: Joseph Strahl
Spring Semester 2013 Sustainable Urban Management
Malmö University Faculty of Culture and Society
Acknowledgements
First of all, I would like to say thank you to Susana Pesce for giving me inspiration for this master thesis. A big thank to my supervisor Joseph Strahl at Malmö University for giving me advice in my work. Finally, to Henrik, for his encouraging words and patience.
Abstract
Sustainable development has been in focus since late 1980’s and the Brundtland report Our
Common Future. But the lack of a detailed common definition of sustainability makes the
work for a sustainable urban development difficult. This literature review examines how Geographical Information Systems (GIS), Remote Sensing (RS) and Decision Support Systems (DSS) can be used as tools to help achieve sustainable urban development with focus on the environmental aspect of sustainability. By reviewing former research within the subjects of GIS, RS, DSS and sustainable urban development, the wide potential of how to use GIS, RS and DSS in urban planning are presented. GIS and RS can be used to plan for water usage, actions to decrease air pollution and climate change adaption, and combined with a DSS, the software can help decision makers in the process of planning. Suggestion made are to implement the GIS and DSS early in the planning process, and to base action plan goals on what is realistic, in areas that are in greatest need of sustainability initiatives. There are vast amounts of research made within the subject of DSS and sustainable development, but there is a lack of consensus among the DSS developed, and many stays on the prototype level due to e.g. lack of data and hard to use software. Similar implications are experienced within the subject of GIS and sustainable development, but there are great potential of succeed, when the knowledge of GIS and DSS are spreading among planners and sustainability workers. One of the most important tasks of GIS users today is to inform and develop GIS to be more user friendly and easy to access data.
Keywords: Sustainable Urban Development, Geographical Information Systems, GIS, Remote Sensing, Decision Support System, DSS, Environmental Sustainability, Water, Water quality, Water Quantity, Air Pollution, Climate Change, Population Growth.
Table of Contents
Acknowledgements ... IV Abstract ... V
1. Introduction ... 1
1.1. Defining Sustainable Urban Development ... 1
1.2. What is Geographical Information Systems? ... 2
1.3. Research Question and Aim of Paper ... 3
1.4. Previous Research in the Area of GIS as a Tool in Sustainable Urban Management 3 1. 5. Abstract- Introduction ... 5
2. Method ... 5
2.1. Abstract- Method ... 6
3. Theory ... 6
3.1. Abstract- Theory ... 7
4. Water, Air, Climate Change and Population Growth – Challenges in Urban Areas and how GIS can help ... 7
4.1. Water Accessibility in Urban Areas ... 7
4.2. Using GIS to Map Water Accessibility in Urban and Wetland Areas ... 7
4.3. Air Pollution in Urban Areas ... 8
4.4. Using GIS to Map Air Pollution in Urban Areas ... 9
4.5. Abstract- Water, Air, Climate Change and Population Growth – Problematic in Urban Areas and how GIS can help ... 10
5. Criticism of Geographical Information Systems ... 10
5.1. Abstract- Critics of Geographical Information Systems ... 12
6. Geographical Information Systems and Decision Support Systems ... 12
6.1. Water ... 13
6.2. Air ... 14
6.3. Climate Change ... 16
6.4. Sustainable Development ... 17
6.5. Abstract Geographical Information Systems and Decision Support Systems ... 18
7. Discussion ... 19
8. Conclusion ... 21
1. Introduction
Sustainability have been discussed since the 1960’s and the publishing of Rachel Carsons’
Silent Spring, but the real work started in 1992 and the United Nations (UN) Earth Summit in
Rio de Janeiro (Bell and Morse, 2008). During this global summit a number of action points to achieve sustainable development were agreed upon among the participating nations, referred to as Agenda 21, and governments signing this agreement committed to action. Nowadays, it is virtually a rule to include sustainability as an approach and a part of set up goals in projects, funding applications and political ambition documents. But how can one decide and know what is sustainable and not? This has been under intense discussion since the Rio Summit in the beginning of the 1990’s, and the Brundtland report “Our Common Future” published 1987. In the Brundtland report sustainable development is defined as: "Development that meets the needs of the present without compromising the ability of future generations to meet their own needs” (UN, 1987).
What most definitions agree upon is mentioned in this definition; the management of resources so it may last for both current and future generations (see for example Pearce and Turner, 1990; IUCN et al., 1991). Another common feature is the three pillars of sustainability; social, economical and ecological (for example UN, 2002; Kates et al., 2005). But a common detailed definition of sustainable development is hard to find, hence implicating the work of understanding and compare sustainability between nations and cities. But to be able to, too some extent, relieve the work with achieving a sustainable development, the UN agreed upon a number of indicators on sustainable development. Examples of these indicators are (UN, 2007);
- Water use intensity by economic activity; cubic meters of water used per unit of value added (in US$) by economic activity, where water abstracted form the environment (permanently or temporarily) for own use and water used from other industries e.g. re-used water is included.
- Ambient concentration of air pollutants in urban areas; ground level air pollution concentration of e.g. ozone, particulate matter (e.g. PM10), sulphur dioxide, nitrogen dioxide and lead. The priority is collection of the indicator in urban areas. The indicator provides an indicator of environmental state in terms of air quality and is an indirect indicator of human exposure to air pollution of health concern in urban areas. By improving air quality in cities, the sustainable development of cities is promoted. - Population growth rate; the average annual rate of change of population size during a
specified period. Often separately reported for urban and rural areas, and indicates a trend for urbanization, and rural population migrating to urban areas are for many countries of concern.
This report will focus on the environmental aspects of urban sustainability, where a definition of this certain aspect will be presented in the next paragraph.
1.1. Defining Sustainable Urban Development
There have been numerous attempts trying to measure sustainability and put an exact measure on sustainability (Bell and Morse, 2008). But the lack of a consensus in defining
sustainability and sustainable development complicates the “measuring” and the many
complicates it even further. Since this report will have its focus on environmental sustainable urban development, the definition of sustainable urban development will be:
“Sustainable urban development can be defined as the spatial transformation of the urban environment and the quality of life of its inhabitants - through participatory, equitable, accountable and effective planning, management and governance processes and systems – making neighborhoods, towns and cities more environmentally sound, economically productive and socially inclusive for their present and future generations” (UN Habitat, 2010).
To be able to achieve this, to ensure that resources will not diminish, but last for generations to come, it is important to take many factors into account. One is carrying capacity and thresholds; a resource can only fulfill the needs for a limited number of people for a certain time until the resource needs to be renewed (Bell and Morse, 2008). When the resource no longer can fulfill the needs of the people for a certain time, a threshold has been met, and it is no longer sustainable. This way of thinking can both be applied globally, regionally and locally, in many areas such as water supplies, food security and fossil fuels supply. Environmental thresholds are further discussed in Rockström et al. (2009).
1.2. What is Geographical Information Systems?
Geographical information is information and data for a certain coordinate or location at a certain time e.g. elevation or vegetation coverage (Harrie, 2008). With this information, analyses can be made with Geographical Information Systems (GIS) over large areas and over long time periods. A GIS is “computerized information system with functions for collecting, storing, processing, analyzing and visualizing geographical data” (Authors’ translation; Harrie, 2008, p.14). This includes e.g. maps, statistics and satellite images. A GIS-software should be able to combine data from different sources, and to analyze and visualize spatial relations that otherwise would be hard to distinguish. GIS have three main application; visualization, selection and search (e.g. look where a person lives), and
graphical analysis (e.g. length or area or more advanced like shortest transportation
distance). Even more advanced applications are spatial correlation where e.g. correlations between health and air quality can be analyzed. Localization is a fifth application method, where a large number of geographical variables are analyzed together and based on certain demands and results in the ultimate location for e.g. a wind-power plant or a recycle station. Changes over time and space can be analyzed e.g. urbanization and what the land cover was before the city expanded or wet land areal today compared to 50 years ago. In studies like those, spatial correlations and underlying processes like environmental changes that have led to these variations can be analyzed.
Advantages with GIS is that a few number of ground truth points (control points located on ground that reveals the true features and materials, and can be used as calibration in RS and GIS) may be collected, and then the same data can be interpreted over large areas, e.g. land coverage, while at the same time complex relations and large amounts of data can become visualized in a graspable manner (Harrie, 2008). Satellite images and aerial photographs, so called Remote Sensing (RS), can be used to decide e.g. land classes, while GIS can be used to visualize the aerial photos and changes and ease the understanding of changes in e.g. land use and for urban planners and decision makers.
1.3. Research Question and Aim of Paper
This paper aims to create an overview of how Geographical Information Systems (GIS) and Remote Sensing (RS) can be used in sustainable urban development, and how GIS can help to make well-informed decisions in urban planning. To achieve this, the research question in this theoretical pre-study is;
- Can Geographical Information Systems and Remote Sensing be used as a tool to
achieve a sustainable urban development?
- Can Geographical Information Systems and Remote Sensing be used as decision
support in sustainable planning?
1.4. Previous Research in the Area of GIS as a Tool in Sustainable Urban Management
The usage of Geographical Information Systems and Remote Sensing within the field of sustainable development today is limited (Ball, 2007a). To combine the many factors that conducts sustainability is a complex issue, not only data wise, but also because there is no detailed definition of sustainability. But researchers and professionals see the potential of using GIS in the planning for a sustainable development; by mapping the same factor in different time spans and spatial areas an overview of changes is created, and hence make it easier and more correct to predict future changes, and make well founded planning decisions in urban areas (Ball, 2007b). Ball (2008) talks positively of the potential of GIS in sustainable urban planning:
“GIS is the ultimate decision support environment for amassing knowledge about a place. The layering of various site-assessment data gives the clearest possible picture of a site, and the impact that development will have on the surrounding environment. GIS provides a complete catalog of the surroundings, including: environment (botany, biology, ecosystems, etc.), transportation, community demographics, public safety, utilities, services and accessibility. The amassing of these tangible elements of a community go a long way toward informing the design process, and should always be considered with an increasing eye toward efficiency and sustainability”
even though there are criticism towards the usage of GIS which will be presented in section 5.
But there are areas where GIS today are used for planning; GIS has a large part in mapping, quantifying and understanding environmental indicators of sustainability. Yeh and Li (1997) identify three major areas of usage for GIS and RS in environmental urban sustainable development;
- Classification of results from RS data can be used to update land information in the GIS database. This is very useful when an area that is undergoing rapid change e.g. urbanization, have no former GIS or RS data.
- Improvement of land-use change detection and the usage of knowledge-based and reasoning decisions.
- Integration of GIS and RS in environmental modeling and analysis e.g. climate change scenario effects on vegetation patterns.
Also, as Yeh and Li (1997) argues, the usage and capacity of GIS and RS as a single tool in sustainable urban planning is far from complete, but it has many possibilities to evolve and further develop into a more powerful tool with its flexibility and as user-friendly.
An American company has developed the concept of Energy Points; a technique where cities energy consumption, water usage, CO2 emissions, waste generation etc. are recalculated into
one single unit- the amount of energy available in one gallon of gasoline (Energy points, 2013). This enables the possibility to compare different cities and areas sustainability. Not only are the water usage taken into account, but also the transportation of water from its source to its consumption point, whether the water is fresh, salt or polluted, it is a question about energy consumption. By the usage of GIS the distance of which water is transported can be calculates, as well as comparable results on national and global level can easily be visualized and understood.
Li and Yeh (2000) and Yeh and Li (1998) describe different methods for the planning of urban areas in a sustainable way, where fertile cultivated land is avoided for urban expansion. This is done by analyses in GIS softwares where factors such as average yield, soil type, slope angle etc. are taken into account. By this method, it can be decided which areas are more suitable for a built environment, and still have a local production of food and agricultural goods, as well as working opportunities.
Chang et al. (2008) analyses the complexity of landfill placement in urban areas, where many factors such as environmental, biophysical, ecological, and socioeconomic factors must be taken into consideration. By using a multi-criteria approach, i.e. putting different values on more or less desirable features of future landfill, the most suitable placement can be located. In this case study from Texas, U.S. some of the criteria were
- Not within 50 meter from a well - Not within 75 meter from a wetland - Not within 1 kilometer from a river - Not within 75 meter from a road
A soil-map was also taken into the analysis to determine the ecological habitat in the area, where the soil-type in the end determines to some extent the flora in the area, and thereby also the species richness, and what kind of habitat is easy to establish and maintain.
By combing these factors, an ultimate location for the landfill can be decided and visualized, in a much easier and time-effective way than if all sites would have been compared and decided on manually.
When it comes to model water quality and water quantity including effects of climate change using GIS, Ferrer et al. (2012) have made a study in the Mediterranean region of Júcar river basin in Spain. The authors have by the usage of GIS-based models evaluated the quality and quantity of ground water basins and surface water basins, and how ground water and surface water flows will be affected by climate change according to different SRES (Special Report on Emissions Scenarios, from IPCC, 2007a) emission and development scenarios. By understanding the monthly and yearly flows in the surface and ground water, it is easier to predict how much accessible and renewable ground water resources there will be, and also to assess changes in water accessibility and quality caused by climate change. By understanding this, urban planning can be easier facilitated when population increase and the demand for water changes. In the urban context, it is important to understand the effects that urban
pollution may have on water quality, e.g. fertilizers from agriculture and decrease in accessible oxygen in the water, which may cause eutrophication.
Air pollution has traditionally been mapped with GIS with two different approaches; spatial interpolation and dispersion modeling (Briggs et al., 1997). Spatial interpolation uses statistical or other methods based on measurements from the area in focus to model the pollution surface. Burrough (1986, cited in Briggs et al., 1997, p. 701) divides interpolation methods into global methods and local methods, where the former fits a single surface based on the entire data set, and the latter method estimates in the focus area are based on the nearest data point. There is also a method called kriging (unknown values for a location is interpolated based on known values from the surroundings), but there is no consensus of which method is the most optimal (Briggs et al., 1997). Dispersion modeling techniques have been widely used for point sources where all main factors contributing to pollution concentration are assessed. This model can rather easy be adapted to new areas and new pollutants, but the dispersion modeling technique also have some constrains; there is a high demand for data input where traffic network, traffic volume and composition, traffic speed, emission factors for all vehicles classes, street characteristics and meteorological conditions, and it is very rarely complete and for a sufficient and dense area. But by knowing these factors, a spatial model for traffic pollutants can be conducted in a GIS, and also changes in traffic networks and traffic concentration can be assessed and planned for.
1. 5. Abstract- Introduction
Sustainable development has been discussed since the 1960’s and has since been one focus subject in urban development. GIS have been used in this purpose for e.g. water, air and climate change planning and management and hence sustainable planning. Methods used within GIS and sustainable planning varies depending on what the wanted result is, and hence there is no universal method of using GIS in sustainable development. The usage of GIS and remote sensing can be widely useful in many aspects, sometimes just for visualizing a spatial situation, and sometimes for projecting and modeling changes in geographical variables.
2. Method
This paper is a mere literature study, evaluating the potential of using GIS, RS and DSS in planning for a sustainable urban development. This paper can be seen as a pre-study for a more practical study of water availability and air pollution for the transport sector in built and urban environments, where research and general methods for this purpose is presented and analyzed.
Literature review is a scientific examination method used to review research and scientific works, and to gain background knowledge within a subject (Gajos and Sierka, 2011). The role of peer reviews are to adjust former research and knowledge into new problems, with an analytic and critical approach; “The objectives and functions of the literature review are: description and evaluation of current knowledge for a given topic (research status) and arranging the knowledge”(Gajos and Sierka, 2011, p. 243).
The subject of study; GIS, RS and DSS have great potential to evolve into usable tools on the planning of a sustainable urban development, but there is not yet any extensive research within the subject. As mentioned earlier in the report, Yeh and Li (1997, 1998) and Li and
Yeh (2000) are the most prominent authors in the area when searching for keywords such as
GIS and sustainable urban development. But when expanding the keywords into e.g. GIS and water or GIS and air pollution, a wide list of results shows the variety of research that GIS
can be used within (e.g. Wienand et al., 2009; Toure et al., 2012; Gulliver and Briggs, 2011; Guttikunda and Calori, 2013), even though the articles may not have connected the usage of GIS in water and air related problematic to the field of sustainable urban development, although the authors have made a study improving sustainability. There were also a vast number of articles when searching with keywords such as GIS and DSS combined with water,
air, climate change or sustainable development (e.g. Assaf and Saadeh, n.d; Mavroulidou et
al., 2004; Thumerer et al., 2000; Ahamed et al., 2009). Scientific literature has been found through the databases LUBSearch (available through Lund University) and Summon (available through Malmö University) as well as the search engine Google Scholar.
2.1. Abstract- Method
This literature review can be seen as a theoretical pre-study and introduction to how GIS, RS and DSS are implemented in sustainable urban development in various cities and areas around the world. Literature have been found using search engines where scientific articles published in academic journals can be found, and the result from the searches indicates on a vast amount of research conducted within the subject.
3. Theory
Geographical Information Systems have a wide reach for usage and potential usage (Larsson et al., 2008; Campagna, 2006). Today, the usage can be for visualization for decision makers to improve and alleviate important decisions in e.g. landscape planning and expansion of urban areas, as well as more complex analyses such as climate adaption strategies, sea level rise planning, hydrological modeling and air pollution monitoring (Larsson et al., 2008). GIS and RS can be used to analyze point features, line features and polygon features, as well as continuously data covering large areas, where every pixel has its own value.
de Montis (2006) discusses the development of “cyberspace, cyberplanning and sustainability” (p. 313), making digital planning tools available for the public and organizations. This improves the chances of fulfilling the tasks set in UNs Agenda 21, where one of the most important tasks towards a sustainable development is to “improving the use of data and information at all stages of planning and management” (UN Division for Sustainable Development, 1992). Examples of where this have been implemented is the Eye On Earth GIS-portal developed by the European Environmental agency (available at http://eyeonearth.org/) where organizations share geographical information, both local and global, that anyone can use.
IPCC (2007a and 2007b) is the UN based Intergovernmental Panel on Climate Change, where local, regional and global effects of climate change are mapped and analyzed, and adaption and mitigation strategies for regions are developed.
There are also criticism towards GIS and how it can be used to homogenize different variability’s within society, and the limitations of GIS where the GIS-user can empathize results in the map, and leave out unwanted aspects of an issue (Schuurman, 2000). The critics of GIS had their era during the 1990’s, when geographical data experienced a rapid
development, and gained attention from many sectors, both from researchers and from the military.
As Campagna (2006) points out, there is a responsibility from the GIS researchers and users to spread the knowledge and to further investigate how GIS can solve sustainable development problems, and hence improve and facilitate a sustainable urban development.
3.1. Abstract- Theory
One of the most important tasks today is to make spatial data more accessible for everyone who is interested to use it, and to implement it in planning and management stages. During the 1990’s a wave of criticism towards the usage of GIS and its limitations was in focus, but have today calmed down.
4. Water, Air, Climate Change and Population Growth – Challenges in Urban
Areas and how GIS can help
4.1. Water Accessibility in Urban Areas
Water accessibility in both rural and urban areas is the foundation for existence, both for drinking and for sanitation. But due to climate change and population growth, water resources are of major concern (Dawadi and Ahmad, 2013). The effects of climate change on water quality and quantity is still uncertain, but demand is expected to increase at the same time as supply is expected to decrease because of climate change. The higher demand on water supplies is mainly due to population growth, temperature increase and industrial development. At the same time, a study conducted in 2010 showed that 50 percent of available water globally has already been allocated for human use (Gleick and Palaniappan, 2010). The global water system will hence be sensitive due to climate change and changed demands.
Dawadi and Ahmad (2013) have made a study in Nevada, USA, where they predict how climate change and population increase will affect water accessibility in the Las Vegas Valley. Based on different global climate models and population projections together with tourist population, precipitation, evaporation and ground water supplies they assess the pressure on water supplies in the area. Economical factors such as price demand on the water has also been taken into account. They modeled average runoff from the Upper Colorado River basin by using data such as monthly precipitation, mean monthly temperature and monthly potential evapotranspiration; the model then generated a monthly streamflow as output. To decide which impact climate change have on the streamflow, global climate models were used. A higher temperature increased the evaporation and earlier melt-off of snow packs in the area, are thereby disturbs the annual water cycle. Dawadi and Ahmnad (2013) have not used GIS or RS as tools for this article, but references used have GIS and RS based methods e.g. to decide soil moisture (Ahmad et al., 2010).
4.2. Using GIS to Map Water Accessibility in Urban and Wetland Areas
Panagopoulos et al. (2012) have mapped the changes of water usage in the Greek archipelago due to population growth, and mapped the water usage potential for the different parts of the city Mytilene on the island Lesvos. The authors made GIS based analyses over the city, and by using data such population density, slope angle, road network distance, distance from city
center, distance from coastline, land use/ land coverage, existing water supply and sewage network they could decide which areas were most suitable for a higher water demand, and thereby which areas were most suitable to expand the city to.
Piniewski et al. (2012) have used GIS to evaluate restoration methods for wetland in Poland. The Kampinos National Park is located close to the capital of Warsaw, which implies pressure on the wetlands, both from tourists visiting the area as well as urban expansion. This affects the ground water levels and river water levels in the area, and the biodiversity. The 2000 residents in the park have transformed large parts of the area into agricultural land, threatening the biodiversity in the area. By using a Digital Elevation Model (DEM), climatic and groundwater data, and soil and vegetation data, the author evaluated the correlation between anthropogenic activities in the area and ground water level, but due to lack of long term data of land use changes and water consumption from before the drainage of water in the national park started, no correlation could be found, but the authors strongly recommends to map historical changes in the area to make a more accurate evaluation. The authors also assessed five methods to restore the changed ground water levels in the Kampinos National Park, and the only one they assed to be sufficient were to fully restore the whole area to pre-drainage conditions by exclusion of all artificial pre-drainage systems in the park by filling up all ditches and canals.
4.3. Air Pollution in Urban Areas
From a health perspective, some the most hazardous traffic air pollutants are fine particles, NO2 (nitrogen dioxide), and O3 (ozone) (Jensen, 1998). The most critical and main
contributor to damage human health is believed to be the fine particles, especially for people suffering from respiratory and cardio-vascular diseases. But to measure ground-level emissions by fixed monitor stations is a very rough method, and is only an indicator of population exposure. On the other hand, to measure personal exposure which gives more detailed measurements and results are very costly. To solve the problem described, a combination of the two methods can be used, where individual time-activity patterns (time spent at different locations) are combined with microenvironment (e.g. residences, working places, and streets) measurements, which are then extrapolated and thereby gives a pattern of population exposure distribution (Sexton and Ryan, 1988; Anu et al., 2002). As Anu et al. (2002) also mentions, a number of different models have been developed throughout the years for modeling human exposure to air pollutions, but some of them have not used GIS to make deeper analyzes (e.g. Dimitroulopoulou et al., 2001: Johansson et al., 1999) while others have (Bohler and Riise, 1997; Clench-Aas et al., 1999).
Emissions from traffic and the burning of fossil fuels while transporting humans and goods have also an impact on the climate change (Borken-Kleefeld et al., 2010). The usage of fossil fuels creates small particles in the air, aerosols, which affects the precipitation and temperature; water molecules needs a surface to attach to and condensate upon (so called condensation nuclei) be able to create raindrops and hence clouds (Ahrens, 2009). Clouds affect the planetary albedo in both heating and cooling the Earth; short-wave radiation from the sun is reflected by the clouds back into space, and is thereby cooling the atmosphere. On the other hand, long-wave radiation from the Earths’ surface is reradiated back down-wards, towards the Earths’ surface, and hence enhancing the greenhouse effect.
NO2 is one of the major contributors of aerosols in urban areas and there is a correlation between increased NO2 emission and increased aerosols in the urban air (Lin et al., 2011). There is also a correlation between the frequency of rainfall, rather than precipitation amount, the study from East Asia shows.
4.4. Using GIS to Map Air Pollution in Urban Areas
GIS is an excellent tool to map human exposure to emissions and RS can be used to map rainfall (Anu et al., 2002; Lin et al., 2011). By combining ground level measurements, individual travel patterns, RS and satellite data for rainfall, this can be used to make analyses on the human exposure and environmental impacts of particular matters in the atmosphere. In figure 1, particle concentration distribution in a small Swedish city is shown in the background in a red scale, while the red and green dots shows location of work and home respectively (Larsson et al., 2005). The picture makes it clear that a person spend his or hers day in various air quality, and this makes the analysis more complex, and the data the analysis is based on needs to be extensive.
Figure 1: Example of how GIS can be used to map daily variation in particular matter at surface level. Example from a small city in southern Sweden. The two maps on the top shows the air pollution distribution between two days, where the two on top is during day one, and the maps below are for day two. The green dots represents where the test persons are located during working hours and the red dots are when they are at home. Maps from Larsson et al., 2005.
Particle concentration
High
Aerosols and their impact on atmospheric conditions and radiative forcing can be better understood by using Remote Sensing (Houghton, 2009). Depending on which molecules the air pollution and aerosols consist of they can be detected by different wavelength in an aerial photo, since they absorb and reflects different wavelengths. In this way, different kinds of air pollutions can be detected, as well as the concentration of those.
GIS and RS can be used to calculate variations in aerosol concentration in a vertical direction A study conducted in Hong Kong used satellite images from NASA to make a 3D model in a GIS and analyze building and urban landscape impact on air pollution and aerosols (Man Sing et al., 2009). The model can be used to model near-time concentrations, and can hence be connected to a warning system to alarm when hazardous concentration levels are reached.
4.5. Abstract- Water, Air, Climate Change and Population Growth – Problematic in Urban Areas and how GIS can help
Both water and air issues are common in urban environments, where a dense population puts high pressure on natural resources. These problems can be overviewed and planned for through GIS, especially when increased population and a changed climate are making the issues more complex. Methods for this are e.g. water resource planning and restoration of wetlands, air pollution exposure for humans, climate modeling and population distribution.
5. Criticism of Geographical Information Systems
Geographical Information Systems are a useful tool in many aspects, but there is a also flaws, and it is very important that the user of a GIS is aware and understand these flaws, and understand how it may affect the final result.
During the 1990’s a large debate regarding the critiques towards GIS emerged, from the positivists of the 1980’s (Schuurman, 2000). The critique was mainly regarding the limitations and dangers of GIS. A number of problematic areas were identified; firstly, the limitations of databases which pushes complex social phenomena’s into homogenized frames; secondly, the collection of private information from peoples personal life which has been made possible by technical applications; thirdly, the development of GIS was not driven by societal needs, rather the forces wanting to control and top-down ruling; lastly, GIS is a positivistic tool creating a normalization in the society.
Schuurman (2000) distinguishes three waves of the critique during this time period, where each time period is characterized by distinct arguments. The first wave, including the years between 1990 and 1994, was characterized by the intensity of the debate, as well as positivism. By 1995 and the second wave, the number of critics grew, whilst the GIS experts stopped comment on the critic. However, the second wave initiated a greater co-operation between GIS users and their critics. The third wave was characterized by the beginning of critics starting to work closely with the GIS experts, and a greater commitment to the technology. To further increase the understanding between the critics and the GIS-users, Schuurman suggest an increased communication between the two camps, and the creation of a common vocabulary. Schuurman also claim “if critiques of GIS are to be effective, they must find a way to address GIS researchers, using the language and conceptual framework of the discipline” (p. 569).
Sandvik (2010a, 2010b, 2010c) also discusses the critics and criticism towards GIS in the 1990’s; the author identifies the relationship between GIS and its user as a love/hate relationship, where the possibilities of GIS is both good and bad. The main development of GIS has not been within the academics, but by stakeholders within the society, and for useful applications such as Google Earth, navigations systems etc. and by these means, geographical information system reaches the broad mass (Sandvik, 2010a). In the beginning of the 1990’s a growing criticism rose towards the quantitative usage of GIS that had been focus of the subject during the 60’s and the 70’s. Critics claimed that the positivistic methods used in the quantifying GIS gave a false objectivity and that social GIS research didn´t take the values that makes people to humans into account when making quantifying research. One main argument was that quantitative methods only took the present state into consideration, and not the human capacity to change the configuration of society. Due to this, the quantitative research diminished in popularity during the 1980’s. In the 1990’s the real debate started, in the after-waves of the quantitative research method discussion, and the academic spokesmen for the potential of GIS didn’t make the debate less intense. The arguments in the debate from the different sides are collected in the book Ground Truth; The Social Implications Of
Geographic Information Systems (edited by Pickles, 1995). The book challenges geographers
to examine the procedure of power relations and political methods, where GIS were criticized to privilege persons in power who had access to the GIS technique, while marginalizing others. During this period, GIS gained more acknowledgment within the academic field of geography, and research funds were mainly granted to projects involving GIS and students with no knowledge of GIS had troubles finding PhD positions. The new technologies were seen as a threat towards professional cartographers.
The war against Iraq 1990-1991 was the first GIS war, and has continued to develop in modern time (Sandvik, 2010b). The surveillance community that we live in today is also an result of GIS applications, and is also of the main criticism towards geographical information systems, and its potential to be used for electronic surveillance on individual level.
There are also technical aspects of geographical information systems that needs to be discussed as complications in the usage of GIS, and flaws that the user and viewer of the result needs to be aware of.
First of all, information regarding the quality of the input data that the map or spatial analysis are based on are important to understand the quality of the result (Wasström et al., 2008). If the input data is inadequate, so will the final result. To improve the understanding of the quality, this has been standardized according to ISO-standard. The standardization is divided into quality parameters, which is used to describe the internal quality of geographical data. The ISO standards for geographical data quality can be found in the ISO 9000 series, where the more technical aspects are standardized in the ISO 19100 series. Errors in the data can emerge at any stage from the collection to delivery, and every small step in the chain can cause errors that propagates later on, and that may in the end have caused major errors. Errors may be caused by errors in the instruments used during the collection of data, or lack of information in the instruction for collection. The ISO 19100 series includes methods for quality evaluation procedures, instructions on how metadata are to be presented, accessed etc. To every dataset there are some metadata that needs to be stated; completeness, logic consistency, location awareness, temporal accurateness, thematically accurateness and actuality. Completeness are if any of the attributes, objects or relations between objects are lacking or to many of within the dataset. The logic consistency are standardized rules for e.g. that every property must have at least one owner, roads have a standardized name etc. The
location awareness are the location of an object in relation to the geodetically reference
system as well an in relation between objects. The temporal accurateness is to make sure that the events of time are set in the right order e.g. the data of building permit are not after the day that the building are constructed, and 30th of February is not a valid date. Thematically
accurateness is if the classification is correct (forest are forest and not field) and values are
accurate. Actuality is when the object and dataset are last controlled to be correct, e.g. if a building is demolished and replaced by a park, this need to be controlled to be correctly classified in the dataset. To control the quality, a number of procedures can be conducted e.g. collecting reference data and ground truth points to compare the end result with, and hence gain knowledge of the accuracy of the map and analysis.
It is also important to remember that GIS and the analyses conducted are only models of the reality, and are hence not exact, and it is difficult to map the complexity of the real world. All models include some kind of simplified picture of reality, and to better understand the flaws it is vital to understand the model, and to critically analyze the result.
5.1. Abstract- Critics of Geographical Information Systems
During the 1990s’ a wave of criticism rose toward GIS and the usage of GIS; how it homogenized individuals into groups, and the limits of the data used in GIS analyses. The GIS users responded to the criticism in the beginning, and the critics started to cooperate with the GIS-experts. There are also technical limitations to GIS that the user of the results needs to be aware of. Examples of this is the quality of the input data, the methods for collecting the data, and the fact that the analyses made are always models of the reality, and are hence there are always flaws in how the result visualizes the reality.
6. Geographical Information Systems and Decision Support Systems
Decision Support Systems (DSS) are “a specific class of computerized information system that supports business and organizational decision-making activities. A properly-designed DSS is an interactive software-based system intended to help decision makers compile useful information from raw data, documents, personal knowledge, and/or business models to identify and solve problems and make decisions” (University of Redland and Spatial Decision Support Consortium, 2012). Within GIS, DSS is used in many spatial issues, where there are complex problems with no obvious solution (Wenkel et al., 2013). For more spatial problem solving DSS, the abundant number of definitions has the following traits in common;
“they are designed to solve ill-structured problems, they have user interfaces, they combine models and data and contain tools allowing users to explore and evaluate candidate solutions. They are supposed to provide an iterative problem-solving environment. Spatial decision-making processes are usually based on a “what-if” analysis: the decision-maker defines the problem, collects and analyses data and evaluates the consequences of several alternatives (scenarios) in order to select the best one” (Wenkel et al., 2013, p. 2).
DSS are ought to be flexible and easy to adapt to various problems and new data, and are developed “especially to support the recognition and solution of a complex, poorly structured strategic management problem to improve decision-making” (Wenkel et al., 2013, p. 2). DSS is often combined with a GIS; it is a good and effective way to visualize spatial statistics.
6.1. Water
Zhang et al. (2010) have developed a DSS for water trade systems along rivers and between cities when cites have shortage or surplus of water, in order to investigate water trade mechanisms. In the DSS, sub-systems are developed to investigate water quantity and quality, basin information, trading, environmental management, laws, regulations etc., all contributing to a sustainable management of water for urban areas. The DSS combines the river basin trade market with water trading market and emission trade market, which will optimize the distribution of water resources in a sustainable way. To be able to analyze the carrying capacity off the water basin, the DSS was connected to a model within a GIS featuring water environment related data. The system will also monitor real time information regarding pollution location, concentration and speed of diffusion, and hence measure and control the spread of pollution within the basin water system to reduce the impact on watersheds, and hence water quality. Once the DSS is established, it will make date of the changes in the basin cities water resources, water usage, sewage situation, and establish a database platform with water trade and sewage usage. This will enable the river basin cities to make the water usage rational based on the current water state and efficient control of the pollutants in the water, and hence achieve a coordinated development of economy and environmental protection.
The DSS can be adapted to the requirements for each river basin city system (Zhang et al., 2010), but always include the following features;
- basic information regarding river basin cities and water resources e.g. river basin monitoring stations, main river data, major water users, geographic information regarding sewage units, etc.
- studies of various subjects regarding the monitoring of river basin cities e.g. rainfall, run off, water quality, etc.. This will also provide information regarding the spatial connections between indicators.
- River basin water resources assessment information demands i.e. making analyses on long-term data collections regarding e.g. runoff, sewage volume etc. to understand averages and get conclusions based on these.
- River basin water resources management that includes an integrated management regarding the water and groundwater resources of the basin cities and rural areas, basin and rural flood control, water storage, water supply etc.
- River basin management of the initial water right division including the cities right agricultural water basin, industrial water, environmental water allocation of water rights etc., which makes the foundation of the trade of water rights.
- Registration of water rights, property protection, and public announcement system management to enable the surveillance of the trading follows laws and regulations regarding ownership and protection.
- River basin water trading platform where all trades of water and emission rights are realized, and where the prize are regulated. The interested buyer can locate and contact other users with a surplus of rights, and agrees on a trade.
- Transaction information including total water accessible, the user water distribution, total available volume of sewage, discharge of all users assigned amount, the price of water and sewage of the user and the industry unit, tradable regional scope, tradable water and sewage volume etc.
- River basin water trading management system of laws and regulations ensuring the upstanding of rules and smoothing the processes of trading and provides legal protection for the different parties.
The database is a vital component of a GIS, and the effectiveness of the database is an important part of the water trading DSS (Zhang et al., 2010). The GIS in this case will be used to realize the management of graphics data e.g. attribute data, water type, water quality, quality monitoring stations, sewage unit distribution, etc. in the DSS, and enable a database with several sub-systems featuring the subjects previously mentioned, with the goal to enable an effective DSS. The implementation and development of the DSS will help achieve the goals of management of the river basin water resources and trading development, as well as real time monitoring and forecasting of water resources.
6.2. Air
In environmental planning and management process, DSS helps decision makers to convey and implement realistic and successful strategies and action plans to improve air quality (Elbir et al., 2010). To be able to achieve a sustainable urban growth, the plans need to be both short-term and long-term. There are many DSS applied for major cities world wide, and is an opportunity to improve air quality in many cities. Data usually included in DSS are emission inventories, air quality monitoring, mapping and air quality impact assessment of various control strategies. DSS supports the evaluation of action plans by using information available to the public about the past and present air quality. Examples of cities using DSS in Europe are Stockholm, Lisbon, Milano, Berlin, Geneva, Vienna, Paris, Oslo and Athens. There are a number of different DSS applied in the cities, e.g. the Swedish systems AirViro and EnviMan, among others. The DSS’s usually applies simple air quality dispersion models, which have low spatial resolution that is not adapted to the high spatial variability within urban areas, and does only consider simple exposure assessment if any. Furthermore, many of the commercial systems do not take local conditions into consideration e.g. vehicle types, fuel type, industrial activities etc.
The study from Elbir et al. (2010), tells about the development of a DSS in Istanbul, Turkey. The city, one of the worlds largest with a population of 12 million (when the study were conducted), have major problems with the air quality due to rapid population growth, dense immigration, unsuitable location of industries, lack of fuels, usage of old combustion technologies in the industries, traffic emissions etc. To handle and to improve the air quality in the city, a GIS based DSS were developed. Emission inventories, air quality modeling, air quality mapping by GIS and scenario analysis for air pollution reduction were carried out as preparation for the DSS. The DSS model developed for Istanbul have taken into consideration the metrological conditions, with its location at the Black sea in the north and the Marmara Sea in the south, producing surface temperature differences between the different surfaces, and hence different meteorological conditions that may play a role in the transportation of pollutants in the air. The complex terrain of the area, with altitude differences between 50 and 945 meter, also influences the circulation system. Istanbul is the largest industrial center of Turkey, with industries in food processing, textile production, oil products, rubber etc., as well as a public power and cogeneration plant, a large cement factory and several sand and gravel processing plant, all contributing to air pollutants as the major sources to pollutants in the city. Hourly measurements of air quality are reported from ten stations at various locations within the city, and have been done so since 1998. Substances
measured are CO, NOx, SO2, PM10 and O3. The air pollutants reached a significant level
during the 1980’s.
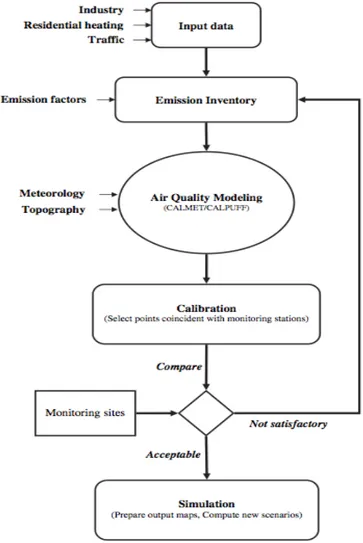
The DSS for Istanbul were designed according to figure 2 (Elbir et al., 2010). This is the principal components and steps of the DSS. The first step in to collect necessary data; industrial data on production capacity, raw materials used, manufacturing processes, fuel consumption, stack characteristics (height, diameter, fuel gas temperature and exit velocity), heating source information (number of inhabitants, types of fuel used and consumed, population densities), vehicle information (number of cars and other transportation means, types, ages, fuels used). Next, this data is used to prepare emission inventories, which are computed and stored in GIS databases. All coordinates of emission sources are located and noted in spreadsheets, where proper calculations are made to decide on emission factors. In the next step, the chosen model, in the Istanbul case, the CALMET/CALPUFF model is used to predict urban air quality levels. The author claims that implementing air quality models in a GIS environment is one of the strong features in DSS, and with GIS, geospatial air quality models that can provide results at any time, any location and by anyone (if made accessible to public use). When the models are calibrated, the different scenarios can be simulated in the DSS. If the results obtained are not accurate enough compared to the measurements, it is necessary to go back to the first step, and check for errors.
Figure 2: Schematic overview for Decision Support System development for air quality assessment. From Elbir et al. 2010.
Based on the results from the DSS used in Istanbul, the author claims it can be used to assess the impacts of different air quality management policies (Elbir et al, 2010). For example, lignite is mainly used during winter to heat residential, instead of natural gas as during rest of the year. This causes an increase in air pollution concentration during winter, and hence a decrease of air quality. By using the DSS it has also become clear that the main source of SO2
is one single heat plant alone during wintertime using lignite, and based on this knowledge, new and more environmental friendly technologies can be implemented in this plant, and decrease the air pollution.
6.3. Climate Change
To better plan for a changed climate with changed precipitation patterns and temperatures, DSS can help farmers to mitigate and adapt to these changes in a social, economical and environmental sustainable matter (Wenkel et al., 2013). DSS can help to develop viable climate change adaption strategies for agriculture and regional land management, which encompasses several alternatives and issues that needs to be taken into consideration. Wenkel et al. (2013) have started to develop a DSS to achieve this, and together with multiple stakeholders decided on vital factors to include in the DSS. There are a noticeable demand for increased information regarding climate change and its impact among stakeholders, in the light of agriculture and where the uncertainties of climate projections and impacts models are discussed.
Together with recent achievements in the development of GIS and climate impact modeling, interactive spatial simulations can now be achieved, containing the spatial information required by the stakeholders, and hence achieve a DSS helping the decision makers and farmers in the planning of growing seasons and harvesting, sewing, water accessibility etc. (Wenkel et al., 2013). The developers of the DSS arranged workshops together with stakeholders (including advisors, consultants, administrative bodies and farmers) to develop this DSS as a supporting the decision-making process regarding climate change impacts. The fundamentals in the DSS asked for featured (cited from Wenkel et al., 2013, p. 3);
- Provision of the latest knowledge on climate change and potential adaptation strategies/options for agriculture
- Provision of easy-to-use regionalised climate data (past data and predictions for the future) and easy-to-use methods and approaches for climate analysis and visualisation - Support of multi-scenario and multi-model ensemble simulations for uncertainty
analysis
- Possibility of interactive scenario simulations (“what-if”) and integrated impact assessment at different spatial scales
- Supply of background information on the simulation models and the data analysis tools used
- Supply of appropriate spatial (geographical) data, as well as input data and parameters for simulation models for integrated scenario simulations and impact assessment. The DSS is still on a prototype level, but have the goal to be freely accessible for everyone interested, and GIS is not always needed to use the DSS; however, the power of an image is emphasized by the author as something that can make strong impression among the users and the decision makers (Wenkel et al., 2013). The author also emphasizes the importance of adaption on the regional scale, since water and temperature changes affects larger scale than
just the local and farm scale, even though these scales also needs to be taken into consideration.
6.4. Sustainable Development
Graymore et al. (2009) have developed an index for regional sustainability, where a GIS-based multi criteria DSS combines the three pillars of sustainability to be able to prioritize areas in need of help to achieve sustainable development. The area of focus is the Glenelg Hopkins Catchment Management Authority region of Victoria, Australia. The regional scale combines the top-down national policy and the local bottom-up local policies, and “links multiple spatial and temporal scales of biodiversity with human uses and socioeconomic imperatives” (Graymore et al., 2009; Brunckhorst, 2005, p. 6). This makes the regional scale to an appropriate scale for sustainability studies (Graymore et al., 2009) as well as for natural resource management, since this is the scale where ecological functions can merge with social institutions and hence re-develop institutional systems for resource governance. Hence, management in the regional scale will result in the integration of the flows and functions of ecological systems to ensure these ecological systems and their biodiversity is sustained. But to achieve a sustainable development on a regional scale, indicators are needed, but there is still no such thing to enable well-informed and comparable planning and decision-making in Australia. To be an effective framework to achieve sustainable development, the developed framework needs to be able to provide up-to-date information regarding sustainability at regional and finer scales, since large differences in sustainability may emerge at the different scales. This needs to be based on local definitions of sustainability, according to Graymore et al. (2009) to ensure it is measuring on factors important for the sustainability of the region, as well as information regarding the systems viability and performance. A sustainability assessment tool like this would enable guidance to which areas that needs sustainability initiatives the most. A system that can do this needs to be objective and to fully integrate the indicators; one system suitable for this is the multi criteria analysis (MCA), with capability to consider many criteria’s at once, and combining qualitative and quantitative criteria’s at the same time. MCA have previously been used to find suitable locations for e.g. new buildings, route for a new highway and land suitability for new developments. The difficulty with MCA is that it is hard to decide on the weights without value judgments, hence the stakeholder or decision maker to subjectively place the value of each criterion. It is hence important to develop an accurate, objective method for weight of criterions, based on the current understanding of sustainability. This could be done by “investigating and quantifying the interactions between indicators and the impact they have on sustainability using correlations and pairwise comparisons to help produce an integrated sustainability assessment” (Graymore et al., 2009, p. 455). To improve the capability of MCA as a decision support tool, it can be integrated with GIS to combine geographical data with MCA models to produce maps that show the ranking options. This makes the decision making more transparent, and “produces maps showing where the decision options are located, the differences in the levels of the criteria for each option and the ranking of options” (Graymore et al., 2009, p. 455). This method have been used in areas such as natural resource management, lake regulation, water resource management, regional and urban planning, land use suitability and natural hazard management. The tools decrease the time to make decisions and enables decision makers to see possible implications of the different alternatives by producing different maps. The implementation of DSS in GIS would decrease the possible errors and loss of information experienced earlier, when calculations were conducted in spreadsheets and then transferred into a GIS for visualization compared to todays calculations conducted within the GIS.
The project started in Australia, called Catchment to Regional Scale Indicators of
Sustainability, identifies indicators based on the three pillars of sustainability (environmental,
social and economical) as well as institutional sustainability (monitoring and evaluating), and develops a framework based on this (Graymore et al., 2009). In the framework, 44 indicators relevant for the region and that could be followed during time (not just snapshots) and where the relationship between the indicators was considered, were identified, but only 13 were used due to lack in data consistency and quality, and relevancy in the sustainability assessment (Table 1). These 13 indicators forms An Index of Regional Sustainability (AIRS), and do not only indicate the sustainability individually, but also the sustainability of the indicators that they are linked to and thus, the systems sustainability. For example, the erosion indicator also indicates the sustainability of land use practices, vegetation cover, the impacts of loss of viable land through erosion, soil condition, etc. However, the AIRS needs further development to enable it to produce visual images over the region and to be able to show which areas who are in greater need of efforts to make it more sustainable.
Table 1: Indicators of sustainability for South West Victoria Region, Australia. Based on Graymore et al. (2010).
Environmental Land use (dry land pasture, pine plantations) Remnant vegetation
Dry land salinity Wind erosion Water erosion
Soil structure decline
Social Age structure
Population growth rate People completed year 12
Economic Household income
Employment diversity Unemployment rate
The evaluation of the AIRS shows that the framework is robust and sensitive for variations in sustainability (Graymore et al., 2009). Also, if an area is good in e.g. environmental sustainability, but less good in e.g. social sustainability, this area is still identified as an area where initiatives for sustainability should be implemented.
6.5. Abstract Geographical Information Systems and Decision Support Systems
DSS in combination with GIS are good tools for relieving decision making, both in planning and management. There are a innumerous number of studies within the subject DSS development, and the tool can be used within all subject, not only environmental planning. In this section, the usage of DSS within water, air pollution, climate change adaption and mitigation, and sustainable development are presented, which indicates the large variation of problematic where DSS can help as a tool towards sustainability.
7. Discussion
By implementing Geographical Information Systems and Remote Sensing in sustainable urban management, decisions in planning can be well based on actual facts and well investigated alternatives. GIS is economically effective in investigating different approaches and solutions of geographical based problems, and decision makers can easily understand different alternatives. One of the main issues with GIS is the massive amount of data needed to do accurate analyses; some data can easily be accessed by using satellite images and evaluate e.g. land use changes, urban expansions, flooding events etc., but there are always a need to make field surveys to decide the correctness of analyses made by RS. But by doing field surveys in a small area, the ground truth can be used to evaluate analyses made on larger areas, as long as the field survey are covers all categories of the analysis. Other issues with GIS and its quality aspects are the information regarding data collection and methods used for analyzing the data that always needs to be informed about and easily understood and imitated if needed. It is also important to remember that the analyses made in GIS are only models of the reality, and hence not always a correct reflection of the real world.
Decision Support Systems can many times help decisions makers to evaluate different options for solutions or alternatives for planning. As discussed in section 6, DSS in combination with GIS have many possibilities in helping in spatial problem solving, and in many various areas, from trading issues to climate change adaption and defining emission sources contribution to air pollution. DSS can also help in the regional sustainability work, combing the three pillars of sustainability, even though the system and framework for doing this is still a prototype, but there are potential of the Graymore et al (2009) DSS framework. The wide variety of how DSS can be applied for sustainable development also complicates the methods and terms of the usage and development of DSS (Wenkel et al., 2013). Even though there have been many studies and prototypes of different DSS’s, many frameworks are not developed further and stays unutilized. The reasons for this are many, e.g. the DSS is not adapted to the users’ needs, insufficiently related to the specific problem, complicated to use, lack of data etc. To solve some of these problems, a European standard have now been developed by the European Union for DSS development within climate adaption called CIRCLE (Climate Impact Research Coordinated for a Larger Europe).
Cities globally have action plans for achieving a sustainable urban development. One of those cities is Bogotá in Colombia. The city is expected to rapidly increase in population, and doubling its population from todays 7 million (Facil, 2008). This rapid increase is mainly due to rural population immigrating to the capital region looking for employment and a better way of life; many move into the urban areas to escape from conflicts and violence in the rural regions (Acosta, 2010). Another major reason for immigration to the highland city of Bogotá is the predicted sea level rise at the coastal areas of Colombia (IPCC, 2007b). This rapid population growth will put high pressure on the water resources and air quality in the area, at the same as climate change with increased temperature and changed precipitation regimes are predicted to affect the area even further (Bogotá Humana, 2012).
The water issue, emphasized by both Plan Regional Integral de Cambio (PRICC, 2012) and by Facil (2008) is the water consumption; today, 70 percent of the water used in Bogotá comes wetlands located in nearby national parks, but these water resources have been reduced significantly during recent decades, as well as the water resources within the city (PRICC, 2012). The increased population, as well as increased industrialization in the region