Västerås, Sweden
Thesis for the Degree of Bachelor of Science in Computer Science
USING AUGMENTED REALITY TO
INCREASE A HEAVY VEHICLE
OPERATOR’S SIUATIONAL
AWARENESS
Kim Päivärinne
kpe14001@student.mdh.se
Examinator: Marjan Sirjani
Supervisor: Rikard Lindell
Company Supervisor: Markus Wallmyr
Abstract
While operating a vehicle it is important to pay close attention to things such as driving environment, other vehicles and your own vehicle. Developing a high level of situational awareness can be very beneficial for driving safety as it helps with making decisions.
The purpose of this thesis is to investigate and explore how we can use augmented reality to increase the situational awareness of a heavy vehicle operator. Our approach to solving this problem is to use the double diamond design method along with a literary investigation in order to solve the correct problem, in the best way possible. For evaluation we did user testing and questionnaires to measure mental workload and situational awareness. In this work we produced a prototype augmented reality application which we used in our tests. User feedback were almost entirely positive.
Contents
List of Figures 4 List of Tables 4 1 Introduction 5 2 Background 5 2.1 Situational Awareness . . . 52.2 Situational Awareness and Performance . . . 6
2.3 Mental Workload . . . 6
2.4 Measuring Constructs . . . 6
2.5 Augmented Reality . . . 7
2.6 Computer Vision . . . 8
3 Related Work 8 3.1 Augmented Reality for Situation Awareness in the Security domain . . . 8
3.2 Augmented Reality for supporting collaboration in rescue services . . . 8
3.3 Augmented Reality and Education . . . 8
4 Problem formulation 9 4.1 Limitations . . . 9 5 Method 9 6 Ethical Considerations 10 7 Implementation 11 7.1 System architecture . . . 11 7.2 Marker Detection . . . 11 7.3 Rendering . . . 12 7.4 Application features . . . 12 8 Results 12 8.1 Questionnaire . . . 12 8.2 SART . . . 15 8.3 Nasa-TLX . . . 16 9 Discussion 17 9.1 Questionnaire . . . 17 9.2 SART . . . 17 9.3 Nasa-TLX . . . 17 9.4 Test Case . . . 17 10 Conclusions 17 11 Future Work 18 12 References 19 13 Appendices 21 A SART 21
B Nasa-TLX 23
C Questionnaire 23
D Sketches 24
List of Figures
1 How the application displays a drop-off location. . . 11
2 How the application displays boxes. . . 11
3 The wagon used in the test. . . 18
4 The boxes and markers used. . . 18
5 SART questionnaire (Note, one question is missing). . . 22
6 Nasa-TLX questionnaire. . . 23 7 Early sketch 1. . . 24 8 Early sketch 2. . . 24 9 Early sketch 3. . . 25 10 Early sketch 4. . . 25 11 Early sketch 5. . . 25 12 Early sketch 6. . . 26 13 Early sketch 7. . . 26 14 Early sketch 8. . . 26 15 Early sketch 9. . . 27
List of Tables
1 Questionnaire results . . . 13 2 Questionnaire results . . . 13 3 Questionnaire results . . . 13 4 Questionnaire results . . . 14 5 SART results . . . 15 6 SART stats . . . 15 7 Nasa-TLX results . . . 16 8 Nasa-TLX stats . . . 161
Introduction
In order to safely operate a heavy vehicle, developing situational awareness (SA) is bene-ficial. SA helps with making decisions both in the present and future. A key part of SA is perception [1]. Augmented reality (AR) has the potential to increase visual perception for the operator and thus also potentially increase SA as well. A higher level of SA can also lead to better performance in certain tasks. This thesis follows the double diamond design process [2] as well as a literary investigation. We produced a AR prototype appli-cation which were used in user testing. In the tests users were asked to identify boxes and their drop off locations using our AR application and then deliver the correct box to the correct location. The testers were then asked to answer three questionnaires. SART for SA [3], Nasa-TLX for mental workload [4] and a general one of our own making about the application.
Section 2 describes the background to relevant areas for this work such as situational aware-ness, mental workload, perception, goals, augmented reality and computer vision. Section 3 describes related work in augmented reality. Section 4 describes our problem definition and limitations. Section 5 is the scientific and practical method used in this thesis. Section 6 describes the ethical considerations. Section 7 deals with practical implementations and system architecture of the application produced in this thesis. Section 8 describes our re-sults and section 9 discusses them. Conclusions are provided in section 10 and suggestions for future work are provided in section 11. Some basic understanding of linear algebra and 3D rendering is helpful while reading this thesis, although it is not required.
2
Background
2.1 Situational Awareness
Situational awareness (or situation awareness) (SA) is a psychological construct which encompasses the ability to perceive and comprehend what is going on around the person[1]. SA construct can be used in many different situations and systems such as driving, search and rescue, law enforcement and cyber security. There is a three stage model for SA[1]. The model consists of
1. Level 1 SA - Perception 2. Level 2 SA - Comprehension 3. Level 3 SA - Projection Level 1 SA: Perception
The first step in achieving SA is to perceive the relevant elements and their status in the environment. For example perception can be, but not limited to seeing an object with your eyes, on a radar, on a camera, getting an alert. Elements can be things such as objects but also the location and altitude of an aircraft such as your own or others.
Level 2 SA: Comprehension
The comprehension stage involves the operator understanding the significance of the ele-ments perceived from level 1. It’s not enough to simply see the objects. For example a driver must perceive and understand the different objects around her. In order to be as safe as possible she would need to see the stop sign as well as comprehending its meaning or understanding what a certain alarm might mean.
Level 3 SA: Projection
The final stage is to project the elements and their meaning into the future. For exam-ple seeing a small child running towards a busy street and knowing that you should stop
your vehicle. SA is closely linked both to human performance and decision making [1]. A critical factor in making adequate decisions in critical situations is both generating and maintaining SA. By generating and maintaining SA a operator can project likely events in the near future [5]. SA is not always linked to performance however, because an operator might lack the required skill in order to capitalize on an increase in SA.
In order to generate SA an operator first have to perceive what is going on around them. Depending on the situation, perception can come in different formats such as visuals, tac-tile and auditory inputs. When it comes to visual perception humans can be surprisingly unaware of details and changes to the environment [6].
Visual Perception and Comprehension
Perception is not a simple matter. We live in a very complex world where every “object” can be classified or perceived in an infinite number of ways [7]. Even a object can be infinitely complex and we have to simplify the world through our perceptions. We perceive meaningful phenomena, not the objective world [8] and when we see, we do not see much of what is there [9]. In order to manage the complexity of the world the perceiver learns what resolution level is relevant to a given operation. Goals take part in controlling our perceptions [8] and also our comprehension [10]. We tend to see objects, tools and events that will help our goals or stand in the way. If it is not relevant to our goal it might pass by our perception even if we are looking directly at it [11]. In most cases we can only handle about seven plus minus two objects or events [12] so if something behaves predictably, it may be eliminated from attentive awareness [13]. For example, the color of the wall might not be relevant to any of our goals so we might not pay any attention to it, even if it changes color.
2.2 Situational Awareness and Performance
While doing an activity such as driving, SA has relevance for doing it safely [14]. SA helps with comprehension and decision-making [3]. In order to drive safely a driver combines long-term goals with short term goals as they are driving [15]. The relationship between SA and performance is not always direct. In certain situations an increase in SA only increases performance if the user has technical and operational capabilities to take advantage of the increase in SA [1]. The same study also found that if the subject realized that they had low SA they could take actions to increase their SA and performance. A study of aircraft accidents revealed that when human factors were the cause (not including mechanical errors) errors in SA (among the aircrew or controllers) were the leading cause [16]. In the SA-related accidents 72% involved level 1 errors (Failure to correctly perceive the situation), 22% involved level 2 errors (failure to correctly comprehend the situation) and only 6% involved level 3 errors (failure to project situation into the future).
2.3 Mental Workload
Mental workload (MWL) is a psychological construct which encompasses the perceived demand or effort on a person doing a certain task [17][4]. MWL is affected by the task at hand which in turn is affected by its objective, duration, information, equipment and personal resources. Each of these variables may contribute directly or indirectly to MWL and to performance.
2.4 Measuring Constructs
There are different techniques for measuring SA. Some techniques are physiological tech-niques, performance measures, global measures, external task measures, imbedded task measures, self-rating, observer-rating and questionnaires [3].
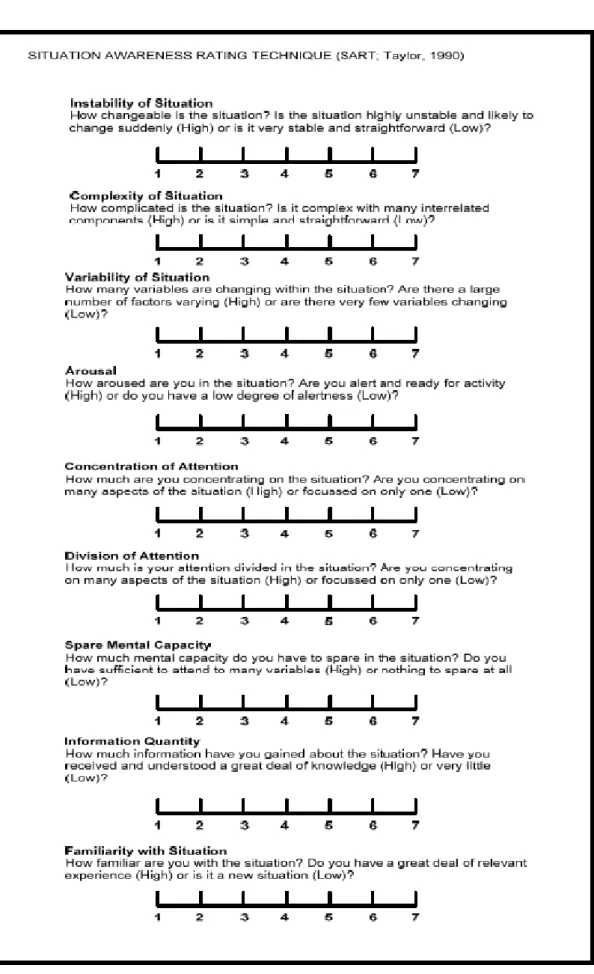
Situation awareness rating technique (SART) is a post-trial subjective rating technique [18]. A questionnaire is administered post trial which measures the subjects own rating of instability of situation, complexity of situation, variability of situation, arousal, concen-tration, division of attention, spare mental capacity, information quantity and familiarity with situation. All questions are on a seven scale rating. The ratings are later combined and calculated to a measure of SA. SART is a non-intrusive method and does not refer to a specific situation but rather on generic characteristics [3][18].
Situation awareness global assessment technique (SAGAT) is a method where you have run a simulation and at some random point you pause the simulation and blank out the system displays [19]. The pilot is then asked a series of questions in order to determine his knowledge of the situation at that moment in time. After the simulation is complete the answers are evaluated on the basis of what was actually happening in the simulation. You compare the pilots answers to the data collected from the situation. A composite SAGAT score is then determined for the system. This process is then repeated a number of times for each pilot operating the system. Performance measures can be used to infer SA [3]. They have the advantage that they are objective but performance is not always correlated to a higher level of SA.
In order to measure MWL a subjective questionnaire called Nasa-TLX is commonly used [4] [20]. The first part of Nasa-TLX measures subjective mental effort, physical demand, temporal demand, performance, effort and frustration. The second part allows the subject to compare each dimension to each other. This is done in order to place weights on each of the dimensions of the test. The second part can be skipped and the test is often then referred as raw-TLX [21]. The test can be administered by pen and paper or through soft-ware. You can also measure MWL by using performance-based and physiological measures [22].
2.5 Augmented Reality
Augmented Reality (AR) is a technique where you integrate 3D virtual objects with a real 3D environment [23]. A example could be a display with a camera feed where you draw 3D objects to give the illusion them really being there. Some movies makes use of AR. AR is related to Virtual Reality (VR). In common VR systems like HTC vive [24] you wear a head-mounted-display (HMD) with two small screens embedded, one for each eye or one bigger screen for both eyes. The HMD tracks your head movement and will display a virtual environment to the user. VR does not allow the user to see the world around them. This is suitable for video games and other simulations. AR allows you to introduce 3D-models or 2D-models on top of the real world. You can use this to augment certain things rather than to completely replace it. Although AR is commonly used as a visual augmentation tool, it is possible to use it for other senses as well[25]. There are many different ways of generating a AR system. You can think of it as two different systems. The real world system and the artificial world system. One of the challenges in AR is synchronizing these two worlds. One way is to wear a HMD which tracks the user’s position and rotation. You will then know which part of the artificial world you need to present. Another way is to have markers such as symbols and images which a camera can detect and through image processing you can map the marker to a position and an object and then display that on top of any camera feed.
The second part of AR systems is to present the artificial world. There are two common ways of doing this. The first one is to combine the camera feed and the augmented reality feed to a single stream and then present it on a screen. The second part is to present the augmented reality stream to a partly transparent screen commonly worn before the eyes. This way have the advantage that if the camera were to stop working, you can still see the world.
For this paper we will focus on AR systems which can do the following: 1. Combine real world and artificial world as one image
2. Is in real time
3. Can present objects in 3D space or 2D space 4. Can detect some type of marker in the real world
2.6 Computer Vision
A key element of AR is the ability to find out where you should render your models. A common way to solve this problem is to use Computer Vision (CV) techniques. Computer vision tasks include methods for acquiring, processing, analyzing and understanding digital images [26]. CV is commonly used to track objects, estimate 3D poses, motion estimation and more. 3D pose estimation is to determine the transformation (relative position and orientation) from a 2D image [27].
3
Related Work
3.1 Augmented Reality for Situation Awareness in the Security domain
There has been research for using AR to help increase SA and collaboration for operational units in the security domain [28]. They evaluated their results in two different rounds. In the first round, they evaluated their system together with experts from different operation units in the security domain. The second round focus on the effect of AR on collaboration and SA within the teams. The scenarios tested are done in pairs. For example: One police officer is at a scene with some tasks to be done such as investigate a “safe house” in which a witness needs to be safely accommodated. A remote police officer shares his field of view and can communicate through audio. The environment can be augmented by placing shapes such as text or arrows in 3D. Only the remote participant could manipulate the virtual content through a 2D interface. The results showed that the participants had lower levels of arousal while using the AR system as well as lower level of focus, attention and mental capacity compared to when they were not using it.
3.2 Augmented Reality for supporting collaboration in rescue services
AR systems has also been used to develop multi-user applications to help collaborate crisis rescue teams [29]. The AR application provided workers from different organizations with a personalized view in order to avoid cross-organizational mistakes. The rescue workers all saw the same map but the symbols used in the system were unique for each organization. This was done in order to avoid conflicts of symbol meanings. The AR application was able to support collaborative work between police, rescue services and military.
3.3 Augmented Reality and Education
In the past decade, an increasing number of research has been done on digital game-based learning [30]. Some of these has been done in the field of AR. Studies have shown that digital game-based learning can be a more effective tool for teaching students, in terms of motivating students compared to traditional methods [31]. Another study showed that using an AR system to teach children about bacteria kept the students more interested than traditional books [32].
4
Problem formulation
Since increasing the situational awareness of a heavy vehicle operator can be very beneficial in terms of safety and productivity we intend to investigate how we can use augmented reality to help solve these issues. Since vision are our most dominant sense we believe that we can best improve awareness through a visual medium [33]. Working with the other senses such as feeling or hearing can be impractical compared to vision since a heavy vehicle can be noisy and / or vibrate. Vision is the most readily available sense and its also plays foundational role in many SA situations. In order to verify our ideas we intend to construct a prototype with CrossControls display platform and use it for testing. In short, the goal of this thesis is to:
• Investigate how can augmented reality enhance a heavy vehicle operators’ situational awareness?
4.1 Limitations
Since situational awareness is a subjective psychological construct it will not be easy to get hard proof of any results. However we believe that by using multiple questionnaires for evaluation we can get better results. Inconsistent data would point towards a flaw in either the formulation of our tests, questionnaires or the application. Consistent data would indicate more reliable results.
5
Method
In order to solve our problem of increasing the situational awareness of a heavy vehicle operator we decided to use the double diamond method [2]. We started to sketch on as many prototypes as possible while in parallel we conducted a literary review on current and former research. We believed both were necessary in order to solve our problem. A literary review was necessary to understand situational awareness and to look at how others have solved similar problems. The sketching phase was to make sure we solved the correct problem, in a good way.
After the initial phase it became clear to us that we could use AR to increase SA by helping to identify elements. By rendering models we could help increase level 1 SA and potentially level 2 as well. We found no simple way to increase level 3 SA by using AR so we decided to only focus on level 1 and 2 for the moment. Our literary investigation also revealed that perception are linked to cognition [34] [35].
By helping the user to perceive we could also help cognition and possibly lower mental workload as well. By using 3D models to enhance perception we also had to keep in mind the fact that there can be cultural differences in symbols and their interpretation. We decided to keep our models as simple as possible to avoid any misunderstandings.
Once we had clearly defined our problem to solve we could move on to the development phase.
We began our development phase by analyzing our hardware limitations. We wanted the application to be able to run on Windows 7 and on 32-bit architecture. Our goal was to be able to run our application on CrossControls display platform XM. The display computer has a Intel Atom E3826 dual core 1.46 GHz, 2GB of ram and Intel HD Graphics Gen 7R
integrated GPU. Using a display platform rather than a HMD was the better choice since many modern heavy vehicles are outfitted with displays or it is easily added. It would make for a more portable solution than a HMD would. It also allows the user to choose when they want to use AR, since they can look at the screen or look through the window. WIth a HMD you would have to remove it. We continued our literary investigation of existing
related works, both in academic and non-academic fields. We started to look at different frameworks that could support AR and also frameworks for 3D and 2D rendering. We found the AR platform Vuforia which worked well together with Unity3D. Unfortunately Vuforia lacked publishing support for Windows. That meant if we wanted to use Vuforia and Unity3D together we had to run our application in Unity’s editor. We also investi-gated TensorFlow which support for recognizing objects but no image processing support. TensorFlow also lacked support for 32-bit architectures.
Finally we looked at openCV [36], Java and C#. Since we wanted to use Unity3D for rendering we looked at the C# wrapper Emgu. We managed to get it working together with Unity3D and running on our display platform. However since we were worried about the performance and there were more examples and documentation for C++ we decided to use the normal openCV C++ library. For rendering we used OpenGL and for window and event handling we used freeglut. Using OpenGL also allowed us more control of the rendering process, since we could write all the rendering code ourselves. We then started to develop our application using the libraries.
Our implementation was inspired on the method presented in the book “Mastering OpenCV” [37]. Once we had a working prototype we designed a test case for evaluation. We also looked at different methods of measuring SA and mental workload. We decided on using SART and NASA-tlx for evaluation of our prototype. We used questionnaires for evalua-tion since it was non-intrusive on our test. If was also very scalable and a common method for measuring constructs. In our test the subjects were asked to retrieve three packages among a selection of six. They had to identify the correct packages and also deliver them to the correct position. To help them they had a wagon with a computer and camera pointing forward. The computer ran our application which helped to identify the packages and the drop-off locations using AR. The drop-off points were rendered as colored squares with floating 3D text above them. The time and number of errors were noted in order to esti-mate performance. After the test, each subject were asked to fill in three questionnaires, SART, Nasa-TLX and one of our own making. Our own questionnaire asked some general questions about the system and how the users felt about the application. Questionnaires were used because of their non-intrusive nature and their ease of administration. Using a technique such as SAGAT was not very practical to administer in a test scenario such as ours. At this point I made an error. I downloaded a SART questionnaire that only had 9 questions. The original SART is supposed to have 10 questions.
By combining objective measures of number of errors along with subjective question-naires measuring SA and MWL we believed we could achieve a good picture of the system and its benefits and problems. We could then analyze the data and if the results were matching on all dimensions we could make the hypothesis that our system was beneficial. If the data was conflicting we knew something was wrong with our system or with our tests.
6
Ethical Considerations
The participants of our study were informed that participation is voluntary, anonymous and that they could withdraw at any point of our study. They were also informed of the purpose of the questionnaires. This was the case both during our test, during the questionnaires and during the interview. Age and gender where in the questionnaire but no other personal information were noted. With their consent we videotaped the test but we put a black box on top of their faces.
Figure 1: How the application displays a drop-off location.
Figure 2: How the application displays boxes.
7
Implementation
Since we wanted our solution to be able to run on as many platforms as possible we decided to write a 32-bit application. Our available operating systems were Windows 7 Embedded and Linux. We chose Windows 7. For computer vision we used OpenCV and for rendering we used OpenGL.
7.1 System architecture
The application was divided into three different modules. One module for rendering, one for detecting marker and one for controlling each sub-module. The rendering module uses OpenGL in order to render 3D and 2D objects. The marker detection module uses openCV for image processing. For easier window handling and openGL context creation freeGlut was also used. The application was written in C++.
7.2 Marker Detection
The algorithm for finding and estimating a marker’s position for each frame is 1. Convert image to grayscale
2. Perform Threshold 3. Find contours 4. Find markers
5. Estimate position 1. Convert to grayscale
Does a weighted normalization to convert a colored image to greyscale. 2. Perform Threshold
Does a binary threshold which will set each pixel to 1 if it is above a certain threshold and 0 if below.
3. Find Contours
Finds all the contours by following the edges of the image. 4. Find Markers
Takes all the contours which have four corners and does a perspective warp to get a flat undistorted image. I.E. transforms the image back to image space from world space. Each image is then split into a grid of 5x5. Each section is then matched towards a matrix that is associated with a marker.
5. Estimate Position
Once we have identified a marker its position and rotation relative to the camera is esti-mated and stored in a 4x4 matrix. This operator is done by using a 3D reconstruction algorithm which requires that you have calculated camera variables such as focal length and intrinsic camera parameters.
After each of these steps are completed the marker detection module returns a list with all the detected markers. The list is then passed to the render module where each marker has an associated model and shaders. The rendering module then renders each detected marker as a model with the estimated transformation. If any marker is lost it is still rendered at the last known position for an additional 0.10 seconds. We did this because sometimes the marker detection fails to recognize the marker even though it is visible. This trade-off made the rendering more stable.
7.3 Rendering
Once we know the estimated position of our marker it is time to render it. The rendering is done with OpenGL and works similarly to any standard rasterization-based 3D rendering system. The projection matrix is constructed once and the model matrix is supplied by the marker detection module. The model is then rendered with a vertex and fragment shader. The camera stream are rendered first with an orthographic projection and without writing to or testing the depth buffer. The models are rendered then with both writing to and testing the depth buffer.
7.4 Application features
The application is able to load in meshes (3D-objects) from a file. One or more meshes can be assigned to a marker, for example a letter and a square are assigned to drop-off locations. There are multiple shaders to choose from and they support texturing. The rendering system is capable of rendering both 3D objects and 2D objects and the same mesh can be used for multiple markers with different scale and / or shader. Shaders can be loaded from files or written directly into the code.
8
Results
8.1 Questionnaire
How did the application relate to the task at hand? Good
Good
Good, high precision Good
It clearly showed that it wanted to help It did it’s job
It did what it was supposed to do Clear and easy to understand
It helped me to easily find the correct spot for each box It made a simple task a bit more complex
Good, it helped me complete the task
Table 1: Questionnaire results
What was good with the application?
Showed clear information and was easy to use Easy to understand the task
Easy to use, little preparation needed
The visual colors, it drew your attention to what need to be done The receipt it gave that the correct box was at the correct location .
Identified the box so that I did not have to remember which box I carried With receiving a box, you can plan your route
Precise, clear colors together with text and frames made it easy It was clear which location belonged to which box thanks to the colors Responsive, adapted to the environment
Table 2: Questionnaire results
What was bad with the application? I don’t know
Nothing from my perspective
Sometimes hard to remember what letter you had picked up Nothing
Unnecessary to show the names of the boxes. It made me put energy into trying to remember which box I had .
I wanted feedback whether I had placed the correct box at the correct location If it was logistics, maybe you should have a map?
Markers disappeared when I came to close to the markers
You rely entirely on the application to solve the problem, not as an addition In some angles It had trouble reading the markers
How would you describe the application?
Identify objects and place them on the correct location, could be used in warehouses Simple, easy to understand
Easy to use, reliable Self-instructing
Operator-support and quality assurance in transportation Interesting insight into new technology
Aid to help deliver the correct box to the correct location Good, this aid will probably help you make the correct delivery A good aid for sorting huge amounts av packages
Aid to help transport and secure correct deliveries Exciting, I have never used anything like it before
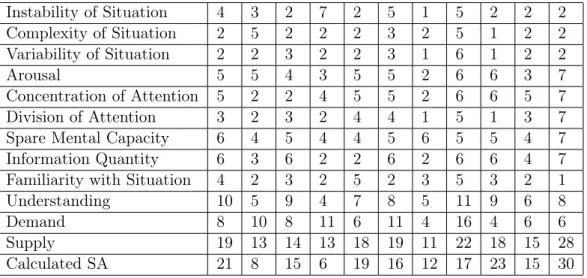
8.2 SART Instability of Situation 4 3 2 7 2 5 1 5 2 2 2 Complexity of Situation 2 5 2 2 2 3 2 5 1 2 2 Variability of Situation 2 2 3 2 2 3 1 6 1 2 2 Arousal 5 5 4 3 5 5 2 6 6 3 7 Concentration of Attention 5 2 2 4 5 5 2 6 6 5 7 Division of Attention 3 2 3 2 4 4 1 5 1 3 7
Spare Mental Capacity 6 4 5 4 4 5 6 5 5 4 7
Information Quantity 6 3 6 2 2 6 2 6 6 4 7
Familiarity with Situation 4 2 3 2 5 2 3 5 3 2 1
Understanding 10 5 9 4 7 8 5 11 9 6 8
Demand 8 10 8 11 6 11 4 16 4 6 6
Supply 19 13 14 13 18 19 11 22 18 15 28
Calculated SA 21 8 15 6 19 16 12 17 23 15 30
Table 5: SART results
Average Min Max Range Standard Deviation Instability of Situation 3.18 1 7 6 1.83 Complexity of Situation 2.64 1 5 4 1.29 Variability of Situation 2.36 1 6 5 1.36 Arousal 4.64 2 7 5 1.50 Concentration of Attention 4.45 2 7 5 1.75 Division of Attention 3.18 1 7 6 1.78
Spare Mental Capacity 5 4 7 3 1.00
Information Quantity 4.55 2 7 5 1.97
Familiarity with Situation 2.90 1 5 4 1.30
Understanding 7.45 4 11 7 2.25
Demand 8.18 4 16 12 3.60
Supply 17.27 11 28 17 4.86
Calculated SA 16.55 6 30 24 6.77
8.3 Nasa-TLX Mental Demand 20 55 35 30 30 35 10 70 30 35 70 Physical Demand 30 60 30 30 60 50 20 55 15 70 80 Temporal Demand 70 20 70 15 65 60 50 90 15 35 60 Performance 10 75 20 25 35 35 50 5 20 60 5 Effort 25 25 30 20 60 50 20 60 20 60 70 Frustration 10 55 20 10 35 50 5 55 5 20 20 Mental Workload 27.5 48.33 34.17 21.67 47.50 46.67 25.83 55.83 17.50 46.67 50.83 Table 7: Nasa-TLX results
Average Min Max Range Standard Deviation
Mental Demand 38.18 10 70 60 19.14 Physical Demand 45.45 15 80 65 21.50 Temporal Demand 50 15 90 75 25.30 Performance 30.90 5 75 70 22.89 Effort 40 20 70 50 19.87 Frustration 25.91 20 70 50 19.87 Mental Workload 38.41 17.50 55.83 38.33 13.37 Table 8: Nasa-TLX stats
9
Discussion
9.1 Questionnaire
All of our testers thought that the application was good in reference to the task at hand. Our users described it as easy to use and understand and they liked that we color coded boxes together with the drop-off zone. They did not like that once they had picked up a box there was no way of knowing what box they had beside remembering or putting the box in front of the camera again. If they picked up multiple boxes at once it became even harder to remember the letters of the boxes. They also wanted more feedback when they made a correct delivery. Some users put the box on top of the drop-off marker which made detection impossible.
9.2 SART
The average calculated SA was 16.55 with a median of 16. Minimum SA was 6 and maximum was 30 and a range of 24. The calculated SA (although wrong since one question was missing) had the highest deviation. The range on all constructs were between 6 and 3 which can indicate problems with either the application or the test.
9.3 Nasa-TLX
This questionnaire showed an average mental workload rating of 38.41 with a median of 46.67. Minimum reported workload was 17.5 and maximum was 55.83 and the range was 38.33.The resulting mental workload was more stable with an average of 38.41 with a standard deviation of 13.37.
9.4 Test Case
Some users asked other previous testers what time they had completed their test and tried to beat their time. This was not the point of the test but they did it anyway. The time of the results were not a very accurate reading since there were three drop-off points and three packages and the testers did not know where each package should be delivered, they had to walk there and look. This introduced some randomness since some users took the correct package to the correct location on their first try. This most likely added demands on physical, temporal, mental and frustration. This was also reflected in our data since temporal demand, followed by physical demand and performance had the highest average, median, max, range and deviation among all the constructs. I believe this made some of our data less reliable. However all of our users liked our application and they found it helpful in their task.
10
Conclusions
The purpose of this thesis was to explore how augmented reality can be used to enhance a heavy vehicle operators situational awareness. We produced a prototype and did some user testing using the prototype. The results were varied but mostly positive, however more and clearer testing would be preferred. Since I made an error with the SART questionnaire and did not have a control group its hard make a claim that it increases or decreases SA. The Nasa-TLX results where more stable but still suffer from the lack of a control group. For the most part, our users were pleased with the application and test scenario and described our application as easy to use and self instructing tool to help transport and secure deliveries. In order to have stronger results further testing should have been done. A larger sample of testers as well as a control group would provide much more accurate
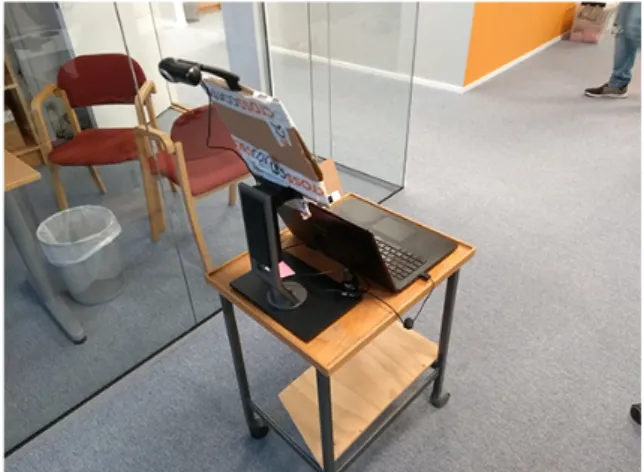
Figure 3: The wagon used in the test.
Figure 4: The boxes and markers used.
data. However since our results shows promise and where appreciated by our testers we believe our results validate further exploration of this subject.
11
Future Work
Due to the time limit of this work we felt that we could not fully explore double diamond process. In future work we would like to improve our current solution and also try to aid the user with level 3 SA. This could be done with more accurate object tracking and trying to predict things like potential collisions. We also believe that an AR system such as ours can help to identify things like stock goods. Using a system like ours at a warehouse could have great potential. You could connect the system to a central database or order system which can direct the stock workers to the most urgent tasks. There is also much room for improving the application. The way we choose to recognize markers was relatively easy to implement but there was a trade-off. Since the system looks for contours with four corners each marker is easily broken. A potentially better way of looking for markers is to for features. OpenCV has functions available to look for interest points which you can match to an image. There is also a trade-off with this method. It is a much more computationally heavy operation but if part of the image is obscured you can still find the image and
calculate its translation. It also requires that you chose good images with lots of detectable features to use as markers. Implementing camera-stabilization would greatly improve the user experience with the application. It would allow for better tracking while moving the camera and also less jittery movements on the AR-models. There also multiple ways of tracking objects such as haar feature-based cascade classifiers. Haar-cascade is a machine learning based system to detect features. Using haar cascades allows the system to easily train for multiple objects. However a haar cascade system does not allow for calculating a 3D-translation. I can be used to track an object’s position in image space. Training a haar cascade requires hundreds or preferably more of images containing the object and equally many not containing it. Training a cascade also takes time. Implementing a way to scale models based on distance and field of view would also allow for greater perception of models. Getting rid of some of the problems with the prototype would allow for a more accurate evaluation of our system in future work. Also more detailed tests would be preferable. In order to fully get rid of any detection problems future work could be done and tested in a game engine to simulate a real environment. Doing the test inside a game engine would allow for near-perfect control and you would also be able to easily utilize SAGAT for measuring SA which is a superior technique for measuring SA in most cases. You can program SAGAT into the simulation. You are also not as limited in test size and its more easily distributed. However if further work should be done on a similar type of project a larger test sample with a control group would be preferred.
12
References
[1] M. R. Endsley, “Toward a theory of situation awareness in dynamic systems,” Human Factors: The Journal of the Human Factors and Ergonomics Society, vol. 37, no. 1, pp. 32–64, mar 1995.
[2] “The design process: What is the double diamond?” accessed 2018-01-09. [Online]. Available: https://www.designcouncil.org.uk/news-opinion/ design-process-what-double-diamond
[3] M. R. Endsley, “Measurement of situation awareness in dynamic systems,” Human Factors: The Journal of the Human Factors and Ergonomics Society, vol. 37, no. 1, pp. 65–84, mar 1995.
[4] S. G. Hart and L. E. Staveland, “Development of NASA-TLX (task load index): Re-sults of empirical and theoretical research,” in Advances in Psychology. Elsevier, 1988, pp. 139–183.
[5] M. D. Matthews, L. D. Strater, and M. R. Endsley, “Situation awareness requirements for infantry platoon leaders.” Military Psychology, vol. 16, no. 3, pp. 149–161, 2004. [6] D. J. Simons and C. F. Chabris, “Gorillas in our midst: Sustained inattentional
blind-ness for dynamic events,” Perception, vol. 28, no. 9, pp. 1059–1074, sep 1999.
[7] D. Medin and C. Aguilar, “Categorization,” The MIT Encyclopedia of the Cognitive Sciences, pp. 104–106, 1999.
[8] J. B. Peterson, “Three forms of meaning and the management of complexity.” in The psychology of meaning. American Psychological Association, pp. 17–48.
[9] D. J. Simons and R. A. Rensink, “Change blindness: past, present, and future,” Trends in Cognitive Sciences, vol. 9, no. 1, pp. 16–20, jan 2005.
[10] L. W. Barsalou, “Ad hoc categories,” Memory & Cognition, vol. 11, no. 3, pp. 211–227, May 1983.
[11] T. Drew, M. L.-H. Võ, and J. M. Wolfe, “The invisible gorilla strikes again,” Psycho-logical Science, vol. 24, no. 9, pp. 1848–1853, jul 2013.
[12] G. A. Miller, “The magical number seven, plus or minus two: some limits on our capacity for processing information.” Psychological Review, vol. 63, no. 2, pp. 81–97, 1956.
[13] J. B. Peterson and J. L. Flanders, “Complexity management theory: Motivation for ideological rigidity and social conflict,” Cortex, vol. 38, no. 3, pp. 429–458, jan 2002. [14] C. Key, A. Morris, and N. Mansfield, “Situation awareness: Its proficiency amongst
older and younger drivers, and its usefulness for perceiving hazards,” Transportation Research Part F: Traffic Psychology and Behaviour, vol. 40, pp. 156–168, jul 2016. [15] R. Sukthankar, “Situation awareness for tactical driving,” Ph.D. dissertation, Robotics
Institute , Carnegie Mellon University, Pittsburgh, PA, January 1997.
[16] M. R. Endsley, “Situation awareness and human error: Designing to support human performance,” Proceedings of the High Consqeuence System Surety Conference, 1999. [17] D. de Waard, “The measurement of drivers’ mental workload,” Ph.D. dissertation,
University of Groningen, 1996.
[18] P. M. Salmon, N. A. Stanton, G. H. Walker, D. Jenkins, D. Ladva, L. Rafferty, and M. Young, “Measuring situation awareness in complex systems: Comparison of measures study,” International Journal of Industrial Ergonomics, vol. 39, no. 3, pp. 490–500, may 2009.
[19] M. Endsley, “Situation awareness global assessment technique (SAGAT),” in Proceed-ings of the IEEE 1988 National Aerospace and Electronics Conference. IEEE. [20] S. Rubio, E. Diaz, J. Martin, and J. M. Puente, “Evaluation of subjective mental
work-load: A comparison of SWAT, NASA-TLX, and workload profile methods,” Applied Psychology, vol. 53, no. 1, pp. 61–86, jan 2004.
[21] “Nasa-tlx,” Nov 2017, accessed 2018-01-09. [Online]. Available: https://en.wikipedia. org/wiki/NASA-TLX
[22] N. Meshkati, P. Rahimi, and S. Dawes, “Techniques in mental workload assessment,” Evaluation of human work: A practical ergonomics methodology, pp. 749–782, 1995. [23] R. T. Azuma, “A survey of augmented reality,” Presence: Teleoperators and Virtual
Environments, vol. 6, no. 4, pp. 355–385, aug 1997.
[24] “Htc vive,” accessed 2018-01-09. [Online]. Available: https://www.vive.com/eu/
[25] R. Azuma, Y. Baillot, R. Behringer, S. Feiner, S. Julier, and B. MacIntyre, “Recent advances in augmented reality,” IEEE Computer Graphics and Applications, vol. 21, no. 6, pp. 34–47, 2001.
[26] “Computer vision,” Jan 2018, accessed 2018-01-09. [Online]. Available: https: //en.wikipedia.org/wiki/Computer_vision
[27] X. Wenliand and Z. Lihua, “Pose estimation problem in computer vision,” in Proceed-ings of TENCON IEEE Region 10 International Conference on Computers, Commu-nications and Automation. IEEE.
[28] S. Lukosch, H. Lukosch, D. Datcu, and M. Cidota, “Providing information on the spot: Using augmented reality for situational awareness in the security domain,” Computer Supported Cooperative Work (CSCW), vol. 24, no. 6, pp. 613–664, oct 2015.
[29] S. Nilsson, B. Johansson, and A. Jonsson, “Using AR to support cross-organisational collaboration in dynamic tasks,” in 2009 8th IEEE International Symposium on Mixed and Augmented Reality. IEEE, oct 2009.
[30] E. Z.-F. Liu, C.-Y. Lee, and H.-J. Chen, “Developing a new computer game attitude scale for taiwanese early adolescents,” Educational Technology & Society, vol. 16, pp. 183–193, 2013.
[31] D. Charles and M. McAlister, “Integrating ideas about invisible playgrounds from play theory into online educational digital games,” in Entertainment Computing – ICEC 2004. Springer Berlin Heidelberg, 2004, pp. 598–601.
[32] Y.-H. Hung, C.-H. Chen, and S.-W. Huang, “Applying augmented reality to enhance learning: a study of different teaching materials,” Journal of Computer Assisted Learn-ing, vol. 33, no. 3, pp. 252–266, dec 2016.
[33] T. Politzer, “Vision is our dominant sense,” Nov 2008, accessed 2018-01-09. [Online]. Available: https://www.brainline.org/article/vision-our-dominant-sense
[34] L. W. Barsalou, “Perceptions of perceptual symbols,” Behavioral and Brain Sciences, vol. 22, no. 04, pp. 637–660, aug 1999.
[35] R. L. Goldstone and L. W. Barsalou, “Reuniting perception and conception,” Cogni-tion, vol. 65, no. 2-3, pp. 231–262, jan 1998.
[36] “Open cv,” accessed 2018-01-09. [Online]. Available: https://opencv.org/
[37] D. L. Baggio, S. Emami, D. M. Escriva, K. Ievgen, J. Saragih, and R. Shilkrot, Mastering OpenCV 3 - Second Edition. Packt Publishing - ebooks Account, 2017.
13
Appendices
B
Nasa-TLX
Figure 6: Nasa-TLX questionnaire.
C
Questionnaire
• How did the application relate to the task at hand? • What was good with the application?
• How would you describe the application?
D
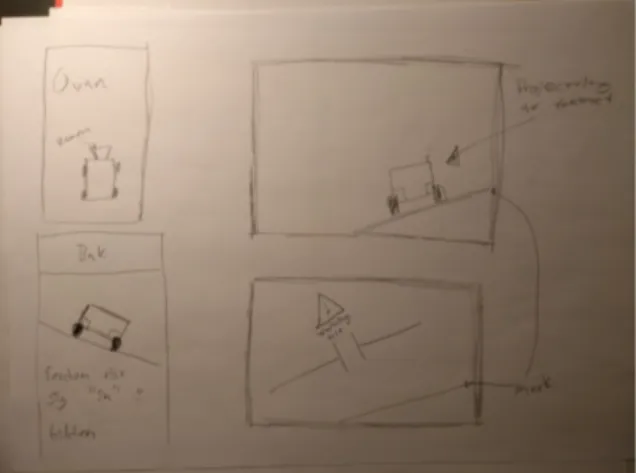
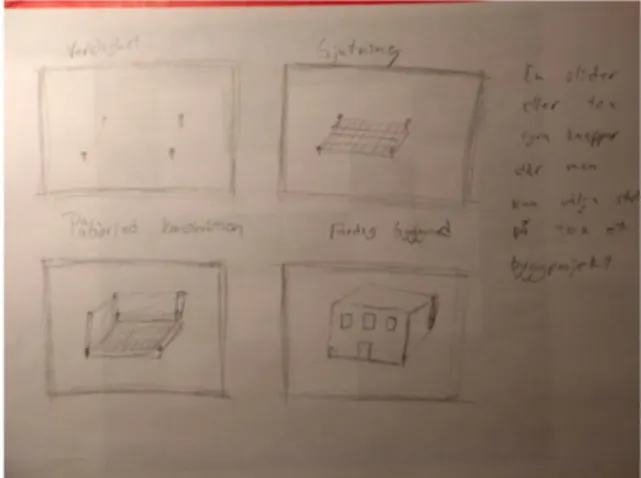
Sketches
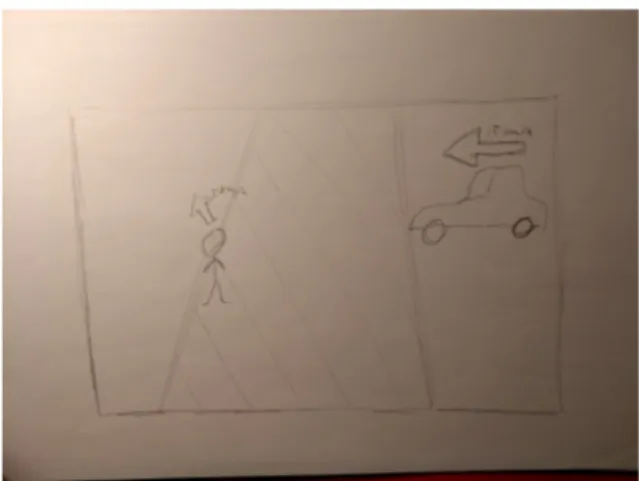
Figure 7: Early sketch 1.
Figure 9: Early sketch 3.
Figure 10: Early sketch 4.
Figure 12: Early sketch 6.
Figure 13: Early sketch 7.