REALIZING CORPORATE VISION
THROUGH BALANCED SCORECARDS
ROMAN ALAMOLOF HÄLLMAN
School of Business, Society and Engineering Course: Bachelor Thesis in Business
Administration
Course code: FOA214 15 ECTS
Supervisor: Magnus Hoppe Examiner: Eva Maaninen-Olsson Date: 2015-05-28
E-mail:
ohn12001@student.mdh.se ram06002@student.mdh.se
Abstract – “Realizing corporate vision through balanced scorecards”
Date: May 28, 2015
Level: Bachelor thesis in Business Administration, 15 ECTS
Institution: School of Business, Society and Engineering, Mälardalen University
Authors: Roman Alam Olof Hällman July 2, 1987 May 11, 1989
Title: Realizing corporate vision through balanced scorecards
Supervisor: Magnus Hoppe
Keywords: Balanced scorecards, corporate vision, key performance indicators, performance measurement, strategy.
Research
question: Why are balanced scorecards implemented and how are they adapted and developed?
Purpose: The purpose of this thesis is to describe what reasons companies claim for
implementing balanced scorecards and how these companies adapt and develop the scorecards.
Method: To conduct a qualitative research, a literature review, a case study and interviews were carried out to draw the conclusions of the thesis.
Conclusion: The study identified industry-, business- and organization-specific adaptations of the balanced scorecard as a performance measurement tool to link strategy and corporate vision to future decisions and actions.
ACKNOWLEDGEMENTS
The authors would like to thank Kenthy Holmgren and Jan-Erik Lundström for taking the time from their busy schedule and sharing their insights and experience within the field of performance measurement.
Furthermore, we would like to take the opportunity to thank our supervisor Magnus Hoppe for his expertise and feedback throughout the writing process.
______________________ ______________________
Table of contents
1 INTRODUCTION ... 1
1.1 Background ... 1
1.2 Problem discussion... 2
1.3 Purpose and research question ... 3
2 METHODOLOGY ... 4
2.1 Research design ... 4
2.2 Methodology for the literature review ... 5
2.3 Methodology for the case study ... 6
2.4 Choice of informants ... 7
2.5 Methods for performing the interviews ... 7
2.6 Methodology for the analysis, discussion and conclusions ... 7
2.7 Methodological considerations ... 8
3 LITERATURE REVIEW ... 9
3.1 The Balanced Scorecard ... 9
3.1.1 Financial perspective ... 10
3.1.2 Customer perspective ... 10
3.1.3 Internal business processes perspective ... 10
3.1.4 Learning and growth perspective ... 11
3.2 Claimed reasons for implementing a balanced scorecard ... 11
3.3 Adaptations of the balanced scorecard ... 12
3.4 Evaluation and development of the balanced scorecard ... 13
3.5 Identified patterns in the literature review ... 14
4 CASE STUDY ...16
4.1.1 Reasons for implementing a balanced scorecard ... 16
4.1.2 Adaptations of the balanced scorecard ... 17
4.1.3 Evaluation and development of the balanced scorecard ... 19
4.1.4 Identified patterns in the case study ... 19
5 INTERVIEWS ...21
5.1 Reasons for implementing a balanced scorecard ... 21
5.2 Adaptations of the balanced scorecard ... 22
5.3 Evaluation and development of the balanced scorecard ... 24
6 ANALYSIS ...25
6.1 Reasons for implementing balanced scorecards ... 25
6.2 Adaptations of the balanced scorecard ... 25
6.3 Evaluation and development of the balanced scorecard ... 26
7 DISCUSSION ...28 8 CONCLUSION...32 8.1 Limitations ... 32 8.2 Further studies ... 32 8.3 Managerial implications ... 33 9 REFERENCES ...34
Appendices
Appendix 1: Interview Questions
1
INTRODUCTION
The first chapter contains the problem discussion, leading in to the purpose and the research question of the study.
1.1 Background
Changes in the business environment during the 1980s led to a far more competitive and open, but also volatile climate. Additionally, severe reductions in information costs to
consumers resulted in transparency. In other words, the hard sales approach where budgeting dominated was rendered obsolete, and the new, harsher conditions required a better
understanding of customer needs, more efficient resource management and integrated internal processes. Retrospective analysis based on financial figures only, was pointed out as an insufficient measure of reporting achievements (Atkinson, Kaplan, Matsumura and Young, 2012; Kaplan and Norton, 1995; Wood and Sangster, 2008). The criticism of budgeting as a performance measurement was, among others, realized at Handelsbanken, one of Sweden’s dominant firms in the banking sector, who turned to different approaches than steering through an annual financial budget (Hope and Fraser, 2013).
To address this issue, scholars and businessmen started to develop models for performance measurement that would suit this new reality. According to classical relationship marketing perspectives, a company’s performance is determined by their success in meeting goals and customer satisfaction in a more efficient and effective manner than their competitors (Neely, Gregory and Platts, 1995). In order to assess the effectiveness and efficiency of companies’ actions, new types of metrics needed to be implemented. Companies combined different performance metrics into performance measurement systems (Bititci, Turner and Begemann, 2000; Neely, Adams and Crowe, 2001; Neely, Gregory and Platts, 1995; Wongrassamee, Gardiner and Simmons, 2003). Examples of different performance measurement models were applied in companies all over the world, such as the performance prism (Neely, Adams and Crowe, 2001), TPM, Cambridge performance measurement, performance criteria system (Bititci, Turner and Begemann, 2000) and effective progress and performance measurement (Wongrassamee, Gardiner and Simmons, 2003). Though differentiated in many ways, all these new performance measurement systems aimed to look beyond profits as the main performance indicator for the organization (Kloot and Martin, 2000).
Robert Kaplan and David Norton introduced the balanced scorecard as one of the strategic management tools in the US in the early 1990s. As a mean for businesses to survive in the new climate and adapt accordingly, the balanced scorecard aimed to give a more holistic approach to management. Within the scorecard, growth in financial terms was only a partial
goal. To pursue organizational strategy, strict objectives needed to be identified and measured continuously over time (Atkinson, Kaplan, Matsumura and Young, 2012; Wood and Sangster, 2008). As a result, long-term non-financial performance indicators such as customer retention and satisfaction, employee performance and retention were implemented into a new way of strategic approach for more sustainable business management. If successfully implemented, the balanced scorecard would benefit management with a durable system which concentrates strategy, empower human resources and gain competitive self-diagnostics in order to survive in the ever-changing business environment (Olve, Petri, Roy and Roy, 2003).
Modern practical approaches of constructing balanced scorecards have shaped Kaplan and Norton’s original model in numerous ways (Silk, 1998). Some adaptors added key
performance indicators relevant to their own business. Other companies implemented entire perspectives in order to map and address areas of business they prioritized (Olve, Roy and Wetter, 2004). Business consulting firms offer services in implementing and adapting balanced scorecards. Since the introduction of the model in 1992, other than originally intended organizations have implemented the scorecard approach to management. Some of them include non-profit organizations, publicly financed institutions and governmental organs. Moreover, massive experience gathered by researchers and professionals over the years resulted in other areas of use for balanced scorecards. Furthermore, academic investigations pinpointed some difficulties related to practical implementations and adaptations (Bourne and Neely, 2000).
Rapid technological changes since the introduction of Kaplan and Norton’s model in 1992 contributed with computerized tools to monitor and analyze performance. Today, many IT companies offer software solutions to firms interested in balanced scorecard. In some cases, the final output of these tools is published in annual sustainability reports to external
stakeholders to increase transparency and thereby potentially gain competitive advantage.
1.2 Problem discussion
Critics of the balanced scorecard pointed out some general problematic areas, one implying that the scorecard is not a KPI (key performance indicator) measurement tool (Barr, 2010; Olve, Roy and Wetter, 2004) since lingo used in the BSC (balanced scorecard) literature is too general. In other words, some KPIs (customer retention, brand image, etc.) bear
significantly different meaning depending on the nature of the company. Additionally, measuring cause-and-effect chain with respect to time might lead to questionable logical conclusions. Thus, the relationship between targets and key performance indicators may be diluted (Nørreklit, 2000). The harshest criticism of the balanced scorecard suggests that up to 70% of all attempts of a successful scorecard fail (Bourne and Neely, 2000). Even though Kaplan and Norton described the need for linking the scorecard metrics to the own company’s vision and strategy (1996), research indicates that one of the most common mistakes when implementing the model is that it’s not adequately adapted to the company or organization in question (Atkinson, 2006).
Despite the criticism and the fact that the literature has not been fundamentally adapted or developed since the introduction of the core idea, balanced scorecards are implemented in different companies in various industries throughout the world (Atkinson, Kaplan, Matsumura and Young, 2012) and claimed to be a successful tool in business practice (Olve, Roy and Wetter, 2004).
1.3 Purpose and research question
A great amount of articles, books and theses have studied the practical applications of various performance measurement tools, and the balanced scorecards is no exception. The majority describes different properties and aspects of scorecards and their contribution to management. The authors found the historical development and contemporary use most interesting.
Moreover, despite all criticism the model is still widely used, which raises a number of intriguing questions. On this foundation, the purpose of this thesis is to describe what reasons companies claim for implementing balanced scorecards and how these companies adapt and develop the scorecards. Therefore, the research question has been developed and stated as;
2
METHODOLOGY
Firstly the research design is presented, further the methodology for the literature review, the case study, the interview and the analysis, discussion and conclusions are shown.
2.1 Research design
In order to reach the purpose of this thesis, the authors chose a qualitative research approach rather than a quantitative. Qualitative research is applied when the researcher is aiming to study complex phenomena in their natural setting and gain deeper understanding of the reality. Qualitative analyses are designed to identify decisions based on attitude, strategy and intangible variations (Daas and Arends-Tóth 2009). Patton (2002) argues that a qualitative analysis is derived from three categories of data: interviews, direct observations and written documents. The authors of this thesis collected the data necessary in a similar fashion as the one suggested by Patton.
In order to gather better understanding of the problem at hand, and subsequently answer the research question, primary data from annual reports has been collected. The reports were retrieved from the case company covering four years of business. Primary data from the interviews was gathered from balanced scorecard professionals as representatives of a population.
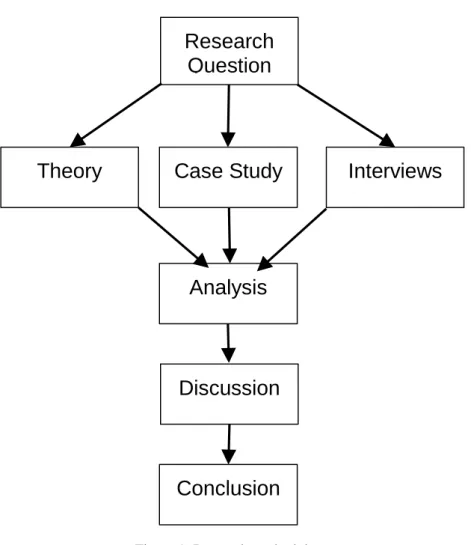
The research of this thesis was divided into a literature review which was based on previous knowledge and publications regarding balanced scorecards, an empirical case study which focused on practical applications and firm-specific examples of the balanced scorecard and interviews with business professionals who contributed with work-life experience and
expertise to further validate the conclusions of the research. The idea of the parallel processes was to build a solid foundation for the verification process in the analysis and qualitative conclusions of this thesis.
Figure 1:Research methodology
To help the reader and in order to create a clear structure for both reporting the findings of the research and comparing the findings from the additional research approaches, the authors decided to divide the findings into three headings which were connected to the research question. The sections were; claimed reasons for implementing a balanced scorecard, adaptations of the balanced scorecard and evaluation and development of the balanced scorecard.
2.2 Methodology for the literature review
The purpose of conducting a literature review was to identify where previous research within the field of interest could later be applied in the investigation of the specific area, as suggested by Daas and Arends-Tóth (2009). The authors reviewed existing literature of performance measurement in general through Management Accounting (Atkinson, Kaplan, Matsumura and Young, 2012) and Frank Wood’s Business Accounting 2 (Wood and Sangster, 2008). The books contributed with an overview of performance measurement tools. Information search showed that there was a great amount of books and scientific articles written about balanced scorecards. To gather deeper understanding of the topic, the original theories of Kaplan and Norton were reviewed. Their publications from 1992, 1995 and 1996 introduced the origins and theories behind the thesis topic. Since the research ranges from an American model to
Theory
Case Study
Interviews
Analysis
Conclusion
Research
Question
Swedish companies, necessary literature search resulted in a choice of country-specific sources by Olve, Petri, Roy and Roy (2003) and Olve, Roy and Wetter (2004). Additionally, previous bachelor theses written by Altun, Milincovici and Solmaz (2008) and Anestam et al. (2003) provided further knowledge regarding Swedish adaptations of balanced scorecards. In order to gather holistic knowledge, critical publications were found through Google Scholar. Articles by Barr (2010), Bourne and Neely (2000), Nørreklit (2000), Penman (2009), and provided alternative perspectives and treated difficulties regarding some fundamental drawbacks with the original theory.
2.3 Methodology for the case study
The purpose of using a case study approach in the thesis was to contribute with a practical example to the existing theoretical literature and discussions. Initially, an extensive
identification process was conducted in order to find a suitable case study company for the research. In this process, previous bachelor and master theses covering balanced scorecards were gathered and reviewed through the database Essays.se and mail correspondence was conducted with a university professor to see what knowledge and contacts to companies using the balanced scorecard that might be found in the local area. Internet searches were also made using balanced scorecard, balanserat styrkort and balanced scorecard Sweden as search words.
The authors found many companies which had implemented the balanced scorecard, and the authors decided that the identification process needed to be narrowed. In order to answer the research questions of this thesis and to find a case company which has a contemporary view on balanced scorecards, the ideal company for the case study should have implemented the balanced scorecard in the past five years and they should be transparent in their
communication of the balanced scorecard's measures and targets. The new criterion allowed the search process to find SJ AB. Through their official homepage, it was found that the company introduced the balanced scorecard in 2012 and that the targets and measures of the model were fully visible in the annual reports from 2012, 2013 and 2014.
Primary data from the case company was extracted from the annual reports. The relevant parts regarding the implementation and adaptations of the balanced scorecard were reviewed to fit the purpose of the thesis. Identification of direct connection to either implementation,
adaptation or development of the balanced scorecard qualified the data to be extracted. To increase clarity, every perspective was sorted on a yearly basis. Once the primary data from respective year of active scorecard usage was extracted, the authors classified all parts into three sections that contribute to the research question. The reader should know that no
interviews were conducted with the case company, the collected data solely serve as empirical findings, meaning that the authors were not aiming at determining the success of SJ’s
2.4 Choice of informants
Current research publications on bachelor level within similar fields indicated that interviews with management were of great importance (Anestam et al., 2003), this approach contributed to the researchers since it gave a deeper understanding of why some ways of conducting business generally have been prioritized over others. Therefore, this study included primary data in form of interviews with business professionals with knowledge related to BSC and its implementations and pitfalls, as well as benefits and disadvantages on a more general level to answer the research question. The idea was that the interviews would both add another perspective as well as complement the case study and the literature review.
Initial contact was made with LRF Västerås through a phone-call. The branch manager listened to the aims and the purpose of the study and recommended an interview with one of the employees. The employee agreed to a 60 minute interview with the possibility of a follow-up interview if considered necessary. The interviewee was referred to as Informant A
following Lacey and Luff’s (2001) qualitative guidelines. Informant A was a business consultant with experience from balanced scorecards ranging from entrepreneurship in smaller start-ups to CEO and board of directors roles in larger companies.
Through recommendations from LRF and KPMG, the researchers were directed to a senior manager at Penny AB, Västerås. The initial contact was made through a phone-call, followed by the confirmation via e-mail for the place and time for the interview. It was decided that a 60 minute interview would be held at the company’s office in Västerås. The interviewee was referred to as Informant B in this thesis. Informant B had experience from working with balanced scorecards as a CEO, chairman of board, consultant and as an author.
2.5 Methods for performing the interviews
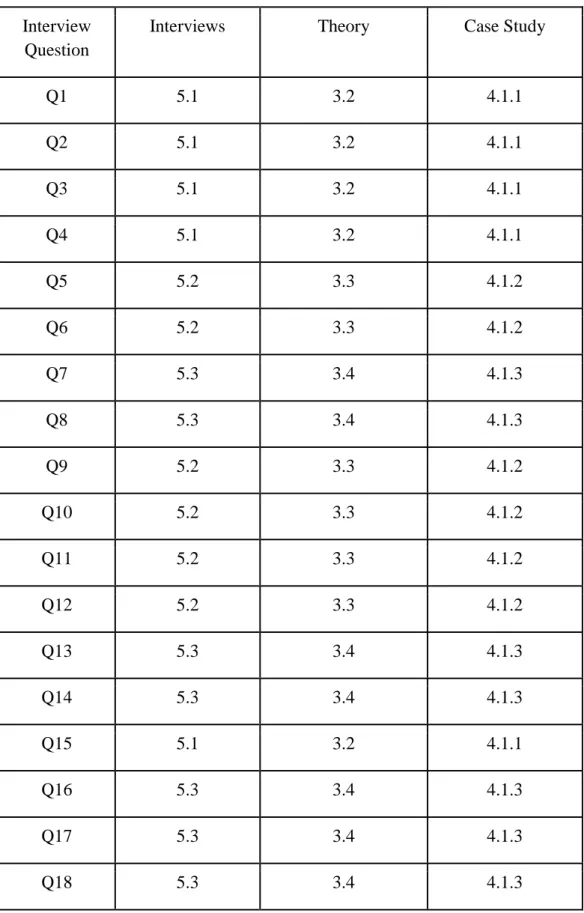
The researchers decided that semi-structured interviews would serve the qualitative approach of this thesis most effectively. Therefore, the questions in the interviews were not restricted to a limited number of possible answers, rather they were created to leave room for an open discussion while still being connected to the theoretical framework and the case study. With the interviewees’ permission, the interviews were audio recorded to elude disturbance of note-taking and misunderstandings. The audio recordings were later transcribed and reviewed to report the findings in the interview chapter. The interview questions can be found in
Appendix 1, and the interview questions’ connection to the literature review and case study are presented in Appendix 2.
2.6 Methodology for the analysis, discussion and conclusions
Following Lacey and Luff’s (2001) stages of qualitative data analysis, the authors of this thesis scrutinized the reported data from the interview transcripts and the findings from the case study and the literature review to identify themes of similarities and differences between
the three research processes. To show the consistency in the analysis of the different approaches of collected data and to increase the reliability of the analyzed patterns, all identified similarities or differences were reported under respective heading in the analysis chapter.
In the discussion chapter, the patterns and additional findings from the analysis were further developed and the importance of the identifications were more explicitly commented. In this chapter, the findings were discussed under the same heading, the authors chose this approach to show that the implementation, adaptation and development of the scorecard is a continuous procedure where the separate processes are coordinated together by the management.
Conveying the larger picture of the management of the balanced scorecard also allowed the authors to answer the research question as well as to comment on the overall contributions of the thesis in the conclusion chapter.
2.7 Methodological considerations
Limitations of qualitative studies may by some be claimed to be vague and not fully validated. The authors of this thesis adjusted to overcome this obstacle by testing and increasing the reliability and validity of the research by approaching the purpose and research question from different perspectives; literature review, case study and interviews. Limitations of the
literature review were observed since many articles and scorecard literature were relatively old and may by some be criticized as outdated, this dilemma was minimized through the support of more recent university theses. Coming to the limitations of the case study, it may be identified as a problem that the annual reports were taken from the company’s website and might be considered as biased. In an ideal situation, an interview with the case company in focus would have been conducted, due to time limitations and the company’s lack of necessary resources this was however not possible. The authors aimed therefore to
complement the information from the company’s perspective through interviews with external professionals. Limitations of the interviews can be found due to the time-constraint as well as the audio recording. According to some, audio recording may influence the answers of the interviewee, the risk of this issue was decreased by explaining the questions and the purpose of the interview to the interviewees in advance.
3
LITERATURE REVIEW
This third chapter initially aims to describe balanced scorecards in general. Furthermore, the chapter will assist to answer the research question of the study with previous publications and established knowledge to create a theoretical foundation which will later be compared to the empirical findings. The last section of the chapter include the patterns in the literature review identified by the authors.
3.1 The Balanced Scorecard
As the name implies, the balanced scorecard is claimed to analyze the performance measures within four balanced categories; financial, customer, internal business processes, and learning and growth (Atkinson, Kaplan, Matsumura and Young, 2012; Wood and Sangster, 2008). This aims to provide an integrated, easy-to-asses overview of business performances. Each perspective is divided into its respective objectives, KPIs, targets and initiatives. Numerous variations of balanced scorecards exist, illustration below is the original model by Kaplan and Norton.
3.1.1 Financial perspective
The financial perspective reveals how the company appears to its shareholders. Traditional financial accounting ratios such as returns on various capital indicate whether the company is financially successful in achieving its objectives (Atkinson, Kaplan, Matsumura and Young, 2012; Kaplan and Norton, 1995; Wood and Sangster, 2008). The targets are set to insure future growth and sustainability. Difficulties in evaluating performance may arise when some ratios become hard to interpret or fail to provide future insight (Olve, Roy and Wetter, 2004). Performance indicators such as return on capital employed (ROCE) or return on investment (ROI) reflect the past, not the future. This might lead to intensive investments in short-term return generating assets which would yield positive figures in annual reports. As a negative reaction, expenditures in research and development risk being postponed. In other words, financial perspective is a big part of any firm’s performance measurement, however, it does not necessarily reflect the firm’s ability to maximize long-term strategy and vision. Other ratios, such as reductions in accounts receivable and bad debts accounts, closely correlate to other means and initiatives which are further described in the next perspective (Kaplan and Norton, 1996).
3.1.2 Customer perspective
This perspective deals with classical marketing issues including identification of segments and target groups as well as customer retention, loyalty and satisfaction. In other words, the company’s question of how it appears to its customers is answered here. Key performance indicators in marketing terms need to be measured in order to be controlled (Kaplan and Norton, 1995). One way of monitoring and managing activities is customer satisfaction index (CSI). As stated above, in highly competitive business environments, a company needs to adapt in order to survive and set different performance targets, for instance, percentage of goods returned by customers (Atkinson, Kaplan, Matsumura and Young, 2012; Wood and Sangster, 2008). One link from this perspective to the financial perspective is diversification of revenue sources. The customer perspective has to be balanced against the financial corporate strategy as advertising and customer relations are costly investments (Kaplan and Norton, 1996).
3.1.3 Internal business processes perspective
To gain competitive advantage, a firm evaluates its measures of excellence. In order to satisfy the needs of their customers and maximize shareholders returns, businesses construct long-term operational routines (Neely, Gregory and Platts, 1995). Additionally, a firm is
recommended to identify its internal process value-chain, from innovation process to after sales services to its customer. In other words, a link from the identification of customers’ needs to satisfaction requires clear processes aligned with the overall strategy and vision (Kaplan and Norton, 1996). Depending on the nature of the business in question, some measures may include targeted production lead time and initiatives to reduce it (Atkinson, Kaplan, Matsumura and Young, 2012; Wood and Sangster, 2008). For companies in the
industrial sector, quality control rejection rates are also of crucial importance. Other measurements include percentage of sales from new products and time to develop the next generation of products. Moreover, customer retention is closely related to this perspective as well (Kaplan and Norton, 1995).
3.1.4 Learning and growth perspective
High technological development pace requires constant updates and improvement if the firm aims towards sustainable organizational strategic growth (Olve, Roy and Wetter, 2004). Here, objectives in the three perspectives mentioned above are provided with the relevant
infrastructure. This perspective aims to ensure that informational technologies and employee skills are up to date (Atkinson, Kaplan, Matsumura and Young, 2012; Kaplan and Norton, 1995; Wood and Sangster, 2008). Key performance indicators measure the level of
knowledge as well as human relations, and the targets are monitored through various rates. Reduction of staff turnover and sick leaves are some of them, but also the level of investment into employee training (Kaplan and Norton, 1996).
Depending on operational environment of the business, balanced scorecards not only differ in key performance indicators, but also in numbers of perspectives (Olve, Roy and Wetter, 2004). When appropriate, entire perspectives can be removed or added. Since its introduction, the balanced scorecard has been expressed in numerous ways. A company's needs and
interests shape the scorecard. Country-specific examples and adaptations to surrounding nature of the business are well-covered subjects in scientific publications (Ove, Petri, Roy and Roy, 2003).
3.2 Claimed reasons for implementing a balanced scorecard
Implementations of balanced scorecards can be managed by either an internal expert or an external change consultant (Kaplan and Norton, 1995). External consultation has principal drawbacks according to the criticism. Neely and Bourne (2000) mention that linguistic inconsistencies can lead to unfocused and faulty implementation of balanced scorecards. Historic reasons for implementation of balanced scorecard vary between different industries and conditions. One example includes an undersea construction company Rockwater. Even though the firm in question spent valuable time and resources to formulate an inspirational and detailed mission statement, Kaplan and Norton (1996) described a gap between stated and completed mission. Since Rockwater was a merger between two independent European companies, the balanced scorecard was used as a tool to unite operating philosophy and culture. An investigative study by Bourne, Neely, Platts and Mills (2002) mentioned that one of the challenges presented in the implementation of balanced scorecards is cultural
landscape. Sub-optimal corporate culture can jeopardize the implementations of scorecards. To show another reason for implementing the scorecard, an example of how financial
numbers alone bear significant drawbacks in terms of strategic abilities can be found in FMC Corporation, a chemical manufacturing company. Despite an excellent history related to
financial performance, it was difficult to assess the future success and sources for innovation. Again, high returns on capital do not necessarily correlate with a high potential for growth. The president of the company also stated that financial reports lacked information about long-term initiatives. According to Kaplan and Norton (1996), a balanced scorecard was
implemented to gain efficiency and customer orientation on corporate level.However, some researchers such as Nørreklit (2000), critically investigated other difficulties related to time. Nørreklit claims that some basic criteria for evaluation of cause-and-effect are not fulfilled before the implementation of scorecards.
More examples of pressure from global competition and increased customer demands at Electrolux are illustrated by Olve, Roy and Wetter (2004). A vision and strategy project in 1993 revealed that the company was in dire need of more strategic information. Similarly to the findings in FMC Corporation, Electrolux came to the conclusion that financial
information was insufficient, since it only measured past performance. Lack of measurement tools in terms of product development and customer satisfaction led the company to
investigate beyond the financial perspective. The result, GIMS (Global Integrated
Measurement System), linked corporate vision with overall strategy and short-term planning, claim Olve, Roy and Wetter (2004).
The development of new ways to account for intangible assets as part of the firm's overall value was well documented in one of Skandia's projects in the 1990s (Luthy, 1998). As a financial institution, proportions of tangible to intellectual assets are significantly different versus those in manufacturing industries. Skandia’s attempts of measuring assets other than tangible were presented in a supplement to their annual report in 1994. This additional information regarding the management’s ability to employ and utilize intellectual capital complemented financial figures in order to satisfy shareholders expectations. The project gained attention both in Sweden and across the globe (Olve, Roy and Wetter, 2004); also it contained five perspectives as opposed to Kaplan and Norton’s four. As with other examples above, due to limited nature of financial reporting in terms of time, Skandia realized that past performance measures could benefit from future targets and initiatives in order to give a holistic view of the organization, hence the name, Navigator (Luthy, 1998). Penman (2009) claims that recording intangible assets in balance sheets is not necessarily a guaranteed approach of measuring the total value of a firm. Moreover, technical difficulties of measuring such assets in segregation from the tangible is not unproblematic.
3.3 Adaptations of the balanced scorecard
Upon its implementation, Skandia's management framework incorporated an additional perspective to the most frequently used four. Due to the precise nature of operations in financial institutions, intangible assets were closely examined and differentiated into separate categories. As a result of Edvinsson and Malone’s investigation (Luthy, 1998) in the 1990s, a separation between various forms of intellectual capital was established. The basic forms are divided into human, customer and structural capital. Skandia’s management added human capital as additional perspective.The reasoning is that human resources are key components
in a successful realization of corporate strategy and vision. Luthy (1998) implies that human capital cannot be owned by company, thereby as soon as an employee leaves an organization, so will his/hers capability to solve problems. Skandia’s contribution to the development of performance measuring tools resulted in new socially responsible perspective, where key performance indicators included; percentage of women, percentage of middle managers and cost of education per employee. Individually, these measures are neither groundbreaking, nor particularly unique. Then again, connected with process focus, the result is multiplicative, and shows correlation between other perspectives. Going back to the total value of a firm, Olve, Roy and Wetter (2004) imply that the lack of human capital in balance sheets can result in misleading, perhaps even undervalued financial figures.
As previously mentioned, Rockwater was a result of a merger between two European firms. Their BSC incorporated an additional measure as a key performance indicator in financial perspective; increase in projects by collaboration between separate six engineering division. This strategic action was implemented as an attempt to provide long-term solutions to their customers, since the firm competed with quality and value-added service and not through low prices. A differentiation between various types of customers in this particular case indicates whether the firm is achieving their corporate strategy through post-sale feature and services (Kaplan and Norton, 1996). Another component of the financial perspective was measured by reduction in counterproductive usage of costly assets, in Rockwater’s case; a vessel.
Within the customer perspective a shift in business relations took place after an extensive research of their customer base. Nonetheless, critical investigations by Nørreklit (2000) raise warning signs, as the interrelation effects between the customer perspective and processes can at times be difficult to prove. In the original publication, Kaplan and Norton (1996) described a case where price sensitivity, shrinking profits and margins led Rockwater to supply smaller customers. In this case, a large part of the established clients (British Petroleum, Chevron) preferred technological expertise of their supplier to lower costs. As a result of Rockwater’s investigation of their customer needs and preferences, one of the key performance
measurements included a percentage of revenues representing value-added customer relationships in the balanced scorecard introduced by Kaplan and Norton (1998).
3.4 Evaluation and development of the balanced scorecard
Kaplan and Norton (1995) suggest an executive workshop where senior management and middle managers are present to set the targets of the balanced scorecard. In a more recent publication, Atkinson, Young and Matsumura (2013) stress that targets are designed to determine the success of the performance and a need for further development in future actions. Moreover, Kaplan and Norton (1995) propose that the targets of the balanced scorecard should ideally be set so they can be compared to other businesses within the
industry, creating a convenient overview of the company’s performance effect on the position in the market. Specific market-connected targets are exemplified by Atkinson, Kaplan,
Matsumura and Young (2012), mentioning 30 minutes at the gate and 90% on-time
realized as operating income, ROI, EVA, prices compared to competitors, number of repeat customers, percent of stock-holding employees, number of hours of training per employee etc. Kaplan and Norton (1995), mention that the senior management is responsible for developing action programs to meet the measurement targets. The executives also need to agree on an implementation program which involves communication to internal stakeholders,
management connections and an information system connected to the balanced scorecard. At this point, the implementation plan is ready and the metrics are connected to the company’s databases and information systems. Further, communication and integration are well-developed through the company stream.
To assess the contribution of the balanced scorecard, Kaplan and Norton (1996), as well as Olve, Roy and Wetter (2004) propose continuous periodic reviews of the scorecard. The periods may be quarterly or monthly. The measures of the balanced scorecard are assessed annually to evaluate their relevance regarding strategy, goal alignment and resource allocation. Looking at the actual performance in comparison to the targeted, the company evaluates if it is performing as well as aimed to.
3.5 Identified patterns in the literature review
Despite minor differences in the claims for implementations of balanced scorecards, a general trend is present. Realizing corporate vision through systematic strategic actions which can be observed and controlled is the most common claim. To evaluate other measures than the financial, such as employee loyalty and competence, are also mentioned as reasons for implementation. Internal processes and development are other common denominators
amongst companies within the manufacturing sector. As previously mentioned, firm-specific needs are merely technicalities and strategic means to realize corporate vision. Additionally, firms suspect that they could benefit from an overview of all aspects of their daily operations. Moreover, managing a company while focusing on future, as opposed to past performance is another claim mentioned.
General pattern in firms’ adaptations of balanced scorecards can be interpreted in terms of conversion of strategic objectives into relevant targets and initiatives.
The originators of balanced scorecards argue that measuring performance and deploying initiatives to reach targets increase the chances of corporate success. Despite the fact that targets, numbers of key performance indicators and even perspectives differ across firms and market, Kaplan and Norton’s model fulfills the very same managerial need; a holistic view of company’s performance. Furthermore, although the contribution attributed to each
perspective and indicator differs depending on the nature of business, the purpose of measuring performance is unchanged and should theoretically still balance.
The patterns detected in the theoretical framework provided by researchers within the field, stress the importance of continuous evaluation of the scorecard. Numerous approaches to, and pitfalls of, long-term target setting are treated in the majority of the data collected. Amongst more recent publications, the core of re-evaluation remains unchanged. In other words,
despite the fact that some key performance indicators and measures are subject to change the development of balanced scorecards is an ongoing process. Additional common property mentioned by supporters of scorecards was found in the shared belief that operational targets and initiatives to reach goals must have some relation to the overall strategy and vision of the company.
4
CASE STUDY
The fourth chapter serves with practical examples of a balanced scorecard in the Swedish company SJ AB. Presented within the chapter are the claimed reasons for implementing the scorecard, the adaptation towards the specific business as well as evaluation and
development of the scorecard. Lastly, the authors’ identified patterns in the empirical findings are presented.
4.1 SJ AB
Fully governmentally owned SJ AB operates within railroad traveling industry in Sweden. The firm had monopolistic power until total deregulation in 2011 (Historiska Fakta, n.d). SJ’s number of daily customers totals to 85 000 and the firm employs approximately 5000
workers. The company's latest vision from 2014 is stated as “A SJ to rely upon and long for”. Implementation of the balanced scorecard is dated to 2012.
4.1.1 Reasons for implementing a balanced scorecard
SJ’s annual report from 2012 mentions that in order to create a process for strategic and operational control, a balanced scorecard with six perspectives was implemented. The idea of a sustainable business approach requires that all perspectives should indeed be balanced (SJ Annual Report, 2012). In more practical terms, a number of activities should be linked to social, environmental and financial perspectives. SJ’s Chairman Jan Sundling implied that sustainability should be managed and achieved in a way that is compatible with SJ’s strategy and corporate vision, but also daily operations. Without explicitly using the words “balanced scorecard”, the chairman mentions that through a series of parameters, e.g. punctuality, employee satisfaction, SJ applies a holistic approach to business.
In 2013, SJ’s board of directors adopted a new long-term strategy due to new customer demands (SJ Annual Report, 2013). As a result, a new cost saving program (1 billion SEK in three years) was launched. Increased competition and reduced margins (15 minutes to 5) in terms of punctuality required a set of sustainable activities (SJ Annual report, 2011). The CEO stated that customer oriented organization is the opposite of hierarchal one. This implies that SJ has to involve everyone in the company in order to enhance customer experience. Therefore, all levels of SJ have to observe the direction in which the company is heading. The vision in 2011 “to get everyone onboard” resulted in a proactive approach in order to reach targets/sustainability in the company’s just a year old balanced scorecard. Overall, higher standards in all perspectives need a strategic guidance and activities. The chairman stressed that customer’s expectations, the organization's role in society and how SJ will meet the targets, must be organized, measured and reported (SJ Annual Report, 2013). Long-term objectives were converted into three categories in the BSC and measured on monthly basis. Moreover, the chairman mentioned a need for a system where vision, targets and internal
processes must be recorded and evaluated. Additionally, the control of operations on the initiative from primary stakeholders (Swedish government) can be achieved through the balanced scorecard. All governmentally owned firms are required to set a challenging long-term strategy, sustainability targets and translate into operational targets and activities. These aspects must be relevant, ambitious and measurable (SJ Annual Report, 2014). Another aspect for the implementation of balanced scorecard is the possibility to hedge against negative deviations before they have great consequences through monthly and annual follow-ups. SJ broke down targets into specifics in order to give a holistic view on all organizational levels of each employee’s contribution to overall strategy. SJ also used their balanced scorecard as a monitoring tool for risk management. The annual reports have a separate section where every perspective is mentioned (SJ Annual Report, 2013; SJ Annual Report, 2014).
The annual report from 2014 (SJ Annual Report, 2014) also introduced corporate culture as an adhesive that holds the components of organization together. Moreover, by reaching the targets/goals in both financial and non-financial perspectives, more capital for further improvement of customer service is available.
4.1.2 Adaptations of the balanced scorecard
SJ’s balanced scorecard has developed key performance indicators in nearly all six
perspective during the three year lifecycle. SJ translated their targets into specifics in order to provide a global perspective to all organizational levels and each employee’s contribution to overall strategy. In the annual reports, there is an emphasis on relationships between not only different KPIs, but also perspectives, as dictated in 2012 that the scorecard should be balanced (SJ Annual Report 2012; SJ Annual Report, 2013; SJ Annual Report, 2014).
Customer perspective
This perspective monitors two indicators: Brand Index (Varumärke Index) and Customer Satisfaction index (SJ Annual Report, 2012). Although annual external cross-industry ranking (Trust barometer) indicated a room for improvement, internal targets were just below set and SJ implemented a motto “Customer satisfaction, my responsibility” to increase motivation amongst the employees to meet customer expectations. By 2013, the company’s Brand Index met the desired outcomes set in 2012 (SJ Annual Report, 2013). Still, SJ continued with additional activities/initiatives to investigate the weaknesses and strengths that reflected upon customer’s perception in terms of trust and approval.
Brand Index, VMI, (Varumärke index) acquired a new definition in 2014. Through customer input, an analysis was made of the four dimensions the brand should stand for; reliable, simple, humane and pleasant. Internal culture should reflect upon external brand. With the help of Brand Index, SJ measured the dimensions among the customers and the public divided into a series of measurement points. Together with CSI they aimed to complement each other. CSI measured existing customers and VMI, potential and existing ones (SJ Annual Report, 2013).
In 2014, additional regional punctuality KPIs within the customer perspective were added (SJ Annual Report, 2014). CSI was used as a measurement tool to analyze customer’s preferences
in order to continue choosing SJ as the service provider. Despite a reduction in general SQI (Swedish Quality Index), there was an improvement in customer satisfaction base from the target 70 to the outcome of 72. Punctuality indicated slightly higher figures in 2013.
According to SJ, punctuality can be a contributing factor to increased CSI. Also, increase in business travels and presence of personnel on trains as well as platforms contributed to the upwards sloping trend.
Process and product perspective
As industry-specific key performance indicators, SJ adopted Punctuality and Regularity. During the years, the number of KPIs in process and product perspective almost doubled from four to seven, as new KPIs for regional traffic were added (SJ Annual Report, 2013). As one of the actions to achieve desired targets, SJ entered a joint venture with other actors to form TTT (Together for trains on time, an initiative to reach 95% punctuality by 2020). Continuous internal auditing for reduction in delays was an activity employed by the management to increase customer satisfaction and realize the vision of getting everyone on board.
Safety perspective
In 2013, two performance indicators were adopted in the safety/community perspective; Traffic Safety Index and number of serious injury victims. To achieve the zero-victims target, SJ implemented routines to record and report all accidents. Moreover, near accidents and potential dangers were monitored and reported through a computer system to contribute to a proactive approach (SJ Annual Report, 2012; SJ Annual Report, 2013; SJ Annual Report, 2014).
Employee perspective
SJ measured performance of the employees on all levels of organization. Annual Employee Satisfaction Index was performed since the introduction of the balanced scorecard. Prior to that, the satisfaction survey was conducted every other year (SJ Annual Report, 2012).
Investments in staff training were intended to raise environmental awareness. The 2012 index resulted in 61, above the industry average 55-57. Initiatives for additional improvements of satisfaction included cooperation between divisions and management’s ability to respond to feedback to personnel.
In 2013, the satisfaction index was replaced by two new KPIs; Performance and Leadership Indexes (SJ Annual Report, 2013). The performance index measured the conditions the employees need to perform tasks, as well as their contribution to the firm. The leadership index was derived by non-managerial employees, as they ranked management’s ability to provide the above conditions. Open dialogue and reception of feedback were continuous initiatives to fulfill the targets.
The final KPI in the employee perspective measured sick leave percentages. As the company stated in 2014 annual report, health comes first (SJ Annual Report, 2014). Rising percentages in long-term sick leave resulted in a number of activities to reach set target. Health promotion and surveys were designed to proactively reduce the outcomes in the future.
Partnership and resources perspective
This perspective included a single key performance indicator which was derived from a percentage of supplier and partnership assessments (SJ Annual Report, 2012). SJ set
initiatives to audit the third party support in terms of their ability to process chemicals and manage waste in environmentally friendly manner. Additionally SJ expected all their suppliers to follow a code of conduct set by the Swedish government.
Financial perspective
The financial perspective stressed SJ’s responsibility to meet stakeholders expectations (returns) linked to the owner’s targets. As an initiative the company implemented a cost savings program to reduce costs over three years, 1 billion SEK (SJ Annual Report, 2013). Additionally, the management mentioned that return per passenger was the main factor affecting overall financial performance. Strategic investments were made in operating assets (fleet) to meet owner’s requirements. The goal of the owner (Swedish government) was to keep finance running at the same time as realizing strategies decided upon. A number of KPIs changed during the three year life span of SJ’s balanced scorecard. Regardless, the
management had a long-term strategic plan with all financial decisions (SJ Annual Report, 2014).
4.1.3 Evaluation and development of the balanced scorecard
In order to realize SJ’s corporate vision, “A SJ to rely upon and long for”, the company’s balanced scorecard has been re-evaluated every year (SJ Annual report, 2014). A number of key performance indicators have been added and deleted. The latest sustainability report has a total of 26 indicators allocated across six perspectives. SJ stressed numerous times the
importance of punctuality and its effects on customer experience of the company. Investments into the rolling fleet (trains) and collaborations with other actors within the industry such as TTT were some of the practical examples of direct initiatives for better punctuality. Other operational activities were used as daily routines to enhance customer satisfaction and increase brand index. The purpose of these initiatives, according to SJ, was to enable the company to reach its corporate vision.
The executive management in collaboration with the representatives of the board formulated long-term activities to support the corporate vision that was linked to investments into all areas of business, financial and non-financial. Only by reaching targets in both categories was SJ capable of creating more space for further investments into customer friendly initiatives (SJ Annual Report, 2014).
4.1.4 Identified patterns in the case study
Claimed reasons for implementing the scorecard highlighted rapid changes in business climate caused by customers, owners, or regulations. On a number of occasions, SJ stressed the importance of a measuring and steering tool in order to address the difficulties arising due to external and internal pressure. Additionally, cross-dependency between all levels of the organization and their performance was claimed to be proportional to the potential success or failure of realizing corporate vision.
Typically, adaptations of scorecards tend to include business-specific targets and initiatives. Safety measures within transportation industry were of crucial importance according to SJ. Moreover, SJ’s adaptation within the employee perspective has resulted in changed measures. The reason for drastic replacement could theoretically be explained by the dynamic nature of balanced scorecards. The pattern observed in the financial perspective can partially be
explained by updated accounting standards and new performance measures within the field of corporate finance as well as legal regulations. The general trend observed in adaptation within the customer perspective could be interpreted as attempts to set measures and initiatives for a more flexible response to customers’ demands. In support of this interpretation, SJ’s
adaptation of the balanced scorecard has been subject to change throughout the years and some indexes were not comparable with those used in previous years.
In summary, the overall evaluation and development of SJ’s balanced scorecard have been focused on improving measurements and initiatives for increased punctuality. Due to the nature of the rail road business, SJ stressed numerous time the need to prioritize punctuality, as it is closely correlated with customer satisfaction and retention. The chairman pinpointed the fact that the company had to focus on future success through long-term strategies and daily operations. Furthermore, a significant amount of resources was invested in technical improvements as a mean of not only reaching higher punctuality, but also as a connection to the overall customer satisfaction index. Again, as the management pointed out above, the scorecard has to be balanced.
5
INTERVIEWS
This chapter aims to report the findings from the interviews within the three areas of investigation. The interview questions can be seen in Appendix 1.
5.1 Reasons for implementing a balanced scorecard
Informant A claimed that the balanced scorecard at the time of its introduction in the mid-90s was not very well-known. However, thanks to dedicated adaptors and continuous academic publications within the area, the demand for the concept has increased and today it’s popular for companies to ask for help with implementing the scorecard. The rising demand for balanced scorecards was partially explained by Informant B to be due to an increased understanding and consideration of intellectual capital in today’s information-based world. Informant B further claimed that contemporary businesses and organizations are heavily relying on the practical knowledge of the employees. Since employees tend to come and go, Informant B suggested that companies need to comprehend the importance of their
intellectual capital. In order to make this kind of knowledge measurable, Informant B has developed Futureyes' Competence Index, which was declared to take factors such as classical knowledge, experience, courage, productivity and motivation into account. The BSC serves, according to Informant B, as a helpful tool to incorporate this intellectual capital in the companies’ other intangible assets.
Informant A provided an example of a typical situation where a company wants help with the implementation of the scorecard when an entrepreneur has had an idea or a product and then the business has just developed around production or sales. In this particular example, the business has initially been steady, but somewhere along the line the overall processes and structure have been forgotten.
A benefit of the scorecard that was proposed by both informants was the possibility to manage the company for future decisions rather than historical, as with traditional financial budgeting. The idea with the balanced scorecard stated by Informant A, was that it would be built on a with a 20/80 foundation, focusing on 20% past performance and 80% vision for the future. Focusing too heavily on previous performance will, according to Informant A and Informant B, only result in a waste of resources and time.
Another benefit of the implementation of the scorecard was claimed by Informant A to provide a clear strategic overview of the company resulting in a better understanding of the employees, customers and financial situation.
Informant B suggested that the balanced scorecard can be implemented to serve as a quality measurement tool. The benefit of this approach was highlighted by Informant B as being able to control the gap between expected quality and experienced quality of processes. The initial connection when discussing quality is often the quality of products, however, Informant B stated the importance of quality within all processes within all the perspectives. The processes of the contemporary company are often both complex and involve large numbers of people,
which is why, according to Informant B, the BSC as a quality tool can provide the organization with process mapping to work proactively with risk management.
Informant A stated that as with any investment, companies expect some kind of return when the model is implemented. The expected returns are usually created along the implementation process. Changes in general are easier to realize if one can visualize the aspired future
position and how to get there. In connection to the balanced scorecard this means that if a company determines a demanding goal for financial key performance indicators, the chances to meet that target will increase. As an example in the customer perspective, informant A describes a company which had a problem with customers being too small and not very profitable. To help the company with this issue, Informant A asked them who they wanted as customers instead and why the company was not approaching those desired customers. After some dedication and hard work, the company attained their desired customers. Informant A suggested that this was one of the major contributions of the balanced scorecard, it makes it possible for companies to realize their potential rather than just keep conducting their business as they always have done.
Regarding criticism claiming that companies implement balanced scorecards with a hidden agenda, Informant A was not agreeing, stating that the only reasons for companies to adopt BSC are to provide structure, vision and strategy to the organization. According to Informant A, any underlying reasons would harm the company as a whole. Simultaneously, Informant B argued that some companies are resistant to explicitly state that they are using balanced scorecards, even though it is the underlying framework for coordinating the sales, marketing, research and development, human resources and financial departments. An additional
explanation of the hostility towards balanced scorecards was, according to Informant B, the Swedish translation balanserat styrkort, balanced control card. The word control creates a resistance in some companies, exemplified by Informant B as advertising agencies and
educational/health care entities, which claim that they are not driven by a traditional corporate agenda but rather by internal motivational factors, for instance creativity.
Informant B also criticized Kaplan and Norton’s original scorecard, claiming that it was developed to prioritize the satisfaction of the stockholders, when other stakeholders are of equal importance for the company’s situation. Informant B therefore suggested that the Swedish model, developed by Leif Edvinsson, was better for a sustainable future since it’s more focused on creating long-term value for the organization.
5.2 Adaptations of the balanced scorecard
During the first interview, it was claimed by informant A that adaptations of the balanced scorecard can be due to different markets and types of businesses. For instance, even though the scorecard was initially introduced as a tool for private, profit-maximizing organizations, it has been implemented in organizations in the public sector. Informant A revealed that he had been responsible for implementing the balanced scorecard to public health care centers in Sweden. The implementation was, according to Informant A, both helpful in the short-run for day-to-day processes and in the long-run for managing revenues contra expenses.
Further adaptations of the scorecard metrics in different markets can be seen in the customer perspective. Customer satisfaction was, according to Informant A, seen as a key performance indicator in some scorecards since it allows the company to create repeat business. Companies usually evaluate customer satisfaction through surveys and if it’s detected that the ratio is inadequate it’s up to the company to act in order to improve in that area. Another customer satisfaction metric that is interesting for some companies to evaluate is profitable versus unprofitable customers, which Informant A claimed to allow the company to understand which customers to focus on and which customers to phase out.
However, in the financial perspective, the measurements are often the same between different markets. This was claimed by Informant A to be since most companies’ development of the other KPIs are based on the profits since the profits contribute with the possibility and the financial power to educate the staff, hire new employees, expand in the market etc.
More organization-specific adaptations of balanced scorecards, according to both informants, are usually originated in the senior management of the company since the vision for the future is set by the board of directors and the owners. From the top-level, the vision and strategy need to be coordinated and clear throughout the whole organization. Informant B declared that since the vision and strategy are aligned, it is possible to introduce individual scorecards for particular departments and/or employees.
Informant A stressed the need to keep KPIs at a reasonable number, preferably at a maximum of three per perspective. If the company is depending on a larger number of KPIs, it’s,
according to Informant A, easy to get disoriented and lose the control of processes. Informant B supported a limited number of KPIs, arguing that it makes it easier to communicate the strategic goal. When the vision and target of one KPI is realized, the company can instead focus on another KPI.
During the interviews, it was stated that some companies introduce a completely new perspective to the scorecard. Informant B explained how a fifth perspective is often introduced to highlight the importance of the employees. Additional perspectives can, according to Informant A, be exemplified in contemporary companies which want to add a sustainability or CSR (Corporate Social Responsibility) perspective to show that these kinds of questions are important for the company. Another perspective-related suggestion was made by Informant B, recommending companies to change the name of the internal processes perspective to production perspective. This was since the word processes creates, according to Informant B, a confusion in adaptations of the scorecard since modern-day companies’
processes range over all perspectives.
Further contemporary adaptations of the scorecard which Informant B recommended included its integration with an IT tool which serves with automatic collection and analysis of data. The BSC can, according to Informant B, also be adapted to serve as a template for board meetings, where every perspective is being treated individually. Informant B declared that this approach allows organizations to be more time efficient when planning board meetings, and that the meetings can involve a more horizontal agenda, removing the over-prioritizing of financial questions that is often the case.
5.3 Evaluation and development of the balanced scorecard
Informant A confirmed that balanced scorecards are introduced to translate strategy and vision into action, allowing the business idea to be developed with an increase in both clarity and efficiency. Informant B claimed that many companies have problems communicating the strategic goals of various actions to the employees. Informant A suggested that this
communication could benefit from the organizational overview that the scorecard contributes with. When determining strategic goals, the responsible person will, according to Informant A, benefit from asking questions such as How do I want the staff to be when the vision is
realized?, from this question it’s convenient to decide what actions to take. On this
foundation, the company can find the appropriate measurements to evaluate the process. A similar approach can be applicable in all perspectives. Informant A argued that the KPI targets should be determined from the own organization’s strategy and vision and not be based on the performance of the competitors, even if that would be a desired corporate goal in the long-run. Informant B supported this argument, declaring that even if companies operate within the same market, their processes are often too complex and different to compare with traditional benchmarking methods. Informant B explained the differences to exist since every company has its own way of managing the components of each scorecard perspective.
When asked if there was any strategic purpose for publishing unfulfilled balanced scorecard goals or targets in public documentations such as annual reports, Informant A agreed, stating that brave companies have the courage of showing in which areas the company has not managed to meet the desired goals and what they will be doing in the future to increase performance in that area. Informant B also supported the transparency of this approach and pointed out that Apoteket and the city of Eskilstuna have worked in a similar manner. As another way of increasing the transparency towards external stakeholders, Informant B suggested that companies can grant temporary access to the integrated BSC IT-system for guest users.
Before determining if the implementation of a balanced scorecard was a success or not, Informant A stressed the importance of using the tool and the way of thinking in the long run, stating that the scorecard needs continuous evaluation and development in order to follow the company life-cycle and changes in the external environment. If these factors are lacking there is, according to Informant A, a risk that the company loses focus of processes and structure, finding themselves in the same situation as before implementing the balanced scorecard. Informant B confirmed the importance of patience when implementing the scorecard, revealing that it might take time for companies to find a suitable approach to appropriately serve the needs of the particular organization.
6
ANALYSIS
This chapter aims to distinguish any similarities and differences in the findings through comparing the literature review with the results of the case study and the interviews.
6.1 Reasons for implementing balanced scorecards
The findings of the separate research approaches indicate many similarities between theory and practice when it comes to reasons for implementing balanced scorecards. As suggested by previous publications (Kaplan and Norton, 1996; Olve, Roy and Wetter, 2004) balanced scorecards are implemented in companies today to realize corporate vision (Informant A; Informant B; SJ Annual Report, 2012; SJ Annual Report, 2013; SJ Annual Report, 2014). Further similarities are exemplified in the findings, suggesting that the scorecard is
implemented since financial figures on their own do not adequately measure the company's performance. Evidence in both theory (Atkinson, Kaplan, Matsumura and Young, 2012; Bititci, Turner and Begemann, 2000; Kaplan and Norton, 1995; Kaplan and Norton, 1996; Luthy, 1998; Neely, Adams and Crowe, 2001; Neely, Gregory and Platts, 1995; Olve, Roy and Wetter, 2004; Wongrassamee, Gardiner and Simmons, 2003; Wood and Sangster, 2008) and practice (Informant A; Informant B; SJ Annual Report, 2012; SJ Annual Report, 2013; SJ Annual Report, 2014) show that companies could benefit from incorporating non-financial measurements in order to create a more realistic assessment of the company’s performance. These findings were further validated by both theoretical (Hope and Fraser, 2013) and empirical support (Informant A) of traditional financial budgets’ shortcomings in connection to future decisions and strategy actions. Informant B supported these arguments by stating a need for calculating and measuring intellectual capital.
The research also identified additional reasons for implementing balanced scorecards which were not covered in the literature review in form of the balanced scorecard as a risk
management and quality measurement tool as well as a mean of linking corporate culture to corporate strategy and vision (Informant B; SJ Annual Report, 2014).
6.2 Adaptations of the balanced scorecard
Comparisons between the theory, the case study and the interviews allowed to find similarities between theory and practice regarding the adaptation of balanced scorecards. From the different research approaches, similarities in drivers for adaptation were realized as business specific (Informant A; Informant B; Kaplan and Norton, 1996; SJ Annual Report, 2012; SJ Annual Report, 2013; SJ Annual Report, 2014), market specific (Informant A; Informant B; Luthy, 1998; Norton, Kaplan, Matsumura and Young, 2012; SJ Annual Report, 2012; SJ Annual Report, 2013; SJ Annual Report, 2014) and specific to the organizational structure (Atkinson, Kaplan, Matsumura and Young, 2012; Informant A; Informant B; SJ Annual Report, 2012; SJ Annual Report, 2013; SJ Annual Report, 2014).