http://www.diva-portal.org
This is the published version of a paper presented at ESAFORM 2016: Proceedings of the 19th
international ESAFORM conference on material forming, Nantes, 27–29 April, 2016..
Citation for the original published paper:
Ghassemali, E., Jarfors, A E., Tan, M-J., Chua, B W. (2016)
Microstructure versus substructure size effect.
In: AIP Conference Proceedings (pp. 1-6). American Institute of Physics (AIP)
http://dx.doi.org/10.1063/1.4963491
N.B. When citing this work, cite the original published paper.
Permanent link to this version:
Microstructure versus substructure size effect
Ehsan Ghassemali
,
Anders E. W. Jarfors
,
Ming-Jen Tan
, and
Chua Beng Wah
Citation:
AIP Conference Proceedings
1769, 090001 (2016); doi: 10.1063/1.4963491
View online:
http://dx.doi.org/10.1063/1.4963491
View Table of Contents:
http://scitation.aip.org/content/aip/proceeding/aipcp/1769?ver=pdfcov
Published by the
AIP Publishing
Articles you may be interested in
Finite size versus surface effects on magnetic properties of antiferromagnetic particles
Appl. Phys. Lett. 99, 232507 (2011); 10.1063/1.3668091
Effects of Size and Microstructures on Infrared Spectra of Pyrolusites
Chin. J. Chem. Phys. 24, 181 (2011); 10.1088/1674-0068/24/02/181-188
Exploiting finite size effects in a novel core/shell microstructure
J. Appl. Phys. 103, 064313 (2008); 10.1063/1.2844286
Effect of system size on particle-phase stress and microstructure formation
Phys. Fluids 16, 265 (2004); 10.1063/1.1633264
Barkhausen noise and size effects in magnetic microstructures
Microstructure versus substructure size effect
Ehsan Ghassemali
1,a), Anders E.W. Jarfors
1,b), Ming-Jen Tan
2,c), Chua Beng Wah
3,d)1School of Engineering, Jönköping University, P.O. Box 1026, SE-551 11 Jönköping, Sweden 2School of Mechanical & Aerospace Engineering, Nanyang Technological University, 639798, Singapore
3Singapore Institute of Manufacturing Technology (SIMTech), 71 Nanyang Dr, 638075, Singapore a)Corresponding author: ehsan.ghassemali@ju.se
b)anders.jarfors@ju.se c)mmjtan@ntu.edu.sg d)bwchua@simtech.a-star.edu.sg
Abstract. In metal deformation, size effect is generally attributed to the interactive effect of grain size and specimen dimension. This work shows, however, that relative substructure dimensions should also be considered. Micro-compression tests on the micro-pins having different grain sizes revealed no significant size effect with respect to the mechanical behavior, even if the number of grains over the diameter of the micro-pins falls below its critical value. To justify the reason laying under this fact, a recovery annealing cycle was applied on the micro-pins to change the substructure properties without altering the mean grain size. A surprising drop in the flow stress of the recovery-annealed micro-pins implied the importance of considering subgrain size rather than grain size over the diameter of component for the size effect investigation.
INTRODUCTION
In principle, size effect on flow stress is described by T/D ratio, i.e. the thickness of the specimen over the average grain diameter (the number of grains over the cross-section of the specimen). Under such circumstances, Hall-Petch equation needs modification to be able to explain metal deformation with respect to the specimen microstructural dimension.
Chan and Fu 1 reported that at a given grain size, decreasing the specimen size reduces the grain boundary volume
fraction, which in return affects the grain boundary strengthening effects. Moreover, smaller specimens could generate a lower dislocation density inside the grains to accomplish deformation. Therefore, both grain size and specimen dimensions contribute to the grain strengthening and overall material behavior during the forming process 2. Based on
this fact, a modified Hall-Petch equation was reported considering the interaction effects of specimen and grain size for fully annealed samples.
In another attempt, Hug and Keller 3 found that dislocation cells exhibit a delay in their spatial arrangement for the
specimen with a small T/D ratio.
In contrary, there exist a number of studies depicting opposite behavior; namely micro-bending of pure Ni 4,
demonstrated raise in strength with decreasing the specimen size. Prior to that, Hahn et al. 5 had studied the grain size
modified the Hall-Petch model with taking the grain boundary thickness into consideration for ultra-fine grained structures 6. The interactive grain- specimen size effect, however, was not considered.
It is interesting noting that the material used in all the previous work was fully annealed before forming. This implies that the initial dislocation structure of all the previous studies was the same, with almost no initial dislocation cells or subgrain developed in the microstructure before forming, thus ignoring the possible subgrain size effect.
The aim of this study is to represent an in-process (specimen-grain) size effect and compare it to the post-production (specimen-subgrain) size effect in the micro-component. The interactive effect of grain and specimen dimensions on the mechanical behaviour during a progressive microforming process was investigated. The produced micro-components were analyzed for understanding the subgrain dimensions effects on the mechanical properties. Electron Backscatter Diffraction (EBSD) analysis was used to study the microstructural and substructural size effects.
EXPERIMENTAL
Electrical Tough Pitch (ETP) C11000 copper (99.94%) strips, in the as-received cold-rolled condition, with the mean grain size of 14±4 μm were used in this study. Two different strip thickness of 0.5 mm and 2.5 mm were chosen for this study. The strips were annealed at 400, 600 and 800°C in a Lenton tube furnace under vacuum of 10í5 mbar using a ramp of 3 °C/min for 1h. This was used to study the grain size and specimen size effect on the process.
A progressive microforming process was used for the manufacturing of micro-pins, employing sheet/strip metal extrusion and blanking. It is important to note that the forming process is an open-die process, since we use a strip metal as the feed for the extrusion process and not a billet. More details of the process can be found in 7. A punch of
diameter 2.0 mm was used for production of the 0.3 mm pins. All the experiments were done in dry condition. The strips regardless of their initial thicknesses were punched till 0.2 mm of the remaining thickness. The micro-pins dimensions were measured using micrometer caliper as well as digital microscope.
A programmable servopress (SCHMIDT ServoPress 420) was used for the deformation process. The load– displacement behavior of the punch was monitored by the machine precisely, with resolution data acquisition of 0.01kN for the force and 0.005mm for the displacement.
To study the effect of substructural dimension on the post-production component properties, a batch of micro-pins was recovery-annealed (RA) at 230ÛC for 1 hr; to annihilate the dislocation structure.
A JSM-7600F Field Emission Scanning Electron Microscope (FESEM) equipped with an Oxford Instruments EBSD system was used at accelerating voltage of 15kV with a working distance of 18 mm and a 70° tilt angle using step size of 0.2 μm. For the data sets obtained from EBSD mapping, all the fractions of successfully indexed data pixels were higher than 70%, without any cleanup process. The high angle grain boundaries (HAGBs) were considered grain boundaries with misorientations above 15Û, and low angle grain boundaries (LAGBs-subgrains) were considered as grain boundaries having misorientation between 2Û to 15 Û.
RESULTS AND DISCUSSION
In-process (grain) size effect
As can be seen in Table 1, there is a good range of grain sizes for investigation. The mean grain size for each annealing condition could be found by multiplying the strip thickness to the mean number of grains over the thickness. The 2.5 mm strips were used to study the grain size effect, while the 0.5 mm strip with coarse grains was used to investigate the grain-specimen size effects.
TABLE 1. Mean number of grains over the thickness of different strip thicknesses annealed at different temperatures for 1 hr. Annealing temp.(˚C)
Strip thickness (mm) As-received 400 800
2.5 (thick) 180 45 23
0.5 (thin) 36 9 4.5
It was found that the initial grain size had negligible effect on the maximum force required for micro-deformation, but it affected the deformation energy (Fig. 1); i.e. by increasing the initial grain size, the required forming energy (area under the curve) was decreased. Important to note that the load-displacement curve for the as-received material is only shown for reference and not for comparison. In addition, the grain size of the produced pins were different from the grain size of the initial strips, as will be discussed in the coming sections (Table 1 and Table 2 respectively). The same trend was seen for the thinner strips; the maximum required force was almost the same (i.e. 25 kN). This is due to the fact that the majority of metal forming occurs at the last stage of the process (i.e. forward extrusion) 8.
Figure 2 proves this fact again by comparing the pin height produced using thick and thin initial strips. This figure implies that more than 70% of the pin was formed during the last 0.5 mm thickness. This fact has been used before for process optimization 9.
FIGURE 1. Load-Stroke curve for pin forming using strips annealed at different temperatures for 1 hr (For 0.3 mm pins manufactured from the 2.5 mm thick strips).
FIGURE 2. The effect of grain size on the final part dimensions (For the 0.3 mm pin manufactured from 2.5 mm and 0.5 mm strips).
difference between the flow stress of the as-received and 800°C results, which is attributed to the Hall-Petch relation10.
Such a result indicates no size effects with regards to the mechanical properties of the pins, under these circumstances.
FIGURE 3. The effect of post-production recovery annealing (RA) on the average flow stress curves of 0.3 mm micro-pins manufactured from the strips annealed at different temperatures.
Mechanical response of the RA micro-pins, however, showed a different behavior as plotted in Fig. 3. A decline in the flow stress for each pin can be noticed, especially for the samples annealed at 800°C. The reason behind this behavior is related to the difference in dislocation annihilation in RA and as-deformed samples. More specifically, the RA samples have less dislocation density, and thus the work hardening behavior is different compared to the deformed samples.
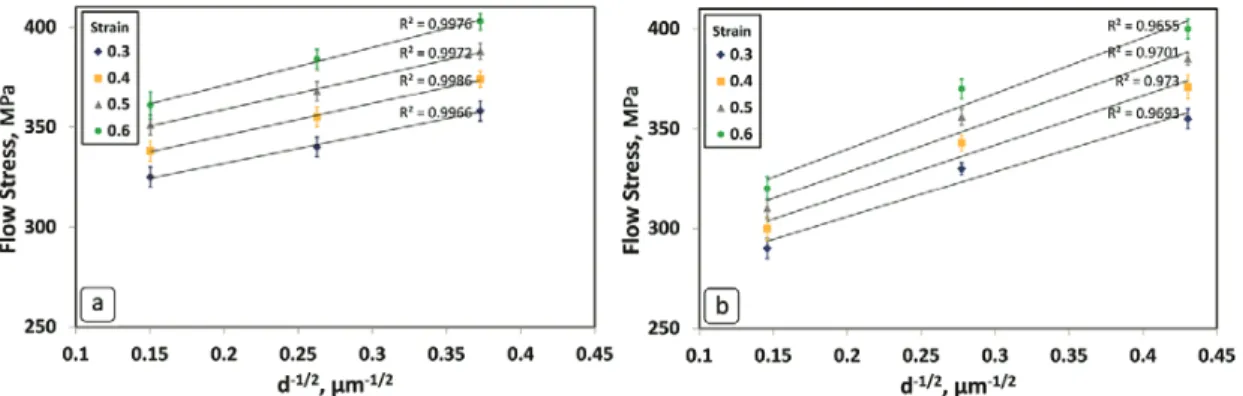
The consistency of the results with the Hall-Petch equation10 for the as-formed micro-pins is shown in Fig. 4, with
a linear relationship (with R2 value of nearly equal to unity) between the flow stress and the inverse square root of the
grain size. In comparison, for the RA micro-pins, since the number of subgrains across the diameter is below the critical value, size effect is more significant on the mechanical behavior (Fig. 3). This is shown quantitatively with the R2 values, which are relatively lower than those of Fig. 4.
In Hall-Petch relation, the strengthening coefficient of k, explains the significance of the role of the grain size on the overall mechanical properties. As can be interpreted from Fig. 4, recovery annealing leads to a relative increase in the k value, for the whole strain range. This indicates that removing the dislocation structure by recovery annealing increases the sensitivity of the mechanical properties on the grain size. In other words, in recovery annealed specimens, by increasing the grain size, there will be relatively more changes on the mechanical properties, compared to the as-deformed specimens.
FIGURE 4. Flow stress vs. grain size for different strain obtained from the micro-compression test of micro-pins with different grain sizes, under different post-production conditions of: (a) as-formed, without recovery annealing; (b) after recovery
annealing.
EBSD analysis
To justify the above-mentioned behavior, the substructure at the middle of both types of micro-pins was investigated using EBSD mapping (Fig. 5). The main purpose for such analysis was to compare the micro- and sub-structural dimensions quantitatively.
FIGURE 5. Inverse Pole Figure (IPF) maps obtained from half cross section of the 0.3 mm micro-pins manufactured from as-received strips with two post-production conditions: (a) without RA; (b) with RA; produced from the as-as-received 2.5 mm strip.
TABLE 2. Mean grain size, subgrain size, and number of grains and subgrains across the diameter of the 0.3 mm micropin manufactured under different pre- and post-production annealing conditions; produced from the 2.5 mm strip.
Pre-production annealing condition
Mean grain size (μm) Mean subgrain size (μm) NG NSG
With RA Without RA With RA Without RA With RA Without RA With RA Without RA As-Received 5.4 ± 1.3 7.2 ± 2.1 4.3 ± 1.0 0.8 ± 0.2 56 42 70 375 400°C 13.0 ± 4.1 14.5 ± 3.4 11.3 ± 2.1 0.9 ± 0.3 23 21 27 333 800°C 47.0 ± 7.3 44.3 ± 6.7 38.2 ± 5.0 1.5 ± 0.4 6 7 8 200
* RA: Post-production recovery annealing at 230°C. ** N
G and NSG are the number of grains and number of subgrains over the micro-pin's diameter, respectively.
The same measurement was done for all samples, and the results is presented in Table 2. As reported by Keller et al. 11, the size effect would be only obvious if the number of grains over the cross-section of the metal goes below the
critical number, which is around 6 for copper 12.
As shown in Table 2, the number of grains over the diameter of the micro-pin (NG= Pin diameter over grain size) decreases down to below the critical value for the copper in both cases of the RA and as-formed micro-pins. However, in the as-formed micro-pins (without RA), since the number of subgrains over the diameter (NSG) is relatively higher than the critical value, no size effect has been seen. In comparison, for the RA micro-pins, since the number of subgrains across the diameter is below the critical value, size effect is more significant on the mechanical behavior (Fig. 4).
This implies the importance of the number of subgrains rather than grains over the cross-section of the component for determining the size effect on mechanical behavior, which has not been addressed in literature by now. It can be also a reason for contradicting reports on size effects in the literature 13.
CONCLUSIONS
With respect to the in-process mechanical response of the metal and also the final part dimensions, extrusion processes can be introduced as processes which are not very sensitive to the grain size effect. This is another remarkable advantage of this technique compared to existing microforming processes, making this process more suited to be used for mass production.
Examining the post-production size effects, it was shown that decreasing the number of grains over the pin diameter will not always cause a size effect on post-production mechanical behavior. Instead, the relative substructural dimensions must be considered. In this case, recovery annealing in coarse grained micro-parts caused a deviation from the Hall-Petch equation in studying the mechanical properties, due to the coarsening of subgrain dimensions.
ACKNOWLEDGEMENTS
Authors would like to express their gratitude to Singapore Institute of Manufacturing (SIMTech) as well as Agency for Science, Technology and Research (A*STAR) in Singapore for financial and technical supports.
REFERENCES
1. W. Chan and M. Fu, The International Journal of Advanced Manufacturing Technology 62, 989-1000 (2012). 2. J. Q. Ran, M. W. Fu and W. L. Chan, International Journal of Plasticity 41 (0), 65-81 (2013).
3. E. Hug and C. Keller, Metallurgical and Materials Transactions A 41 (10), 2498-2506 (2010). 4. J. S. Stölken and A. G. Evans, Acta Materialia 46 (14), 5109-5115 (1998).
5. H. Hahn, P. Mondal and K. A. Padmanabhan, Nanostructured Materials 9, 4 (1997). 6. H. Hahn and K. A. Padmanabhan, Philosophical Magazine Part B 76 (4), 559-571 (1997).
7. E. Ghassemali, M.-J. Tan, A. W. Jarfors and S. C. V. Lim, The International Journal of Advanced Manufacturing Technology 66 (5-8), 611-621 (2013).
8. E. Ghassemali, A. Jarfors, M.-J. Tan and S. Lim, International Journal of Material Forming 6 (1), 65-74 (2013).
9. E. Ghassemali, M.-J. Tan, A. E. W. Jarfors and S. C. V. Lim, International Journal of Mechanical Sciences
71 (0), 58-67 (2013).
10. N. J. Petch, Journal of the Iron and Steel Institute 174 (1), 25-28 (1953).
11. C. Keller, E. Hug and X. Feaugas, International Journal of Plasticity 27 (4), 635-654 (2011).
12. J. J. Gracio, J. V. Fernandes and J. H. Schmitt, Materials Science and Engineering: A 118 (0), 97-105 (1989). 13. U. Engel, A. Rosochowski, S. Geißdörfer and L. Olejnik, in Advances in Material Forming (Springer Paris, 2007), pp. 99-124.