Inventory Management in Reverse
Logistics in FAW Co., Ltd
KPP231 Master Thesis Work, Innovative Production
30 credits, D-level
Master Thesis Programme
Product and Process Development - Production and Logistics
Author
Siying Sun
Commissioned by: Mälardalen University Tutor (university): Marcus Bjelkemyr Examiner: Sabah Audo
2
Abstract
Recycling and remanufacturing returned goods are economically beneficial for companies since the cost of obtaining used parts is lower in many cases and selling price is close to that of a new product. This leads to decreased costs and thereby increased profits for the company. In addition, there are also great environmental benefits by keeping the structural integrity of a part; the energy used for disassembly and refurbishing is much lower than the energy required for raw material extraction and machining. Encompassing the returned goods makes the supply chain to closed loop supply chain, which is different from the traditional supply chain due to reverse logistics. A reverse flow of material is however usually more complex than a forward flow of parts and components from suppliers. This means that inventory management becomes critical and needs to be viewed from a new perspective.
The purpose of the report is to study FAW Co., Ltd’s inventory situation in reverse logistics. The report analysed the inventory management in the company, specifically focusing on one product as the instance Motor Engine LFTS-2000since it is in the maturity stage of product life cycle. Two scenarios were designed to consider how different parameters affect inventory levels in reverse logistics.
The report analysed how different parameters affect the inventory levels and minimum cost. With the increasing returned goods are processed, inventory levels and minimum cost will decrease correspondingly.
Acknowledgements
First of all, I would like to express my appreciation to my supervisor Marcus Bjelkemyr for his support and guidance. His suggestions and guidance help me to complete the thesis project.
Furthermore I would like to thank those respondents in all the interviews for their time. Without their opening information and answers, it would not be possible to obtain the proper results for the analysis.
Lastly, my special thanks go to Malardalens University for giving me the opportunity to start this thesis project. And I gained a lot of valuable knowledge and experiences through my time in Malardalens University.
4
Contents
Abstract ... 2 Acknowledgements ... 3 1 Introduction ... 8 1.1 Background ... 8 1.2 Objective ... 11 1.3 Research Questions ... 12 1.4 Project limitations ... 121.5 Structure of the report ... 12
2 Research Design and Methodology ... 14
2.1 Literature Review... 14
2.2 Data Collection ... 14
3 Theoretical Frameworks ... 16
3.1 Closed Loop Supply Chain ... 16
3.1 .1Forward Supply Chain ... 16
3.1.2 Reverse Supply chain ... 16
3.1.3 Closed Loop Supply Chain ... 16
3.2 Reverse Logistics ... 18
3.2.1 The Definitions ... 18
3.2.2 Dimensions of Reverse Logistics... 19
3.2.3 Reverse Logistics Activities ... 21
3.3 Inventory Management in Reverse Logistics ... 23
3.3.1 The definitions of Inventory ... 23
3.3.2 Objectives of Inventory Control ... 24
3.3.2 Factors Affecting Inventory Control ... 25
3.4 Inventory Control in Reverse Logistics ... 28
4 Empirical Findings ... 30
4.1 General Information ... 30
4.2 FAW Car Company’s Forward Supply Chain ... 30
4.2.1 Procurement ... 30
4.2.2 Suppliers ... 31
4.2.3 Production Line ... 32
4.3 FAW Car Co’s Reverse Logistics ... 34
4.4 Inventory in FAW Car Co... 35
4.4.1 Inventory System ... 35
4.4.2 Inventory Management in FAW Car Co. ... 36
5 Analysis... 41
5.1 Inventory Management if Products Return Rate is Stable ... 41
5.1. Notation and Assumptions ... 41
5.1.2 Mathematical Formulation ... 42
5.1.3 Case Study ... 46
5.2 Inventory Management if Products Return Rate Is Not Stable... 47
5.2.2 Mathematical Formulation ... 48
5.2.3 Case Study ... 54
6 Conclusions ... 57
6
List of Figures
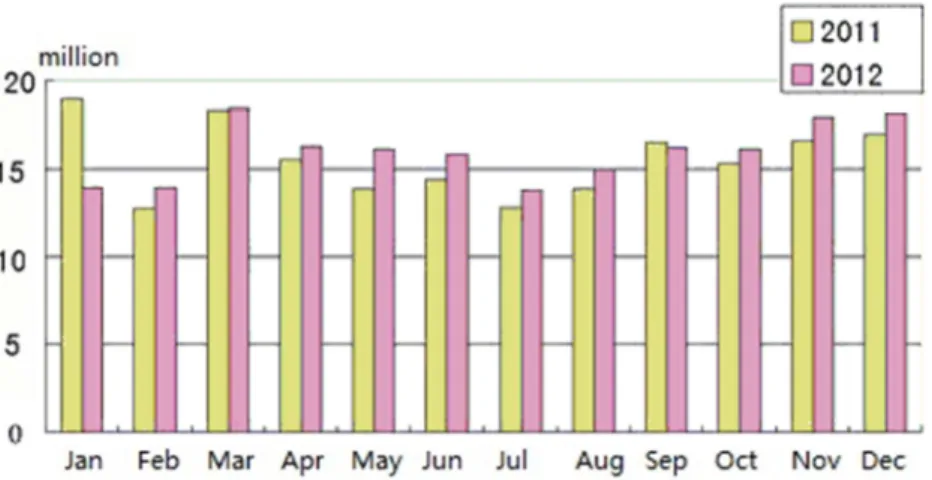
Figure 1 Output of Automobile in China (CAAM, 2013) ... 9
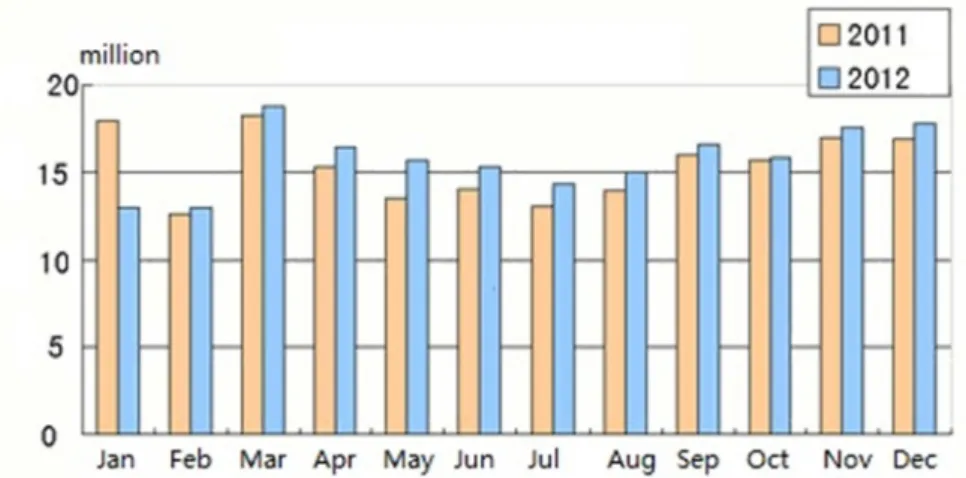
Figure 2 Sales of Automobile in China (CAAM, 2013) ... 10
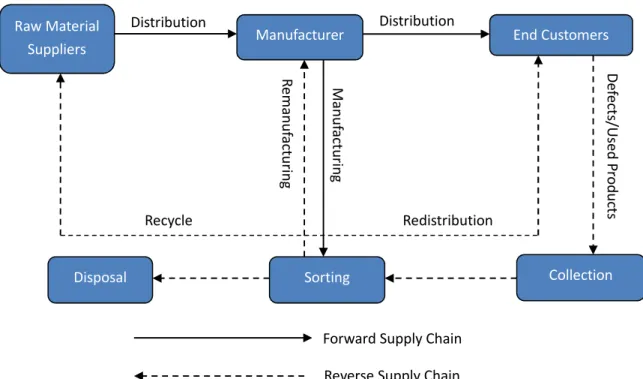
Figure 3 Closed Loop Supply Chain’s Structure ... 17
Figure 4 Reverse Logistic Within One Portion of a Typical Supply Chain (Stock, 2001) this figure is original from the book ... 19
Figure 5 Flow Diagram of Reverse Logistics Activities (Srivastava et al., 2006) 22 Figure 6 Waste Hierarchy ... 23
Figure 7 Different Types of Demand ... 26
Figure 8 Hybrid System I will delete this figure... 29
Figure 9 Purchasing Process Chart ... 31
Figure 10 Forward Supply Chain in FAW Car Co. ... 31
Figure 11 Milk Run ... 32
Figure 12 Production Line Systems ... 33
Figure 13 The locations of logistics centres ... 34
Figure 14 The Process of Reverse Logistics in FAW Car Co. ... 35
Figure 15 Inventory System ... 36
Figure 16 Inventory System ... 37
Figure 17 The Inventory Level of Available items ... 42
Figure 18 How products return rate affects inventory level ... 47
Figure 19 How products return rate affects minimum cost ... 47
Figure 20 The Inventory Level of Available items ... 49
Figure 21 The Inventory Level of Returned Items ... 49
Figure 22 How λ affects inventory levels ... 54
Figure 23 How λ affects minimum cost ... 55
Figure 24 How λ affects cycle time of remanufacturing and numbers of remanufacturing ... 55
List of Tabels
Table 1 International Car Sales Outlook (millions of units) ... 9Table 2 Main Business Situation and Main Products Situation in the first half year of 2012 ... 11
Table 3 The Situation of Group A, B and C in inventory ... 38
List of Equations
Equation 1 ... 43 InT = Qm − λDnT + rλDnT = 0 Equation 2 ... 43 n = (1 − )λ Equation 3 ... 43 = hs[QmnT − 12λDn2T2 + n(n + 1)2rλDT2] Equation 4 ... 43 C , T, n = ℎ − 12 + + 12 + 12ℎ + ! " + ! + ! " + ! Equation 5 ... 43 Equation 6 ... 44 Equation 7 ... 44 Equation 8 ... 44 Equation 9 ... 44 Equation 10 ... 44 Equation 11 ... 45 Equation 12 ... 45 Equation 13 ... 45 Equation 14 ... 49 Equation 15 ... 50 Equation 16 ... 50 Equation 17 ... 50 Equation 18 ... 50 Equation 19 ... 51 Equation 20 ... 51 Equation 21 ... 51 Equation 22 ... 51 Equation 23 ... 52 Equation 24 ... 52 Equation 25 ... 52 Equation 26 ... 52 Equation 27 ... 53 Equation 28 ... 53 Equation 29 ... 538
1 Introduction
1.1 Background
From the table below, Asia shows the strongest advance in car sales. Since 2010 Asia’s car sales have approximately 40% proportion of global market, and Chinese car sales reaches over 40% of Asia’s market. In North American market, Mexico becomes the significant factor to revival the market. There is a rapid growth of demand for crossover utility vehicles in Canadian market (Global Auto Report, 2013).
1990-99 2000-09 2010 2011 2012 Total Sales 39.2 49.64 56.82 58.89 62.45 North America 16.36 18.38 13.96 15.22 17.07 Canada 1.27 1.59 1.56 1.59 1.68 United States 14.55 15.79 11.55 12.73 14.40 Mexico 0.54 1.00 0.85 0.90 0.99 Western Europe 13.11 14.39 12.98 12.80 11.76 Germany 3.57 3.33 2.92 3.17 3.08 Eastern Europe 1.18 2.71 3.14 3.90 4.14 Russia 0.78 1.53 1.91 2.65 2.93 Asia 6.91 11.64 22.47 22.50 24.76 China 0.43 3.56 9.41 10.04 10.68 India 0.31 0.89 1.87 1.95 2.02 South America 1.64 2.52 4.27 4.47 4.72 Brazil 0.94 1.57 2.69 2.64 2.84
Table 1 International Car Sales Outlook (millions of units)
China has been the largest market of automotive since 2008 and became the second largest producer since 2008. As Figure 1 illustrated, China automobile production reached 19,271,800 units in the first half year of 2012 which had a growth of 4.63% compared with the same period of 2011. Production of passenger cars increased to 15,523,700 units by 7.17%; the output of commercial vehicle fell to 3,748,100 units by 4.71% compared with the same period of last year. On the other hand, Chinese automobile sold 19,306,400 units which had a growth of 4.33% compared with the last year as Figure 2 shown. Passenger car sales reached 15,495,200 units increased 7.07%; commercial vehicle sales reached 3,811,200 units decreased 5.49% compared with the last year. However the automobile companies of Chinese brands lost a little market share compared with the same period of last year although sales amount had some growth in 2012. For instance, the market share of passenger cars decreased 0.38% year on year, and commercial vehicles decreased 0.72% of market share compared with the last year. Furthermore CAAM forecasted the demand for vehicles was approximately 20,800,000 units and automobile production would be approximately 18,300,000 units in 2013 which would surpass European Union and provide 24% supply of vehicles worldwide (CAAM, 2013).
10
Figure 2 Sales of Automobile in China (CAAM, 2013)
Some big companies such as GE, IBM and 3M have developed a mature system of reverse logistics. They collect and recycle the returned goods for decreasing the loss generated by the return policy. Philips reduced the returned products by over 500,000 units and saved billions dollars through enhancing the management of returned goods since 1998. HP and Epson produced the cartridges which can be refilled. After Volvo disassembled the returned goods, some plastic and metal are sold, while some components were remanufactured for assembling the vehicles for secondary market. In China, reverse logistics has grew rapidly. Shanghai Baosteel recycled the disposal steel. Lenovo cooperated with APLL logistics for recalling and handling the returned goods.
First Automobile Works (FAW) founded in 1956 and locates in Changchun. In 1956, they produced the first truck in China, and in 1958 they produced the first passenger car and the first limo. Now they are one of largest automobile companies in China. FAW production sales exceeded 2,600,000 units in 2011 while production sales reached 2,645,000 which were almost flat compared with the last year.
FAW Car Co., Ltd is a subsidiary of First Auto Works and also a major company to develop its own-branded business. The company is responsible for development, manufacturing and sales of cars and their auto parts. FAW Car Co., Ltd founded on Jun.10, 1997 in Changchun, China, and went public on Shenzhen Stock Exchange on Jun.18, 1997. The registered capital of the company is 230 million dollars and the total assets are approximately 2.3 billion dollars. The company covers 3.17 million square meters and has 11701 employees. Current annual manufacturing capacity is 400,000 cars, 330,000 automotive engines and 520,000 automobile gearboxes. The company has the following major brands: Red Flag limousine, Besturn, Oley and so on.
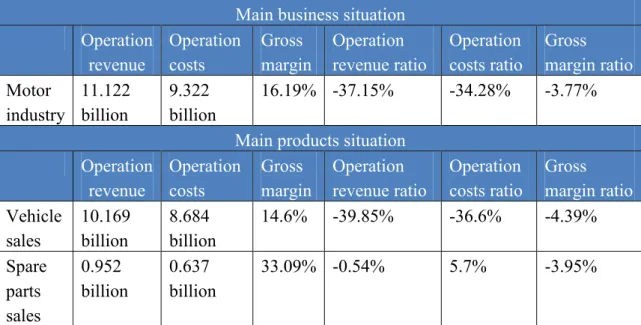
From Table 2 shown, operation revenue and gross margin both reduced in the first half year of 2012 due to strong business competition in Chinese vehicle market, weak customer demand, low growth of market and decrease of sales amount and price.
Engine & Transmission manufacturing centre of FAW Car Co., Ltd. founded on Aug.17.2012, which covers 0.63 million square metres and has 2120 employees. The company is responsible for production management, production preparation, manufacturing and sales of automotive engines and automobile gearboxes. It has manufactured over 1.3 million automotive engines and over 3.5 million automobile gearboxes so far.
Main business situation Operation revenue Operation costs Gross margin Operation revenue ratio Operation costs ratio Gross margin ratio Motor industry 11.122 billion 9.322 billion 16.19% -37.15% -34.28% -3.77%
Main products situation Operation revenue Operation costs Gross margin Operation revenue ratio Operation costs ratio Gross margin ratio Vehicle sales 10.169 billion 8.684 billion 14.6% -39.85% -36.6% -4.39% Spare parts sales 0.952 billion 0.637 billion 33.09% -0.54% 5.7% -3.95%
Table 2 Main Business Situation and Main Products Situation in the first half year of 2012
With the rapid development of automotive industry in China, reverse logistics attracts increasing attentions since it is beneficial for reducing cost for manufacturers and preserving the environment by increasing utilization of used products and parts. The Society of Motor Manufacturers and Traders suggested that sustainable development should be the ultimate goal of automobile companies in future (SMMT, 2001). The public also think the social responsibilities of companies include environmental responsibilities (SEITZ, 2003).
1.2 Objective
When products are in maturity of life cycle, their demand is relatively stable in the market and approximate to be represented by a constant. The constant can be predicted using historical information. Therefore manufacturers can use Economic Order Quantity model and its extended models to solve the problems regarding
12
inventory control. However in the reverse logistics case, the classical EOQ models cannot be applied on this problem due to the three following reasons. Firstly, the returned products and parts also have opportunity to be remanufactured to be good products to sell. Secondly the trade-off cost and inventory holding cost differ compared with the classical supply chain. Lastly, the cost changes due to where returned items are stored (Richter & Dobos, 2003). That is why a new model is needed to solve the problem of inventory control in reverse logistics. The objective in this report is to find the optimal inventory strategy compared with two situations: products return rate is stable and unstable.
1.3 Research Questions
This report aims to set up a mathematical model to describe the inventory control in reverse logistics in FAW Car Co., Ltd, and to discuss the difference of inventory strategies depend on whether the products return rate is stable. One type of auto engines is chosen as a test case for the study to find the optimal model for solving problems regarding inventory control in reverse logistics. The report designed two scenarios: one where the product’s return rate is stable and the other one where the rate is unstable. After applying the model in the two scenarios, the paper will assess the difference between the two results and why they differ. This assessment will be used to find the optimal solution, which can be applied in practice.
1.4 Project limitations
The models in the report are only applied under the condition of single cycle, which means the situation of multiple cycles is not considered. Multiple cycles are more common in practice, which requires order repeatedly and nonstop replenishment of inventory. Furthermore when setting up the model, lead time is not considered, and that means the lead time of manufacturing and remanufacturing the products is zero. Because inventory cost varies with the increase of the lead time, and this variation is unstable. The disposal of the returned parts and stock out are not considered either. Waste disposal reduces the utilization rate of returned parts and products, and if there is stock out, the inventory is not continuous any more. Lastly the report only researched the products which are in the maturity stage of life cycle since the demand is stable and predicted.
1.5 Structure of the report
Chapter 1 is the introduction of the report, which describes the outline of the report including background, objective, research questions, project limitations and structure of the report. Chapter 2 explains the methodology used in the report and addresses what is the approach for delivering the outcome. Chapter 3 introduces the theoretical framework of the report. Theoretical framework is the basis of the research since it
summarizes the past efforts and gives a comprehensive understanding of reverse logistics and inventory control. Chapter 4 explains the situation of inventory control and reverse logistics in FAW Car Co., Ltd. Chapter 5 analyse the data and information collected from Chapter 4. Two scenarios are designed to analyse the change of inventory levels and minimum cost depend on different parameters. Chapter 6 gives a conclusion of the report.
14
2 Research Design and Methodology
This report studies the inventory control in reverse logistics in FAW Car Co, Ltd. It is on the basis of literature review, interviews and case study.
2.1 Literature Review
Literature review is reading and evaluating the published articles, journals, books, reports and so on, which summarizes past efforts and gives insight and outsight of understanding inventory control in reverse logistics (Tranfield et al., 2003). A comprehensive understanding of topic is the basis of the research. Literature review combines rigour evidence regarding the research problem and provide a systematic understanding. Besides literature review is necessary to establish the problem and identify the connections with theory and practice. With the explosive growth of information, it is important to distinguish what has been done and what needs to be done. Furthermore a new perspective also can help the researchers to do an excellent research. With the literature review, the researchers can find what problem they interest in and identify the explicit purpose, which is critical to the research.
Numerous researchers do the research on closed supply chain and reverse logistics, but there is only a few to distinguish one from the other, which means there is no absolute difference between them. Meantime the researches regarding inventory strategies are in the maturity stage since inventory attracts a lot of attention from last century. In general the objectives of inventory management are to decrease the cost and increase the profit, and furthermore the efficient way to manage inventory is controlling the factors that affects inventory. Inventory management in reverse logistics is different from in traditional supply chain due to the returned parts and products.
In order to do a profound literature review, the sources of literature are involved with the books, journals and conference reports which are from Google Scholar, IEEE Xplore and MDH library. The key words when doing the research are primarily reverse logistics, EOQ, and inventory control.
2.2 Data Collection
The choice for the methods of data collection depends on the parameters to be measured, the source and the resources. The basic information and data regarding the company is collected from the annual statement since FAW is a public company. But the primary information which are used for models is gathered from interview the managers and observation of the workshop. Comparing with the secondary information, the primary information is new and reliable. The report takes open interviews instead of questionnaires. The open interviews are freer than
questionnaires and the important points are noted when talking for further analysis. In some cases, it is hard to organize and catch the key, but it is easy to find some problems not expected sometimes.
The managers and employees of Production Department and Logistics Department are interviewed about how is the reverse logistics and inventory management in FAW Co., Ltd, what are the issues in the inventory management and what are their opinions about inventory management in reverse logistics. After organizing the gathered information, the important parameters are picked up for setting up the models.
16
3 Theoretical Frameworks
This chapter introduces the theoretical framework in the report, and provide a knowledge regarding closed loop supply chain, reverse logistics and inventory management.
3.1 Closed Loop Supply Chain
Closed loop supply chain attracts increasingly attention due to the importance of remanufacturing the used products (Savaskan et al., 2004). Closed loop supply chain is a system creates large value. It saves cost and increases the profit for the company, while preserves the environment compared with the forward supply chain (Guide et al., 2003).
3.1 .1Forward Supply Chain
Forward supply chain is the process of implementing and controlling information and cash flows from purchasing raw materials, manufacturing intermediate goods and finished goods to deliver the products to customers through the selling network. It involves all parties for meeting customer requirements including manufacturing, transportation, distribution, sellers and supply chain management, which is also involved with all functions, such as raw material suppliers, manufacturer, warehouses, distribution centre and retailers. (Chopra et al., 2004)
3.1.2 Reverse Supply chain
Reverse supply chain is a newly subject from legal drives. Increasing governments require companies take responsibilities for dealing with the used product and components in order to preserve environment (Schultmann et al., 2004). There is no identical definition. Some authors think reverse supply chain is moving goods from customers for reusing or remanufacturing for capturing value or proper disposal. And some others advocate reverse supply chain is the process of moving goods from their typical final destination for the purpose of capturing value, or proper disposal. Remanufacturing and refurbishing activities also may be included in the definition of reverse logistics. On the other hand, in some areas it is also called reverse flow logistics, reverse distribution, closed loop supply chain systems and supply loops. In fact, there are not too many differences among all the kinds of the definitions since they are just defined according to the different subjects (Srikanth et al., 2006). Overall reverse supply chain is management of the returned goods.
3.1.3 Closed Loop Supply Chain
Closed loop supply chain is not only a simple combination of forward supply chain and reverse supply chain, which means it has its unique structure differs with the other types of supply chains. Except for the traditional supply chain’s functions, closed loop supply chain encompasses a set of activities: “production acquisition,
reverse logistics, test, sort and grade, remanufacturing/reconditioning and distribution and selling” (Guide et al., 2002). As shown in Figure 3, the forward supply chain is the traditional supply chain concerns the flow of products from the raw materials suppliers, manufacturer to the end customers. The reverse supply chain is caused by returns or recycles, and the end customers acts as suppliers in the reverse supply chain. After sorting out the collected products, the products can be reused will be moved to end customers through manufacturing and distribution. Defects and used or waste products are moving to manufacturer for reusing or remanufacturing or disposed after testing and sorting (Guide et al., 2002).
Figure 3 Closed Loop Supply Chain’s Structure
In 2006, Guide and Van Wassenhove defined closed loop supply chain as “the design, control, and operation of a system to maximize value creation over the entire life cycle of a product with the dynamic recovery of value from different types and volumes of returns over time” (Guide and Wassenhove 2006). The definition has full understanding of supply chain management and evolves from the narrow understanding to a comprehensive understanding involved with remanufacturing (Atasu et al., 2009). Remanufacturing is the process of disassembly and recovery of used components and products to like-new quality standards and return them to market, so remanufacturing becomes the foundation of closed supply chain (Guide et al., 2000).
From the traditional view on closed loop supply chain, the major differences between forward supply chain and reverse supply chain is the different role of customers act. The customers are the ending in forward supply chain and act as suppliers of cores to the remanufacturing company and the beginning in reverse supply chain. Closed loop
Redistribution D e fe ct s/ U se d P ro d u ct s M a n u fa ct u rin g Recycle R e m a n u fa ct u rin g Distribution Distribution Raw Material
Suppliers Manufacturer End Customers
Disposal Sorting Collection
Forward Supply Chain
18
supply chain is closed by remanufacturing (Krikke et al., 2004). However the customers are not only those simple roles and also they can be junk yards, brokers and even incurrence companies. It is important how to use the end customers serve in closed loop supply chain. Besides, evaluating the numbers and timing of returns and the quality of the used parts can also help the remanufacturer to improve reverse supply chain. So it is a challenge how to manage the relationships with suppliers and customers. The good relationships and communication with suppliers and customers provide the quick and accurate information to help manufacturer and remanufacture to increase response time and reduce cost for satisfying the customer demands better. The relationships encompass “ownership-based, service-contract, direct-order, deposit-based, credit-based, buy-back and voluntary-based”. (Östlin et al., 2008)
Closed loop supply chain has high uncertainty because of reverse supply chain. In the reverse supply chain, it is uncertain with timing and quality of returned goods, what materials can be recovered and the demand of customer (Kumar et al., 2006). All of these factors have the obvious impact on demand management, inventory control and supply chain management. On the contrary, the forward supply chain does not have so much uncertainty, so the customer demand is clear and certain in normal case. In addition, reverse supply chain usually occurs when there are some problems with the products qualities or quantities since it is involved with remanufacturing the used product or parts. Therefore planning, implementing and controlling of reverse supply chain are quite complex (Karen et al., 2006). Besides, in most cases, the demands of collecting, inspecting and remanufacturing the used products and parts cannot meet the customer demands.
3.2 Reverse Logistics
3.2.1 The Definitions
James R Stock pointed out reverse logistics including returns, materials substitution, reused, disposal, recycles, maintenance and remanufacturing (Stock, 1992). In 1998, he elaborated reverse logistics as
“... the term most often used to refer to the role of logistics in product returns,
source reduction, recycling, materials substitution, reuse of materials, waste disposal, and refurbishing, repair and remanufacturing.” (Stock, 1998)
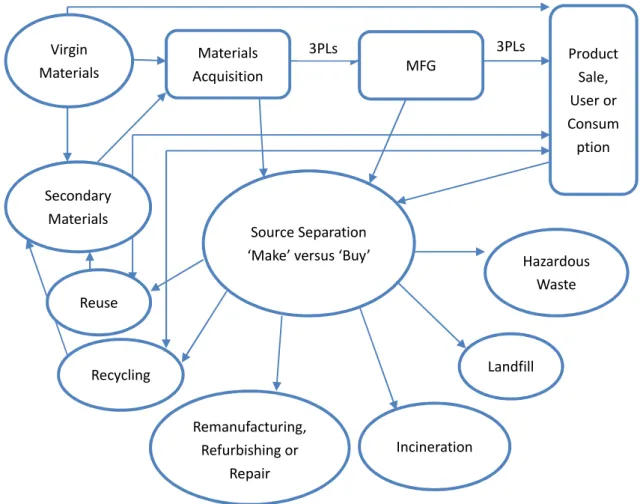
In the above definition, Stock summarized most activities and functions of logistics in reverse logistics. Figure 4 illustrates the flow of major activities in reverse logistics.
Figure 4 Reverse Logistic Within One Portion of a Typical Supply Chain (Stock, 2001) this figure is original from the book
3.2.2 Dimensions of Reverse Logistics
In the past decades, “Cradle-to-Cradle” is proposed as an ideal and radical concept emphasizes on recycling products and materials without quality deterioration. Reverse logistics is the process that companies produce new products using the used products, which is alike with “Cradle-to-Cradle” (Wiel et al., 2012). Reverse logistics can be classified as motivation, types of recovered items, return loop and types of sources of reverse logistics.
From environmental motivation, many governments issued some directives to regulate that companies should recycle some used products and components or waste components produced when manufacturing for friendly eco. For example, Environmental Department in European Commission issued a waste management policy to enforce companies should recycle or reuse several specific waste during manufacturing (European Commission, 2012). USA issued the Environment Protection Regulations 2009 for allocating the responsibilities for industrial waste and improving resource efficiency (United States Environment Protection Agency, 2009). China also issued Regulations on Management to Recovery and Treatment Regulations on Management to Recovery and Treatment of Waste Electrical and Electronic Equipment in 2008. The regulations categorized the waste electrical
Virgin Materials MFG Product Sale, User or Consum ption Hazardous Waste Landfill Incineration Remanufacturing, Refurbishing or Repair Recycling Reuse Secondary Materials Materials Acquisition Source Separation ‘Make’ versus ‘Buy’
20
equipment and components, and emphasized the companies responsibilities (e Ministry of Environmental Protection, 2008). On the other hand, companies retrieve some used products or components for remanufacturing and reusing so as to reduce cost and regain value on the basis of economical motivation. The key of this approach is selection of the used products and components to capture the gap between new products and used ones (Fargher, 1996). The perfect combination with two motivations make companies to obtain value as much as possible and also reduce negative effect on the environment to zero.
According to the types of recovered items, they are categorized as low-value materials, high-value spare components, packages and consumer goods. Low-value materials such as leftover scrap metal can be resold as raw materials of other productions. The benefits for recycling and reusing high-value components such as circuit board make manufacturers retrieve these components for remanufacturing or reusing meanwhile through the reverse supply chain. Packaging including glass bottles, plastic package and pallets can be returned quickly once the contents are delivered. Consumer goods are usually returned at the end of life cycle, but with the development of technology, especially fast consumer goods are also returned since they are outdating. (Fleischmann et al., 1997)
King, A. M., et al. divided return loop as reuse, repair, recondition, recycle and remanufacture. Reuse is the most convenient approach in the above five approaches. For example, glass bottles can be used directly after cleaning. Repair is the most common approach to extend the product’s life. It just restored the damaged products to work well even with losing some quality (Fleischmann et al, 1997), which cannot compare with remanufacturing and reconditioning. In most cases, people stop using products for two reasons: “functional obsolescence or fashion obsolescence” (King et al., 2005). Functional obsolescence means products failed physically and need to repair. By contrast, products go out just because people do not like their appearances any more or products are outdating no matter on function or appearance. Reconditioning is the intermediate approach between repairing and remanufacturing, because it requires reconditioning the failed products to a work condition and is expected to be inferior of the new product. All major components that failed will be rebuilt even including some ones that owners do not notice. However it is still the old products that cannot compare with the new one. Therefore reconditioned products cannot go to market as new products, but they can be sold to low-income family and social service (Renew, 2004). Different from the other form of reuse, remanufacturing is the only process that remanufactured products can be back to the market as original equipment remanufacturer performance with equivalent warranty as new product. The reason is the used products that are brought to remanufacturing site after carrying out complete disassembly, overhaul and replacement operations (Fleischmann et al., 1997). Electro-mechanical and mechanical products use remanufacturing since they have high relatives with both the market value and their original cost when recovery (King et al., 2005). Remanufacturing attracts a number of attentions since its unique characteristic in the past years. Lastly, recycling is the most mature stage in the all
return loops. The used products’ structures are not conserved in the process of recycling compared with remanufacturing. Recycling aims at preventing waste of potentially useful materials. Some discarded products are returned as raw materials such as aluminiumstock out, which reduces efficiently waste and preserves the environment. However the quality of discarded products cannot be controlled which decrease the efficiency in some cases (Villalba et al., 2002).
Overall, reverse logistics encompasses two major products flow: returned products and waste materials. Waste material logistics is that the end customers return the used parts or products without value to the supplier, and collected, sorted, reprocessed, packaged, transported or stocked according to different requirements. Otherwise returns logistics encompasses repair of damaged products, returned products from customers due to complains, designs, sales problems and so on, and materials flows such as used packages and containers moved from customers to suppliers opposite to forward supply chain (Brook, 2001).
3.2.3 Reverse Logistics Activities
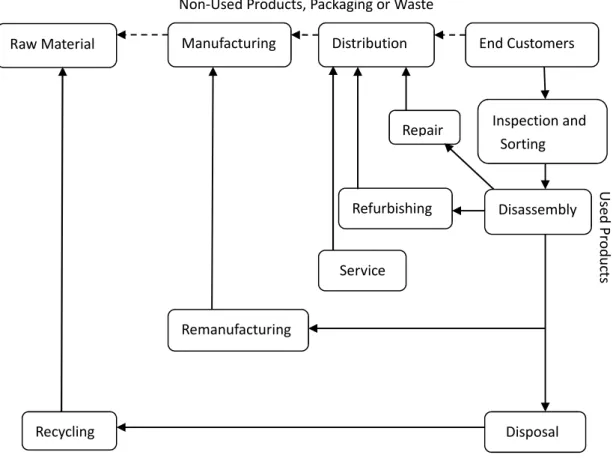
Figure 5 illustrates the basic flow of reverse logistic activities. Overall reverse logistics is a complicated process for increasing the value of products. Quantity, quality and time of arrivals of returns are all the parameters affect reverse logistics. Location of facilities should also be considered for reducing cost. (Srivastava et al., 2006)
Collection is the first and important step in reverse logistics, where products are sorted and collected according to the different types. Some of them, such as non-used products, packaging or waste may be transported to facilities for reusing or direct recovery, and some may be brought to the beginning of the supply chain for converging process. (Brook, 2001)
Inspection/testing and sorting may be implemented at the time of collection or afterwards. The quality of used products is uncertain, so inspection and sorting require skills based on used products conditions since sorting decisions affect remanufacturing cost (Srivastava, et al., 2006).
The products after inspection go to disassembly site where they are disassembled to used parts and non-used parts. Non-used parts with waste go to disposal site. Used parts are moved to remanufacturing site, repairing site or refurbishing site. After repairing and refurbishing process, these like-new products may go back to market or stocked as the part of inventory (Kim et al., 2006).
Some disposed products and components can be recycled for recovery and go back to supply chain as raw material again. The suppliers of disposed products and components are possible to be any nodes in supply chain, which means the products may be retrieved from customers, manufacturers and so on.
22
The used products or components which have no value or may pollute the environment should be disposed properly. Landfill and incineration are two major common methods of disposal, but they have possibility to pollute environment, mechanical treatments are the most common methods. Biological reprocess is eco-friendly method to decompose the organic matter through composting and digestion processes. Recycling used products reduce both costs for companies and effect on health and the environment (Brook, 2001).sorry, I didn’t find this book.
Figure 5 Flow Diagram of Reverse Logistics Activities (Srivastava et al., 2006)
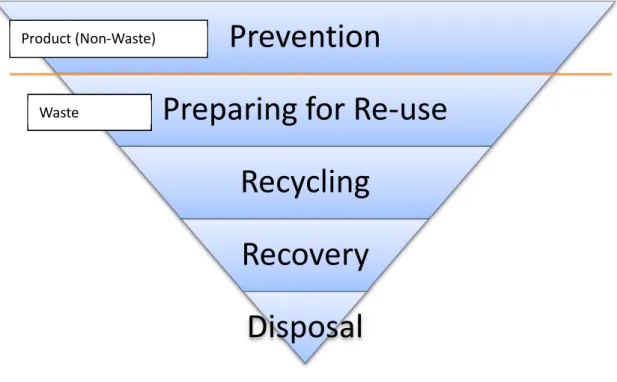
European Commission issued Directive 2008/98/EC which defined the basic concept related to waste management. The directive explains the waste hierarchy and hierarchy ranks waste management options in order that different sorts of waste can be treated by the most effective methods (Pricce el., at, 2000).
U se d P ro d u ct s
Non-Used Products, Packaging or Waste
Raw Material Manufacturing Distribution End Customers
Inspection and Sorting Disassembly Repair Refurbishing Remanufacturing Recycling Disposal Service
Figure 6 Waste Hierarchy
3.3 Inventory Management in Reverse Logistics
3.3.1 The definitions of Inventory
Inventory plays a necessary role in operations of economy. With increasing studies, a number of researchers find that inventory is the crucial factor to determine the total cost and deliver time. Muckstadt and Sapra (2010) stated that the definitions of inventory should be categorized by different types as following: “anticipation stock, cycle stock, safety stock, pipeline stock, and decoupling stock”. For meeting future demands, anticipation stocks are created by a firm to complete customers’ orders, but in some cases, anticipation stocks are also created due to scarcities of raw materials or an expected rise in price of market. Tersine and Richard (1998) say cycle stocks are created to meet customers’ demand because of the cycle of the incoming supply of inventory. Hartman and Media consider that cycle stock is to fulfil regular sales orders through a selling cycle. After selling some portion of items, cycle stock will be replenished by some new items to maintain certain quantity in case there is no enough stock to meet customer demand, and hence cycle stock is part of on-hand inventory. The main function of cycle stock is to prevent stock out. Stock out represents loss of sales and a failure of inventory management. It does not only bring out monetary failure, but it also causes dissatisfaction of customers and even loss of customers. However reckless increasing cycle stock will lead to rise of storage costs and shipping costs, which is also an outcome that company keeps avoiding in inventory management. Therefore many companies want to reduce cycle length in order to reduce cycle stock, but reducing cycle stock means the growth of the number of cycles, and meantime company also increases the possibility of stock out. In
Prevention
Preparing for Re-use
Recycling
Recovery
Disposal
Product (Non-Waste)
24
consequence, safety stock is carried to prevent undesirable stock out and sustain the service level for customers. Murray stated that safety stock is usually a tool to make sure companies have enough materials and items in storage for covering some unexpected and unforeseen accidents, such as fluctuating customer demand, damage in the warehouse, delay of shipping, quality issues found in production, forecast accuracy and variability in lead times (Murray, 2012). Some managers just use gut feeling or hunches to determine safety stock, which leads to poor performance. Kings (2011) considered that mathematical approaches could help companies to determine more accuracy safety stock, furthermore balance the contradiction of maximizing the service level and minimizing inventory cost. The ideal and perfect situation is zero-inventory. Zero-inventory represents completing customer requirements and also no inventory waste. Hann and Yamamoto (1999) found that if a company wanted to reach zero-inventory, it depended on supplier, technology, product and customer. When all these factors work well, it is possible to achieve to zero-inventory. Muckstadt and Sapra (2010) state that pipeline stock begins from the time when goods are ordered until goods are ready to be received by customers, which means goods in pipeline stock stay in company’s distribution chain. The quantity of pipeline stock is equal to expected demand over lead time times the length of lead time. Harris found that pipeline inventory is the solution for the poor performance because of lags between decisions and ramifications other than gut feeling and intuitive decisions of determining stock. When managers make decisions, they should consider not only future needs, but also what they received, which is called Little’s Law. Cachon and Terwiesch (2006) state that pipeline inventory always exists no matter how fast work on a flow unit. In addition, Little’s Law also shows the best way to reduce pipeline inventory is reducing flow time since reducing flow rate is not desirable. According to Cachon and Terwiesch, decoupling inventory is the inventory between process steps, and it is also known as buffer. For downstream, buffer acts a resource of supply comes from upstream, and it can absorb variations between process steps due to different flow rates. Insufficiency of buffers may result in disruption between process steps from upstream to downstream. In other words, decoupling stock is another form of safety stock for ensuring manufacturing process work smoothly and constantly. Furthermore buffer is also a way to prevent breakdowns.
3.3.2 Objectives of Inventory Control
Starr et al. (1962) claimed that inventory control was that companies determined inventory, lead time, quantity of order and so on based on customer demand and the goals of companies. If companies want to make inventory strategies, there are some problems to be solved such as how long to check quantity of stock, when to replenish stock, how many goods to be ordered and so on. Uncontrollable factors in inventory system are customer demand and order lead time, while controllable factors are order quantity and when to order. The aim of inventory control is ensuring continuity of supply chain and handling uncertainty of customer demand according to appropriate inventory strategies and methods of inventory control.
3.3.2 Factors Affecting Inventory Control Demand
Because demand is fluctuating and unstable, it is difficult to match demand (Cachon and Terwiesch, 2006). When demand occurs, warehouse should send some goods out, and hence demand is output of inventory system (Ehrhardt et al., 1987). Cachon and Terwiesch (2006) stated that in the short term inventory could be determined according to historical information or investigation and analysis based on sales in the market.
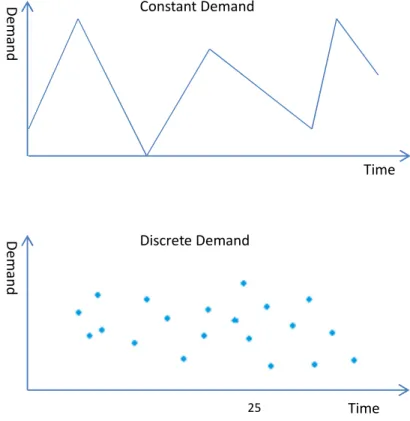
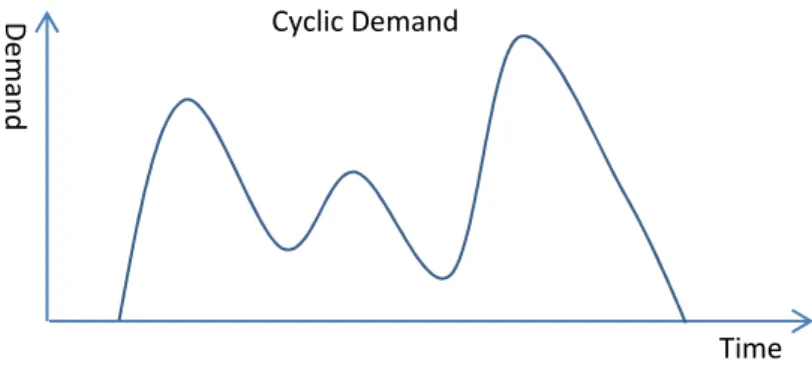
Figure 6 illustrates some types of demand. Among them, the most common type is constant demand. Warkertin et al. (2003) stated that the expansion of production with constant demand has no impact on costs and resource prices, even though demand is fluctuating in different stages of life cycle. On the other hand, the demand of products is discrete, not continuous. For example, a consumer decides which store to buy a refrigerator, a consumer decides which brand to buy, or a consumer decides which type of equipment to buy. All these choices are discrete and disordered (Hanneman, 1984). In addition, cyclic demand means some products’ demand is responsed to season or shows peak over time, such as air-conditioning (Haltiwanger et al., 1984).
Moreover there are deterministic demand and random demand according to demand quantity, demand rate and demand mode. Suvrajeet (1994) states that for deterministic demand, demand is usually viewed as constant, such as demand quantity for some type of component in assembly line in one working day. Random demand is unstable in terms of demand quantity since it is easier to be affected by some factors outside system. Time D e m a n d Constant Demand D e m a n d Discrete Demand
26
Figure 7 Different Types of Demand
Supply
The stock needs to be replenished time to time due to depleted items. In some cases suppliers or manufacturers, sometimes resellers or even distributors help buyers to determine inventory, which means vendors keep watch on buyers’ inventory levels and prepare resupply in advance, even before orders from buyers. That is called vendor-managed inventory. Therefore stock replenishment is controllable since vendors make their own decisions about order quantity, shipping and timing (Waller et al., 1999). Replenishment may be instantaneous or non-instantaneous. In contrast to traditional supply chain, information moved from downstream to upstream in vendor-managed inventory, which reduces carrying cost and minimizing stock out situations (Çetinkaya et al., 2000).
Cost
Too much inventory may increase inventory costs, while too little inventory may not fulfil customers demand. One of inventory objectives is obtaining appropriate quantity of materials, consuming goods and finished products in right place and right time. There are five types of inventory costs as following: unit cost, order cost, setup cost, holding cost and shortage cost.
Unit cost
Walters (2008) says unit cost is the price of one unit of items suppliers charge to buyers. In general, unit cost is total cost spent on purchasing divided by number of items, but in practice, it is difficult to gain the accurate unit cost because there are several suppliers to sell the goods at the same time or suppliers sell different goods in different conditions. However unit cost is useful since it provides the information from the perspective of cost. It helps companies to know the actual cost spent on the items and identify improving the cost effeteness.
Order cost
Order cost occurs when companies placing orders to suppliers. It includes a fixed cost and a variable cost. Fixed cost remains the same no matter how many orders to be placed. It usually involves with the cost of facilities and maintenance cost of the
Time D e m a n d Cyclic Demand
system related to process purchasing orders. In contrast, variable cost varies depended on the number of orders to be placed. It is important since it can show the actual cost spent on orders. It is involved with the whole process of placing orders including preparation of placing orders, creating orders, reviewing inventory levels, receiving orders, checking items when receiving them from suppliers and preparing and processing payments (Murray, 2012).
Setup cost
Setup cost in inventory occurs to get ready to process orders. It also encompasses two components: fixed cost and variable cost. Fixed cost includes the cost spent on equipment to manufacture products or disassembly used products for remanufacturing. On the other hand, variable cost includes personnel cost, material cost and so on (Business Maxims, 2011).
Holding cost
Holding cost represents the money of holding items in stock or holding inventory. it relates to quantity of inventory and is caused by logistics activities such as inventory control, package, disposal and so on. It is concerned with tied-up money, storage space, loss, handling, administration and insurance (Walters, 2008).
Shortage cost
Shortage cost occurs due to failure to meet customer demand and is not affected by the length of time that keep customer waiting (Petrovic et al., 1999). Walters (2008) states that shortage cost is not measured which means it is inherently inaccurate and misleading. Companies are willing to prevent potential shortage by carrying stock since shortage causes loss of customers and loss of future sales.
Approaches of reviewing inventory
There are two approaches to check inventory levels: periodic physical inventory and cycle counting.
Periodic physical inventory is the process of reviewing physical inventory of all items kept in stock at specific intervals during tax or calendar year. Tagaras et al. (2001) says that periodic physical inventory method is simple and effective to compute and implement to manage inventories due to uncertainty. REM (1998) states that this method requires plenty of manpower and should be conducted while business suspends operating.
Rossetti (2001) says that cycle counting method is a popular solution that allows company count a number of items kept in stock in some areas. It includes random sample cycle counting, ABC cycle counting and process control cycle counting. Random sample cycle counting reviews the random samples from the population of inventory instead of review all items kept in stock. ABC cycle counting method
28
categorizes the population of inventory as three levels according to Pareto principle. Process control cycle counting method picks up those items easy to count. This method is controversial in theory due to its biases.
3.4 Inventory Control in Reverse Logistics
The aim of reverse logistics is decreasing the inventory of returned products and parts as soon as possible and reducing the cost of inventory in reverse logistics through turning the returned products and parts to reusable products and parts which maximizes the values of returned parts and products. Therefore that decreases tied-up money on inventory of returned products and parts and retrieve the value of returned products and parts as soon as possible.
Compared with the traditional inventory system in supply chain, the most different thing is adding one extra supply resource to adding one reverse supply chain in reverse logistics. Inventory in reverse logistics becomes more complicated because of returned parts and products. The goods in stock does not only encompass new finished products and also returned products and parts. Therefore there are two kinds of supply resources which means returned parts and products can be regarded as supply resource except purchased parts and materials for manufacturing new products.
After collecting, inspecting and sorting the returned parts and products, those that cannot be reused will be disposed, and those that can be reused will be recycled or remanufactured for capturing value which means they will be sent to process as the form of supply resource.
The process of remanufacturing is commonly done by the original manufacturer since it requires the information of products structure and high techniques. In consequence, traditional process and remanufacturing process are combined to a hybrid system.
Outside supply of materials and parts
Manufacturing
Remanufacturing Inventory of returned
products and parts
Inventory of parts and materials
Figure 8 Hybrid System I will delete this figure
Collecting returned parts and products is driven by supply rather than market demand in forward supply chain, so it is not often controlled by the company. As a result, there is high uncertainty in quantity, time and quality of returned products and parts which is why inventory in reverse logistics is highly uncertain. For instance, the company is only passive to receive returned parts and products from customers other than collecting the returned parts and products initiatively. The ration of collecting some kind of parts is random. The quality of returned products and parts is unknown before inspecting which leads to uncertainty of lead time.
30
4 Empirical Findings
This chapter is the information collected from the interview, website and annual report related to FAW Co., Ltd. The data and information is also for further analysis.
4.1 General Information
The company pays more attention to reverse logistics than before, and it changes the logistics system several times for improving supply chain. However reverse logistics is still in the initial phase. The company is trying to establish a completed recycling system.
4.2 FAW Car Company’s Forward Supply Chain
4.2.1 Procurement
After receiving orders from customers, the company starts to do production planning according to customer demand. In FAW Car Corporation, they buy materials and components from overseas suppliers mostly in form of Completely Knocked Down. Overseas suppliers pack the components and materials in the distribution centre overseas after receiving orders from the company, and then components and materials are delivered to the company by trains or shipping. The most components and material come from Japan. There are around 1500 sorts of components and materials, and over 50% of them are in form of CKD.
Since the competition is increasing in automobile industry, the company should reduce the cost of purchasing materials and components for more profit. Therefore domestic procurement becomes more and more. The domestic suppliers of FAW Car Company are more than 70 and distributed in Tianjin, Changchun and so on.
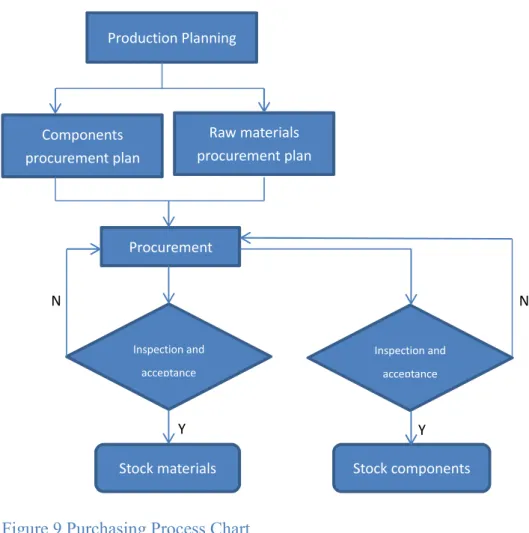
The inspection plays an important role after receiving components and materials since it determines the quality of products. If there are defected or disqualified components and materials, the company usually send them back to suppliers and reorder the components and materials they need. After inspection and acceptance, the components and materials will be in stock respectively.
Figure 9 Purchasing Process Chart
4.2.2 Suppliers
Figure 10 Forward Supply Chain in FAW Car Co.
The forward supply chain is divided to three parts as Figure 9 shown. The first part is supply. Specifically there are three types of supply as following: batch supply, sequential supply and milk run. Batch supply is the most common type, which means the suppliers deliver the materials to the manufacturers on the basis of orders.
N Y Y N Production Planning Components procurement plan Raw materials procurement plan Procurement Inspection and acceptance Stock materials Inspection and acceptance Stock components
32
Sequential supply means the suppliers deliver the materials to the manufacturers according to the production sequence on the assembly line, and hence sequential supply requires the accuracy of information for avoiding that the materials from suppliers cannot be used in production line. Furthermore, buffer is the essential solution for avoiding abnormal situation, such as delay of delivery and wrong materials. Milk run is a concept from Japan that is delivering the goods collected from multiple suppliers to the customers directly which means there is no handling in the process. In FAW Car Co, trucks transport goods to manufacturers after collecting the materials from suppliers according to schedules and routes, and then go back to suppliers for next around with the empty case, which formulates a circle as shown in Figure 10. Using milk run as the type of transportation, the company considers the distance among the suppliers, loading capacity of suppliers and the roads condition as the determined factors when they determine the routes of transportation. On the other hand, there are some suppliers far from the manufacturer, so the company sets up transit station for shortening cycle time, improving the ability to handle unforeseen circumstances, put the goods from different ways together and increasing loading capacity. Milk-run requires the cooperation with the suppliers and the departments in the company.
Figure 11 Milk Run
4.2.3 Production Line
The company has one production line including 9 machine lines and 3 assembly lines, which manufacture 3 different sorts of automotive engines. The production lines can manufacture different automotive engines according to customer demand, which increase the manufactures’ quick reaction capacity to market. Production line encompasses four parts: operators, objects, components and stations.
Collecting
Manufacurer Suppliers
Suppliers
Suppliers
Figure 12 Production Line Systems
As Figure 11 shown, production line is on the basis of equipment, and equipment is essential factor for completing logistics system and information flow. The equipment is functional entity which is able to complete assignments, such as machine tool and fixture. Logistics system is the movement of materials including raw materials, semi-finished goods and tools. In the process of manufacturing automotive engines from raw materials to finished products, there is only a small portion of time spent on assembly line, whereas the most time is spent on stock and transportation. Dispatch and monitor constitute production control system. Dispatch aims at allocating and managing resources, while monitor aims at completing real time monitoring of production line for collecting information of quality control.
Manufacturer use distribution centre and basket centre to deal with the goods transported from suppliers. Distribution centre covers an area of 27000 square meters where containers are unpacked. The goods are processed according to their sizes. Usually there are two types between goods-big and small which means big size goods and small ones are stored in the different zones. Distribution centre is divided to four areas: unpacking area, SLT storage area, GLT storage are and KLT storage area. Basket centre covers an area of 18000 square metres for delivering the goods by hand carts. There are big and small baskets on the hand carts for picking and sorting different goods. Basket centre is divided to Storage Area Ⅰ, Storage AreaⅡ,Storage Area Ⅲ, where goods are all placed at set-position for improving the efficiency of picking and sorting.
Production line system
Equipment Logistics system Production control
system
Operations in mixed assembly line
Supply Stock Transportation
Supply based on demand Storage, buffer Forklifts, workers Dispatch Monitor Schedule, resource allocation Production and quality control
34
4.3 FAW Car’s Reverse Logistics
FAW founded a subsidiary which is constituted by seven logistics centres run by third party in 2002. The subsidiary aims at providing sorts of components for all stations of FAW, which can improve the performance of customer services. The logistics centres are located in Beijing, Guangzhou, Jinan, Wuxi, Chengdu, Xian and Changchun, which can cover the whole supply of China as shown in the following figure. The logistics centres are relatively independent run by third parties, but they also share the resources and information and are controlled by headquarter in Changchun. Theses logistics centres operate according to the process standards made by headquarter, moreover they need to accept management surveillance and direction from headquarter for assuring the quality of services.
Figure 13 The locations of logistics centres
The company collects waste and scrap vehicles and components. The returned components are more common. Furthermore waste and scrap vehicles is usually disassembly to components to remanufacture for the convenience of transportation and storage. FAW outsources the function to a subsidiary of FAW. The process of reverse logistics is illustrated as Figure 13.
Logistics centers in Changchun Logistics center in Jinan Responsible for north market Logistics center in Chengdu Responsible for southwest market Logistics center in Xian Responsible for northwest market Logistics center in Wuxi Responsible for south market Logistics center in Beijing
Figure 14 The Process of Reverse Logistics in FAW Car Co.
The company facilitates the human costs through outsourcing the reverse logistics to the third party and is beneficial for centralized management of returned components reducing intermediate steps due to professional services provided by third parties. Furthermore the inventory levels are decreased.
4.4 Inventory in FAW Car Co.
4.4.1 Inventory System
The inventory system is on the basis of information provided by central centre in Changchun as shown in Figure 14. Central centre will make plans after receiving information from suppliers, and then send the information to dispatch centre in Changchun and Beijing respectively. Dispatch centre also deliver the information to all warehouses for arranging the movements of materials. In the system, all the information are transferred free and bidirectional, and hence the system is highly efficient.
The system emphasizes on the control of central centre in Changchun, and strengthens the cooperation of warehouses through setting up dispatch centres in Changchun and Beijing, which reduces inventory cost thereby producing an efficient supply chain.
Moreover central centre in Changchun is responsible for the whole purchasing of materials and managing the inventory system. Specifically, dispatch centre in Changchun is responsible for domestic purchasing, while dispatch centre in Beijing is responsible for overseas purchasing.
• The compoany collects the returned components.
• The third party processes the returned components.
• The third party stores the returned components in the warehouses.
• The returned components are delivered to the company after categorizing.
• The company sendis the returned components to service centre for refurbishing or repairing.
• The company sends the returned components to manufacutrers for reusing or remanufacturing.
36
Figure 15 Inventory System
4.4.2 Inventory Management in FAW Car Co.
Beipin Department is one of seven functional departments in FAW Car Co., which is responsible for procurement, allocation, storage, sales, distribution, information system management and analysis of information and data.
The department is responsible for purchasing materials from upstream suppliers and supplying materials to downstream logistics centres. Furthermore the department is also responsible for calculating, evaluating and analysing all kinds of data and parameters for meeting the requirements of distributors, stations and logistics centres. Logistics centres need to prepare data and information for Beipin Department. On the other hand, they also take charge of providing the parts to downstream distributors and stations and assisting local stations for services regarding with the parts and components. The stations have a certain amount of inventory of spare parts provided to end customers directly. If they have extra needs, they will send request to local logistics centres. Figure 15 shows the process of inventory system among manufacturer, suppliers and 4S shops.
Information flow Materials flow suppliers Dispatch center in Changchun Central center in Changchun Dispatch center in Beijing Warehouse 1 Warehouse 9 Sttation Sttation Sttation Sttation Regional warehousing Regional warehousing
The company’s warehousing Materials from
domestic suppliers
Materials from overseas suppliers
Figure 16 Inventory System
There are three main steps of inventory management in FAW Car Co. first of all, dealers and customer services send the request of demands of parts and components to local logistics centre, and then logistics centre send all the information received to Beipin Department for purchasing. After that, Beipin Department uses the information and data for sales forecast, and then they make plans based on the combination of forecast and inventory levels of spare parts.
Generally the parts are classified according to ABC analysis. There are three groups of parts. The department place order to suppliers according to demand of the parts in Group A, and suppliers will deliver the parts to warehouses in 1-2 days. Generally, the parts from suppliers are unpackaged, and hence the parts need to be packaged after inspection. In general packaging is manual operations, while moving and storage require forklifts. Lastly, Beipin Department send the parts to logistics centres according to requests from centres after second packaging. Order cycle is twice per month for logistics centres.
According to Figure 9, manufacturer workshop is divided to four workshops: Punch, Welding, Painting and Assembly. Every workshop has independent unloading, moving and storage areas for receiving materials. The frequency of receiving materials is basically the same. Punching workshop has slightly higher frequency than the others. Parts in the warehouses are classified to Group A, Group B and Group C according to ABC Analysis. The key parts are in Group A, whose order quantity is 2/3 of Group B and 1/2 of Group C. The parts from foreign countries and from other
Manufacturer Suppliers Lgositics centres Transmit warehouses Transmit warehouses 4S shop 4S shop 4S shop Placing orders Orders of transporatation Orders of delivering Receiving orders Inventory System Material Flow Information Flow
38
places of China are in Group A and Group B respectively, while common parts are in Group C.
ABC Classification is the most common classification method in inventory management. Annual amount of money spent equals unit price times annual quantity of parts consumed. Then sort the annual amount of money from high to low. The parts that tie up the most money and have high importance are classified in Group A. this group requires more attention and accurate order point and quantity. By contrast, the parts that tie up the least money and have low importance are classified in Group C. This group just needs to replenish inventory after stock counting at intervals. The management for Group B is intermediate. Table 2 shows details.
Group Proportion of Types of Parts Proportion of Money Tied Up A 10% 70-75% B 15-20% 20-25% C 70-75% 5-10%
Table 3 The Situation of Group A, B and C in inventory
The demand of spare parts is another important parameter affects ABC Classification. According to Pareto Analysis, spare parts can be classified as following three groups: In Group X, the parts need to be replenished highly frequently, and vice versa. Based on previous experiences, Group X should include approximately 90% spare parts.
Parts No. Unit Price (Yuan) Inventor y Quantit y Cumulati ve Proportio n Stock's Cost(Yua n) Cumulati ve Proportio n Grou p 1 500400-JA 44401. 5 2 0.02% 88803 8.32% A 2 F6AZ2001CA 706.5 81 0.86% 57226.5 13.69% A 3 3106016-KN1 476.38 113 2.04% 53830.94 18.73% A 4 053911023A 1187.8 45 2.51% 53451 23.74% A 5 F5LY12029A 662.84 74 3.27% 49050.16 28.34% A 6 6800015-MY-ST 7381.5 9 6 3.34% 44289.54 32.49% A 7 034903016W 1062.0 1 37 3.72% 39294.37 36.17% A 8 016301103BG 5187.7 2 7 3.79% 36314.04 39.58% A 9 F6AZ2780AA 997.78 35 4.16% 34922.3 42.85% A 10 034133063DC 42830. 1 8 4.24% 342640.8 74.96% A 11 5604350-SA 2534.4 13 4.38% 32947.2 78.05% A 12 7003015-JC 558.52 21 4.60% 11728.92 79.15% A 13 4A0201351E 151.99 175 6.41% 26598.25 81.65% A 14 F4AZ6701A 166.27 142 7.89% 23610.34 83.86% A 15 7911020-JA 3860.4 1 6 7.95% 23162.46 86.03% A 16 012409177B 188.98 117 9.17% 22110.66 88.10% B 17 191611996D 63.04 329 12.59% 20740.16 90.05% B 18 443857535JA 100.93 268 15.38% 27049.24 92.58% B 19 035133853D 47.65 405 19.59% 19298.25 94.39% B 20 056109119A 34.94 419 23.94% 14639.86 95.76% B 21 FIAZ6626A 43.12 219 26.22% 9443.28 96.65% C 22 1012010-NU1 23.44 401 30.39% 9399.44 97.53% C 23 D9ZZ14526F 6.44 1430 45.25% 9209.2 98.39% C 24 N90427901 1.8 4880 95.99% 8784 99.21% C 25 8211530-LR 21.73 386 100.00% 8387.78 100.00% C TOTAL 9619 1066932
Table 4 The Classification of Spare Parts
Table 3 shows the classification of 25 random spare parts of Besturn according to ABC Classification. The total inventory quantity is 9619, and total stock’s cost is 1066932 Yuan. The parts whose inventory quantity is less than 20 are in Group Z; the
40
parts whose inventory quantity is between 20 and 40 are in Group Y; the parts whose inventory quantity is more than 40 are in Group Z.