1
The effect of different delineator post configurations on driver
1speed in night-time traffic: A driving simulator study
23
Sara Nygårdhs*ab, Sven-Olof Lundkvista, Jan Anderssona, Nils Dahlbäckb
4
aThe Swedish National Road and Transport Research Institute (VTI), SE-581 95 Linköping, Sweden 5
bDepartment of Computer and Information Science, Linköping University, SE-581 83 Linköping, Sweden 6
* Corresponding author. Tel.: +46 13 204330
7
E-mail addresses: sara.nygardhs@vti.se (S. Nygårdhs), sven-olof.lundkvist@vti.se (S-O Lundkvist),
8
jan.andersson@vti.se (J. Andersson), nils.dahlback@liu.se (N. Dahlbäck).
9
Abstract
10The aim of the study was to investigate how different delineator post configurations affect driver 11
speed in night-time traffic. In addition, the potential speed effect of introducing a secondary task was 12
investigated. The study was carried out in a car simulator on a road stretch including straight road 13
sections as well as curves with different radii. Fourteen drivers participated in the study and the 14
results show that absence of delineator posts leads to reduced speed. However, provided that there 15
are delineator posts continuously present along the road, the overall driver speed is basically the 16
same, regardless of the spacing between the delineator posts. The results also imply that to reduce 17
driver speed in curves with small radius, using more compact spacing of posts in these curves as 18
compared to in curves with a larger radius, could be a potential strategy. Additionally, the speed 19
reducing effect of a secondary task was only prevailing where the task was initiated. 20
Keywords
21Delineator posts 22
2 Simulator study 23 Night-time traffic 24 Distraction 25 Driver speed 26
1 Introduction
27Road accidents are a cause for concern in all countries and vehicle speed is a factor strongly 28
contributing to the outcomes of these accidents on the road network. The road authorities often 29
strive to fulfil sometimes conflicting goals of driver safety, accessibility, comfort and others. Road 30
delineator posts are examples of available road equipment measures that can be used in order to 31
fulfil the goals of the road authorities. In the Nordic countries, the aim of delineator posts is to 32
provide drivers with visual guidance in night-time traffic for increased comfort and accessibility 33
(Lundkvist, 2012). Their effect on traffic safety has however been discussed. 34
1.1 Driver behavioural theory
35
A field experiment on Finnish two-lane rural roads showed that introduction of delineator posts 36
increased driving speeds as well as the number of injury accidents in darkness on roads with low 37
geometric standard (Kallberg, 1993). This finding is in agreement with the risk homeostasis theory by 38
Wilde (2001), which states that: 39
In any ongoing activity, people continuously check the amount of risk they feel they are
40
exposed to. They compare this with the amount of risk they are willing to accept, and try
41
to reduce any difference between the two to zero. Thus, if the level of subjectively
42
experienced risk is lower than is acceptable, people tend to engage in actions that
43
increase their exposure to risk. If, however, the level of subjectively experienced risk is
3
higher than is acceptable, they make an attempt to exercise greater caution. (Wilde,
45
2001, p.5). 46
This theory by Wilde can be interpreted as when driving a car, measures meant to help the driver 47
drive more safely, may in fact lead to increased speed in order for the driver to maintain the same 48
experienced amount of risk he or she is willing to accept. 49
The zero-risk theory, presented by Näätänen & Summala (1976) and explained more in detail by 50
Summala (1986), describes a situation where a driver is maintaining a certain safety margin. The 51
driver’s subjective speed variance is smaller compared to the objective variance, both in the driver’s 52
own performance and in the environmental conditions (Summala, 1986). Summala does not have 53
high hopes for changing driver behaviour and suggests speed regulation as a necessary condition for 54
efficient traffic safety work. He writes that: 55
The key for the effective safety countermeasures is thus to prevent drivers from changing
56
their behavior in response to system modifications – i.e. to prevent drivers from
57
satisfying their motives. (Summala, 1986, p.15)
58
This is in contrast to Wilde, since the risk homeostasis theory assumes that drivers continuously 59
check the amount of risk they feel they are exposed to and adapt to it, while the zero-risk theory, on 60
the other hand, implicates that drivers normally do not feel exposed to any risk. 61
Like Summala, Fuller (2005) argues that risk of collision is generally not relevant in the decision-62
making loop when driving. Instead, Fuller proposes task difficulty homeostasis as a subgoal when 63
driving and risk homeostasis, in the sense of risk regarding feelings of risk, as being a special case of 64
the former. According to Fuller, there is an inverse relation between driving task difficulty and the 65
difference between driver capability and driving task demand. Although there are many factors 66
determining task demand, such as environmental factors (e.g. visibility, road alignment, road marking 67
and curve radii), other road users and operational features of the vehicle (e.g. information display), 68
4
choice of speed is considered to be a factor over which the driver has immediate control (Fuller, 69
2005). 70
What seems to be a common main factor in the theories described by Wilde, Fuller and Summala and 71
Näätänen is driver speed. Therefore, measuring driver speed is significant when investigating how 72
different road equipment measures affect driver behaviour. One measure with the aim to facilitate 73
driver guidance is using road delineator posts. 74
1.2 Night-time traffic and delineator posts
75
The human vision deteriorates as the amount of light decreases, which impairs both visual acuity and 76
contrast sensitivity (Fors & Lundkvist, 2009). Since drivers essentially need visual information to carry 77
out their driving task, the amount of available information decreases as the light level is reduced. 78
Bella and Calvi (2013) compared driving with different road designs during daytime and night-time 79
visual conditions using a driving simulator. They conclude that it is not satisfactory to base speed 80
analysis of tangent-curve transitions only on daytime driving conditions, because potential critical 81
road situations that were identified during night-time driving were not identified from the simulated 82
daytime driving. In order to minimize speed differentials during the night it is suggested to aim at 83
speed reducing measures before entering a curve and also to increase the perception and visibility of 84
the curve. 85
Since the main task of delineator posts is to provide visual guidance in darkness, i.e. at night-time 86
conditions, they could possibly be used as such a visibility measure that Bella and Calvi recommend. 87
In a previous driving simulator study, the effect of road marking visibility and presence of delineator 88
posts on a rural two-lane road with posted speed limit of 90 km/h was studied (Ihs, 2006). It was 89
found that delineator posts (with a spacing of 50 m) on this kind of road increased driver speed 90
approximately 2-10 km/h in night-time conditions, depending on road marking visibility. Presence of 91
delineator posts affected driver speed more if the road marking visibility was poor. 92
5
Zador et al. studied short- and long-term effects of different curve delineation treatments on driver 93
speed on existing two-lane roads in situ (Zador, Stein, Wright, & Hall, 1987). They found that 94
presence of delineator posts along the outside of curves increased night-time speeds in curves by 95
about 2 km/h. These short-term results were not contradicted by long-term measurements. 96
Blaauw (1985) tested different configurations of raised pavement markers and delineator posts in 97
darkness on straight road sections and curves with 1000 m radius and 200 m radius, respectively. The 98
study was carried out in the field with constant speed and driver determined visual occlusion. The 99
results showed that drivers observed the road less frequently if the delineator posts were located 100
1.5 m from the driver lane as opposed to 3.5 m. In addition, all drivers observed the configurations at 101
small curves more often than at large curves, and more seldom at the straight road stretches. 102
Another attempt to compare different retroreflective delineation treatments in curves was 103
conducted as an instrumented car study on a test track (Jenkins, 1991). For small curves with a radius 104
of 125 m it was concluded that drivers entered the curve faster and tended to brake harder in the 105
curve if there were delineator posts compared to if there were raised pavements markers present. 106
Other research on driving and overtaking in horizontal curves for right-hand traffic in general (based 107
on a field test with an instrumented vehicle) implies that speed is higher in curves to the right than to 108
the left (Othman, Thomson, & Lannér, 2010). 109
As the use of in-vehicle devices become more common (Jacobson & Gostin, 2010), it is of interest to 110
study whether or not there is a relationship between visual distraction and different delineator post 111
configurations. Although there is no general definition of driver distraction at present, Young & 112
Regan (2007) found in a research review on the subject, that drivers tend to engage in various 113
compensatory strategies in order to maintain an acceptable level of driving performance while 114
interacting with in-vehicle devices. Some of the compensatory strategies mentioned were reducing 115
speed or not using in-vehicle devices at all during driving. In a simulator study by Haigney et al. 116
(Haigney, Taylor, & Westerman, 2000) it seemed that drivers tried to compensate increased cognitive 117
6
workload (in the form of mobile phone use) by reducing speed. It was however found that increased 118
cognitive workload was still the case and the authors predicted that drivers would be less able to 119
handle emergency situations or other sudden increases in driving task demands. 120
1.3 Aim and predictions
121
In order to find out how different delineator post configurations affect driver speed, a simulator 122
experiment was carried out. The aim of this study was to investigate the effects of delineator post 123
configurations on speed in darkness. Existing delineator post configurations were tested along with 124
baseline and best practice configurations. The delineator post spacing differed depending on curve 125
radius for the chosen configurations. According to the maxmincon principle, where the range of 126
values of research variables should be wide, horizontal curves with large radius (1000 m) and small 127
radius (250 m) were used, in both the left and right direction. Using a car simulator also affords for a 128
controlled environment where all the participants experience the exact same road, environmental 129
conditions and visual cues outside of the car. For the purpose of examining the possible influence of 130
distraction during driving, a distraction task was used. The distraction task was operationalized 131
through a visual in-car device, previously used in the same simulator by e.g. Kircher & Ahlström 132
(2012). By this, possible interactions of visual distraction with delineator post configuration could be 133
observed. 134
In accordance with the theory and previous references above the following predictions can be made: 135
Presence of delineator posts lead to increased driver speed compared to absence of 136
delineator posts on the whole road stretch (Ihs, 2006) and in curves (Zador et al., 1987). 137
Given that there are delineator posts present continuously on the road, driver speed is 138
dependent on the spacing between them (Fuller, 2005). 139
Drivers reduce their speed in connection to a secondary task (Haigney et al., 2000). 140
7
From the predictions made above, an additional prediction can be made: 141
There is an interaction between presence of a secondary task and presence of delineator 142
posts, in terms of driver speed. 143
2 Material and methods
144The study was conducted as a simulator study in night-time traffic (i.e. the simulator road was 145
surrounded by complete darkness although the experiment was carried out during the day) directly 146
followed by interviews in March 2012 at the Swedish National Road and Transport Research Institute 147
(VTI) in Linköping, Sweden. 148
2.1 Participants
149
The participants were selected through convenience sampling, where some were recruited among 150
those who registered their interest to participate in a simulator study through the VTI website, and 151
the remainder through personal contacts. A selection criterion was that the participants should not 152
be wearing glasses during driving. (Eye tracking equipment was used but these data are not analyzed 153
in this paper.) In total, nineteen participants were recruited for the simulator study. Due to data loss 154
caused by malfunctioned technical equipment and one case of simulator sickness, only fourteen of 155
the participants are included in the analyses. These were five females and nine males, with ages 156
ranging from 25 to 67 years (42 years on average) and they all had a driving license for more than six 157
years (range 7-47 years, 23 years on average). The participants estimated their mileage during the 158
past 12 months to be 2,500-40,000 km (14,400 km on average) whereof the estimated percent of 159
driving in daylight/darkness ranged from 90/10 to 45/55 (70/30 on average). This implies that the 160
participants were fairly experienced drivers and that they did not avoid driving in darkness. 161
2.2 Simulator
162
The simulator used in the experiment was the VTI Driving Simulator III at VTI. The advanced moving 163
base of the simulator generates forces with three different systems: a large linear motion to simulate 164
8
lateral motion, a tilt motion to simulate long term accelerations such as driving in a curve or 165
longitudinal acceleration and deceleration, and a vibration table to simulate road roughness. The 166
basic functionality of the simulator is described by Nordmark et al. (Nordmark, Jansson, Palmkvist, & 167
Sehammar, 2004), but the visual system has been continuously developed and improved since then 168
and presently consists of three digital projectors providing a 120° forward field of view and three LCD 169
displays for the rear view mirrors. The simulator car was a Saab 9-3 with automatic transmission. 170
171
Figure 1. An example view from the driver’s position in the simulator, driving in a curve. Source: VTI/Björn Blissing. 172
Throughout the experiment, the only visual cues for the driver were the delineator posts and the 173
road markings, resembling driving on a pitch-black road. The delineator posts were visible at a 174
distance of 200 m. Figure 1 shows an example view from the driver’s position in the simulator. 175
The main advantage of using a driving simulator in contrast to real driving on the road is keeping the 176
conditions constant. The surrounding environment can be perfectly controlled in terms of road 177
alignment, state of road equipment, weather etc. A disadvantage is of course the validity; that 178
driving in a simulator cannot be directly and thoroughly transformed to driving on a real road. For 179
instance, the consequences of a mistake are not severe in a simulator and in the study that is 180
presented here, there were no oncoming cars. However, a validation study of the VTI Driving 181
Simulator III that was carried out in daylight conditions by Ahlström et al. (Ahlström, Bolling, 182
9
Sörensen, Eriksson, & Andersson, 2012) showed no significant driver speed differences between 183
driving in the simulator and in a car. 184
2.3 Delineator post configurations
185
The delineator post configurations in Table 1 were tested in the simulator. Configuration A is the 186
current configuration in Norway and Sweden (spacing 50 m on straight road stretches, 25 m in 187
curves), B is the current configuration in Denmark (100 m on straight road stretches, 50 or 33 m in 188
large and small curves, respectively) and C is the current configuration in Finland (60 m on straight 189
road stretches, 30 m in curves). The four additional configurations were chosen by an expert panel 190
consisting of Nordic experts on road equipment, mainly road keepers. The expert panel was 191
encouraged to find interesting configurations for testing, i.e. it would be expected a mix of economic 192
and visual guidance criteria in the search for a best practice. The panel chose to add one 193
configuration that was denser in small curves (D as compared to A and C), one configuration that was 194
denser before and after curves (E as compared to B), one that did not have any delineator posts at 195
straight road stretches (F) and one configuration that had no delineator posts at all (G), which can be 196
seen as baseline. Table 1 shows the characteristics for all the configurations. 197
10
Table 1. Delineator post configurations tested in the simulator. The existing Nordic standard configurations are denoted 198
in bold characters. The numerals in the last three columns indicate distance between delineator posts. When delineator 199
posts were present, the reflectors were white, except in configuration B. 200
Configuration Curve radius [m] Straight road stretch [m] Before/After curve [m] In curve [m] A 1000 50 50 25 250 50 50 25 Ba 1000 100 100 50 250 100 100 33.3 C 1000 60 60 30 250 60 60 30 D 1000 50 50 25 250 50 50 10 E 1000 100 50 50 250 100 25 25 F 1000 ∞ 50 50 250 ∞ 25 25 G 1000 ∞ ∞ ∞ 250 ∞ ∞ ∞
a yellow reflectors to the right, white to the left
201
The closer spacing of the delineator posts, in relation to the straight road stretches, started 100 m 202
before and continued to 100 m after the curve, both for small and large radii. 203
2.4 Test route
204
A road stretch of 6 km was implemented in the driving simulator as shown in Table 2. The road width 205
was 9 m and there were six curves along the road stretch, with straight road sections between them. 206
The same road stretch was repeated with the seven different delineator post configurations, with a 207
shorter road stretch in between for all participants. The order of the configurations was balanced 208
between the participants in the sense that each of the seven configurations was the first 209
configuration approached for two of the participants, the second approached for two other 210
participants and so on. Since the number of participants was small, no totally balanced design was 211
possible. 212
11
Table 2. Horizontal profile of the road stretch used in each delineator post configuration and trial in the driving 213
experiment. 214
Distance
[m] Straight
Left curve Right curve Start of
distraction task [m] 1000 m radius 250 m radius 1000 m radius 250 m radius 0-1000 x 800 1000-1296 x 1296-1796 x 1596 1796-1993 x 1993-2493 x 2493-2789 x 2789-3789 x 3789-4226 x 4226-4726 x 4526 4726-4922 x 4922-5422 x 5422-5858 x 5522 5858-6000 x
2.5 Distraction task
215The idea of the distraction task was to let the driver decide when and how much he or she wanted to 216
look away from the road, depending on the situation and delineator post configuration. Therefore, a 217
visual distraction task inside the car was used, that was unfamiliar to all of the participants. The 218
distraction task came at four specific spots for each delineator post configuration. Three of them 219
started 200 m ahead of curves and the fourth 100 m after the beginning of a curve (see Table 2). The 220
task was shown on an LCD touch screen placed at the upper centre console in the car. The principle 221
of the distraction task is shown in Figure 2. 222
12 223
Figure 2. Two examples of the principle of the distraction task. To the left, the correct answer is NO, since no arrow is 224
pointing upwards. To the right, the correct answer is YES, since there is an arrow pointing upwards. 225
The task was to look at the screen for any arrow pointing in the upward direction. If this was the 226
case, the participant should push the button YES. If there was no arrow pointing upwards, the button 227
NO should be pushed. 228
The tasks were initialized with a sound. When answering, there was a neutral “ping” sound if the 229
answer was correct and a more annoying “vrat” sound if the answer was incorrect. In both cases the 230
task was removed from the screen and the answer was registered. If the participants did not answer 231
within a time limit of 20 seconds, the task was removed and “no answer” was registered. This time 232
limit was chosen in order for the task not to interfere with the next task, regardless of driver speed, 233
and at the same time be long enough for the driver to choose if he or she was willing to answer the 234
task directly or wait for a better opportunity. 235
2.6 Interviews
236
Semi-structured interviews, that mainly regarded interviewee strategies for how and when to solve 237
the distraction task, were held immediately after the simulator drives in a smaller room, in the 238
vicinity of the simulator hall. The interviewer and the participant were the only individuals present. 239
The first author of this article interviewed all of the participants, except two, who were interviewed 240
by a colleague at the institute. 241
13
2.7 Experimental design
242
The dependent variable measured in the experiment was mean speed, and since all of the 243
participants were exposed to all of the configurations, both with and without distraction, a within-244
participant design was used. 245
There were 14 participants (Participant) carrying out 2 simulator drives (Trial), the first one without 246
and the second one with a distraction task, and there were 7 delineator post configurations (Config) 247
in each simulator drive. Horizontal curves with radii of 1000 m and 250 m were used, to 248
operationalize radius in large and small curves (Radius), respectively. The curves were categorized to 249
be either bent to the left or the right (Bend). 250
All participants carried out all combinations of Trial and Config and all models include Participant as a 251
random factor. However, since the aim of this study is not to investigate individual differences, no 252
main or higher order effects of Participant are presented in the Results section. For all analyses, a full 253
factorial model was used in the sense that all main effects and all higher-order terms with respect to 254
the fixed factors were included. 255
In the no distraction trial, the main design was a 7 (delineator post configuration A-G; Config), and 256
the experimental design for curves was 7 (delineator post configuration A-G; Config) × 2 (250 m 257
radius vs 1000 m radius; Radius) × 2 (left vs right; Bend). In the comparison between the trial with 258
and without distraction, the main design was a 2 (no distraction vs distraction; Trial) × 7 (delineator 259
post configuration A-G; Config). To compare the trials in relevant curves, the three curves (Curve) 260
before which the distraction task came in the distraction trial, were analysed. Hence, the 261
experimental design for these three curves was 2 (Trial) × 7 (Config) × 3 (Curve). All analyses were 262
conducted using univariate analyses of variance (ANOVAs) including the relevant factors for the 263
designs. 264
The different models are further described in the result section. 265
14
2.8 Procedure
266
The participants were contacted through phone calls and e-mails with information about the study 267
and their own time slot. When arriving at VTI, they were met in the reception by a test leader who 268
guided them to the simulator hall. There, they were given information about the study both visually 269
and orally and after having their potential questions answered they were asked to fill out a form for 270
informed consent. 271
Before simulator drive 1 the participants were instructed to drive as they normally would on a road 272
of the kind they would experience. To prevent the speed limit from restricting driver’s choice of 273
speed, the speed limit of the road was told to be 90 km/h, which was higher than a typical road of 274
the kind implemented. At the end of each configuration the drivers were asked to estimate on a scale 275
from 1 to 7, where 1 was very easy and 7 very difficult, how it was to drive with the current 276
configuration of delineator posts. The test leader then asked the driver (during driving) How easy or 277
difficult was it to drive with the current configuration? (translated from Swedish) and noted the
278
verbal answer from the driver in a protocol. The participants had a training session directly before 279
the first drive to acquaint themselves with the simulator. 280
After simulator drive 1 had been carried out, the participants were brought out of the simulator and 281
got written as well as verbal instructions about simulator drive 2. The participants were informed 282
that they would drive exactly the same road as in drive 1, but that there would be an additional 283
distraction task. They were informed that the task would symbolize a distraction of some kind, for 284
instance that the driver needed to adjust the radio, answer the mobile phone or is disturbed by a 285
yelling child in the car. However, their main task was to drive the car in the same way as they did in 286
simulator drive 1. Additionally, at the end of each configuration, the drivers were asked to answer 287
the question by the test leader How easy or difficult was it to do the distraction task with the current 288
configuration? Distraction task practice was given before simulator drive 2 started. All participants
289
drove the simulator trial without distraction first, and then the trial with distraction. 290
15
When the participants had driven both tasks, they were interviewed in another room, close to the 291
simulator hall. After the interview, they were asked to fill out a form on simulator experience and 292
some background information as well as the remuneration form, before they were walked back to 293
the reception and thanked for their participation. After the experiment, all participants received a 294
taxable reimbursement of 500 SEK. 295
2.9 Data analysis
296
To avoid bias between the trials due to the fact that the participants all encountered the trial without 297
distraction tasks first, the harmonized speed was calculated for comparisons between the two trials. 298
In the two right hand curves with 1000 m radius (distance 2493-2789 m and 3789-4226 m from start 299
of road stretch, respectively) no distraction task was ever given, even in the distraction trial (trial 2). 300
Therefore, these unaffected curves were chosen as a basis for harmonization according to the 301
following procedure: The mean speed for participant i in the two right hand curves with 1000 m 302
radius was calculated for the distraction trial, vidistraction, as well as for the non-distraction trial,
303
vino distraction. To harmonize, the sampled speeds for participant i in the non-distraction trial were all
304
multiplied by the quotient vidistraction/vino distraction. The harmonization thereby results in that the mean
305
speeds in the unaffected curves were equal, irrespective of distraction, for an individual participant. 306
When analyzing only one of the trials, the non-harmonized speed was used. 307
Because data was collected with the same frequency, 10 Hz, although some participants drove 308
slower and some faster, the amount of collected data was different for each participant. To avoid 309
that the mean speed would be affected more by slowly driving participants, the mean speed was 310
always calculated as an average of the mean speeds for each participant. 311
Since the 6 km long road stretch, including six equal curves and seven straight road stretches, was 312
the same for all delineator post configurations and for all participants and in both trials (with and 313
without distraction), analyses were carried out on the following sections of road: 314
16 The whole road stretch (6 km)
315
(b) Before curve. These sections include the road stretch 200 m before the start of the curve 316
to the start of the curve, which represents the straight road stretch on which the curve is first 317
visible and also the initiation of the distraction task for three curves. 318
(c) In curve. These sections represent the road stretch from start of curve to end of curve. 319
(a) After curve until next curve is visible. These sections start at the end of each curve and 320
end 200 m before the next curve, which represent the straight road stretch unaffected by the 321
next curve and by distraction tasks. 322
323
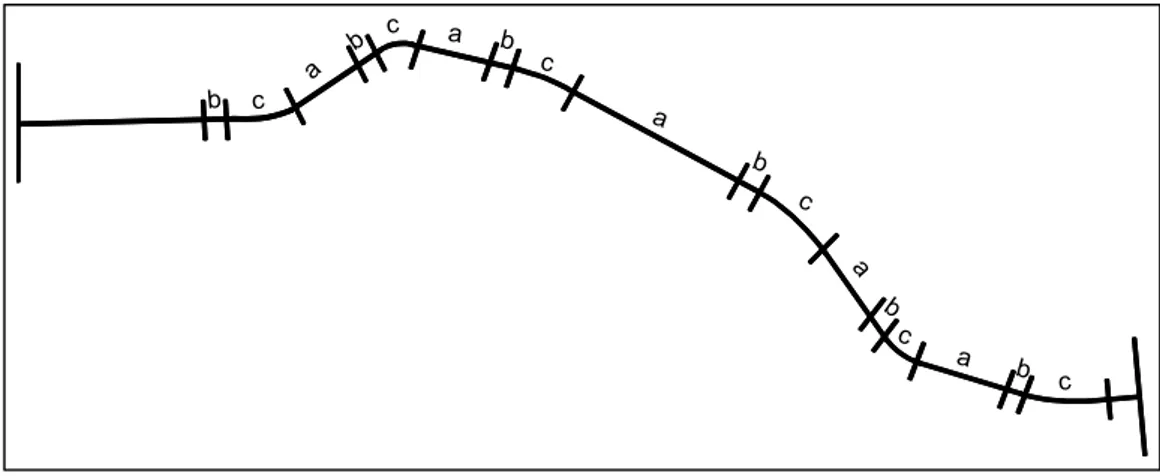
Figure 3 shows a sketch of the whole road stretch and the road sections used in the analyses. With 324
the division of road sections like this, there is no overlap between road sections. Each of the road 325
sections are affected by one curve and one curve only. To get an overall view the whole road stretch 326
was also object to analyses. 327
328
329
Figure 3. Sketch of the road stretch with the road sections analysed. a-sections = after curves (from end of curve until 330
next curve is first visible), b-sections = before curves (from that a curve is first visible to start of curve), c-sections = in 331
curves (from start of curve to end of curve). 332
All tests were carried out at a significance level of 0.05. 333 b c a b c a b c a b c a b c a b c
17
For every participant only one (the mean) value of speed is used. In analyses with only one value per 334
cell, the error term cannot be calculated and hence there is no interaction estimate. 335
3 Results
336The letter in parentheses after some of the paragraphs refers to the road sections in Figure 3. 337
3.1 No distraction
338
3.1.1 Mean speed on the whole road stretch
339
A univariate ANOVA with mean speed per participant as dependent variable and Config(7) as 340
independent variable was carried out. 341
The analysis showed that for the trial without distraction, there was a significant effect of delineator 342
post configuration on mean speed over the whole road stretch, F(6, 78) = 10.54, p < .001, ηp2 = .45. In
343
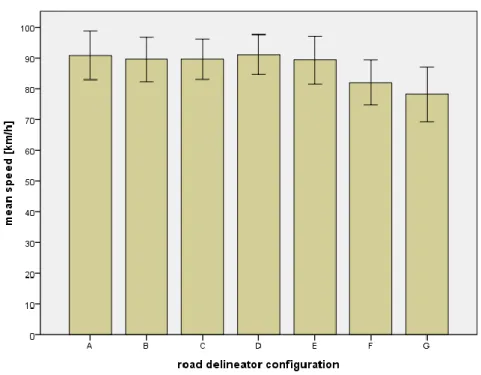
the configurations without delineator posts on straight road stretches, configuration G(78.2 km/h) 344
and F(82.1), the mean speeds over the whole road stretch were significantly lower than for the 345
configurations with delineator posts also on straight road stretches; E(89.4), C(89.6), B(89.7), A(90.9) 346
and D(91.2). Figure 4 shows the mean speeds on the whole road stretch with a 95% confidence 347
interval. 348
18 350
Figure 4. Mean speed on the whole road stretch. Error bars show the 95% confidence interval. 351
3.1.2 Mean speed before curve (b)
352
A univariate ANOVA was carried out on the straight road stretches where the curve was first visible 353
(200 m before the curve) until entering the curve. The dependent variable was mean speed per 354
participant and independent variables were Config(7) × Bend(2) × Radius(2). 355
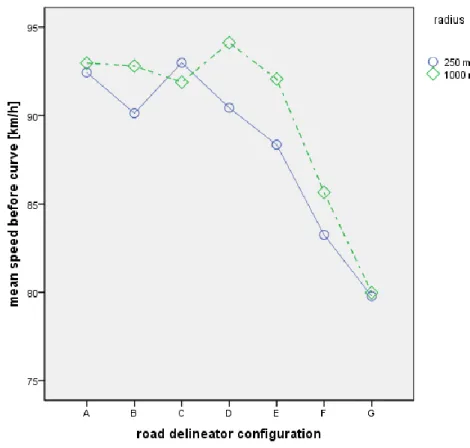
There was a main effect of Radius, F(1, 13) = 12.23, p = .004, ηp2 = .48; the mean speeds were higher
356
in curves with 1000 m radius (89.9 km/h) than in curves with 250 m radius (88.2 km/h). There was 357
also a main effect of Config, F(6, 78) = 8.25, p < .001, ηp2 = .39. Figure 5 shows the interaction effect
358
of Radius × Config, F(6, 78) = 2.91, p = .013, ηp2 = .18. The interaction shows that the speed is almost
359
the same in both small and large curves for configurations A, C and G, which are the configurations 360
where the spacing between the delineator posts is the same for both large and small curve radii. In 361
the configurations where the spacing of the delineator posts is denser in the horizontal curves with a 362
small radius as compared to in curves with a large radius, i.e. configurations B, D, E and F, the speeds 363
are lower before the curves with a small radius. There was no main or higher order effect of Bend 364
before curves. 365
19 366
Figure 5. Interaction effect of radius and delineator post configuration before curve. 367
368
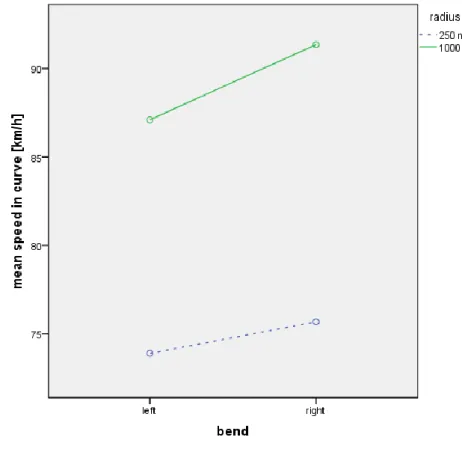
3.1.3 Mean speed in curve (c)
369
A univariate ANOVA was carried out on the road stretch from start to end of curve. The dependent 370
variable was mean speed per participant and independent variables were Config(7) × Bend(2) × 371
Radius(2). The mean speed was lower in curves with 250 m radius (74.0 km/h) than in curves with 372
1000 m radius (88.3 km/h), F(1,13) = 73.73, p < .001, ηp2 = .85. The mean speed was higher in curves
373
to the right (85.2 km/h) than in curves to the left (81.8 km/h), F(1, 13) = 11.96, p = .004, ηp2 = .48.
374
There was also a main effect by delineator post configuration, F(6, 13) = 3.74, p = .003, ηp2 = .22. Post
375
hoc tests revealed that in curves, mean speeds in configuration G(77.8 km/h) were significantly lower 376
than in the other configurations. Also, mean speeds in configuration F(82.2) were significantly lower 377
than in the other configurations: E(85.5), B(86.0), C(86.0), D(86.4) and A(87.1). This implies that lack 378
of delineator posts on straight road stretches (as in configurations G and F) influences the speed so 379
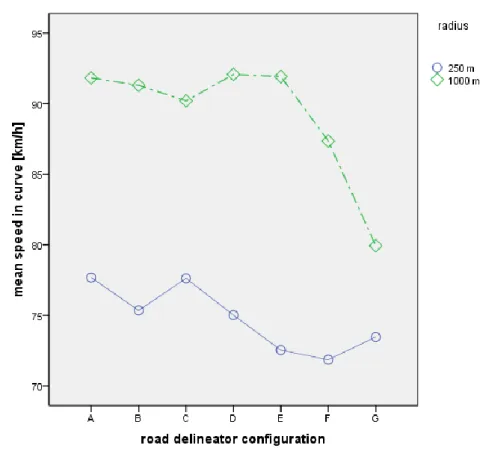
that the drivers drove slower also in curves. There was a Config × Radius interaction, F(6, 13) = 12.78, 380
20
p < .001, ηp2 = .50, because in curves with 250 m radius the mean speed was significantly lower in
381
configurations F, E and G compared to C and A, while in curves with 1000 m radius the mean speed 382
was significantly lower in G compared to all the others and in F compared to B, A, E and D. Figure 6 383
shows this interaction effect. 384
385
Figure 6. Interaction effect of radius and delineator post configuration in curve. 386
The interaction shows that the configuration completely without delineator posts (G) consistently led 387
to low driver speeds. Adding delineator posts before and in the curve (configuration F) had no effect 388
on speed in curves with 250 m radius but led to significantly higher speeds in curves with 1000 m 389
radius. If, additionally, the straight road stretches between the curves were equipped with delineator 390
posts (configuration E), the speeds were even higher in curves with the larger radius but there was 391
still no effect in curves with the smaller radius. 392
21
There was also a Radius × Bend interaction, F(1, 13) = 11.27, p = .005, ηp2 = .46 , because the mean
393
speeds were always higher in curves with the larger radius, but even higher if they were additionally 394
curved to the right. Figure 7 shows this interaction effect. 395
396
Figure 7. Interaction effect of radius and bend in curve. 397
There was no interaction effect of Config × Bend or for Config × Radius × Bend in curves. 398
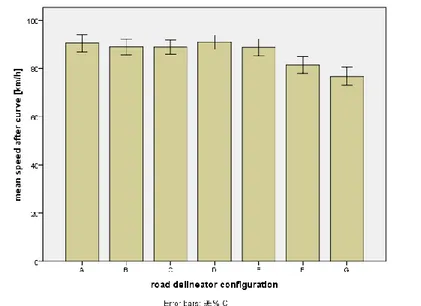
3.1.4 Mean speed after curve (a)
399
A univariate ANOVA was carried out on the straight road stretches directly after a curve until the 400
next curve was visible (200 m before the start of next curve). The dependent variable was mean 401
speed per participant and independent variables were Config(7) × Bend(2) × Radius(2). 402
For mean speed after a curve to 200 m before the next curve, there were main effects of Config, 403
F(6, 78) = 10.28, p <.001, ηp2 = .44, Bend, F(1, 13) = 24.49, p <.001, ηp2 = .65 and of Radius,
404
F(1, 13) = 103.03, p <.001, ηp2 = .89. The mean speeds were higher (90.4 km/h) after large curves than
405
after small curves (80.9 km/h), and after curves to the right (88.2 km/h) than after curves to the left 406
22
(84.2 km/h). Post hoc tests revealed that on the straight road stretches after a curve but before the 407
next curve is visible, mean speeds in configuration G(76.7 km/h), completely without delineator 408
posts, were significantly lower than in the other configurations. Also, mean speeds in configuration 409
F(81.4), without delineator posts on straight road stretches, were significantly lower than in the 410
other configurations: E(88.8), C(88.9), B(88.9), A(90.5) and D(90.9 km/h). Figure 8 shows the mean 411
speeds after curves for the different delineator post configurations. 412
There were no significant higher order effects of Config, Bend or Radius. 413
The results imply that if there are delineator posts in a curve, the speed is higher on the road stretch 414
after the curve than it would have been without delineator posts in the curve. Additionally, there was 415
no difference in mean speed after curves for the configurations with delineator posts both on 416
straight road stretches and in curves. 417
418
Figure 8. Mean speeds on the road stretches directly after a curve until the next curve is first visible. Error bars show the 419
95% confidence interval. 420
23
3.2 Comparison of trial: no distraction versus distraction
422
Throughout this paragraph, the mean harmonized speeds per participant are used (see 423
paragraph 2.9). It also has to be kept in mind that the order of the two treatment conditions was not 424
counterbalanced, since all participants experienced the no distraction trial first and the distraction 425
trial second. For the comparisons in 3.2.2-3.2.4 only the three curves before which the distraction 426
task was introduced (i.e. in the distraction task, the task was initiated 200 m before the curve) are 427
analysed. The effects that we want to examine in this section regard trial (i.e. with and without 428
distraction) and therefore, effects that are not due to trial are not investigated further. 429
3.2.1 Mean harmonized speed on the whole road stretch
430
A univariate ANOVA was carried out on the whole road stretch. The dependent variable was mean 431
harmonized speed per participant and independent variables were Trial(2) × Config(7). 432
On the whole road stretch, there was a significant effect of delineator post configuration on the 433
mean harmonized participant speed, F(6, 78) = 8.19, p <.001, ηp2 = .39. However, there was no speed
434
effect of whether there were distraction tasks or not on the whole road stretch, F(1, 13) = 0.46, 435
p = .508. No two-way-interaction effect with Trial was significant.
436
3.2.2 Mean harmonized speed before curve
437
To compare the trials in relevant curves, the three curves (Curve) before which the distraction task 438
came in the distraction trial, were analysed. A univariate ANOVA was carried out on the straight road 439
stretches where the three curves were first visible (200 m before the curve) until entering the curve. 440
The dependent variable was mean harmonized speed per participant and independent variables 441
were Trial(2) × Config(7) × Curve(3). 442
The analysis showed that there were significant main effects of Trial, F(1, 13) = 10.07, p = .007, 443
ηp2 = .44, because the no distraction trial had higher speeds (89.0 km/h) than the distraction trial
444
(87.0). There were also main effects of Config, F(6, 78) = 9.77, p < .001, ηp2 = .43 and of Curve,
445
F(2, 26) = 22.57, p < .001, ηp2 = .63. There were no significant interaction effects.
24
3.2.3 Mean harmonized speed in curve
447
A univariate ANOVA was carried out in the three curves where there had come a distraction task 448
200 m before the curve in the distraction trial. Dependent variable was mean harmonized speed per 449
participant and independent variables were Trial(2) × Config(7) × Curve(3). 450
There were main effects of Config, F(6, 78)=3.29, p=.006, ηp2 = .20 and of Curve, F(2, 26)=69.7,
451
p<.001, ηp2 = .84. There was also an interaction effect of Config × Curve, F(12, 156)=3.15, p<.001,
452
ηp2 = .20. Since there was no significant effect of Trial, this was not investigated further.
453
3.2.4 Mean harmonized speed after curve
454
A univariate ANOVA was carried out after the three curves where there had come a distraction task 455
200 m before the curve in the distraction trial. The dependent variable was mean harmonized speed 456
per participant and independent variables were Trial(2) × Config(7) × Curve(3). 457
There were main effects of Config, F(6, 78)=10.13, p<.001, ηp2=.44 and of Curve, F(2, 26)=46.60,
458
p<.001, ηp2=.78. There was also an interaction effect of Trial × Curve, F(2, 26)=5.48, p=.006, ηp2=.30.
459
Figure 9 shows this interaction effect. As can be seen, the interaction is due to an intersection in the 460
graph, which means that the mean harmonized speeds were higher after the curve with large radius 461
for the trial without distraction (88.4 km/h), than with distraction (87.2 km/h), while after curves 462
with small radius, the speeds were higher with distraction (82.6 vs 81.8 km/h in the right curve, 79.7 463
vs 78.2 km/h in the left curve). This implies that after curves with a large radius, the drivers do not 464
have to speed up much to achieve their preferred speed, even if a distraction has made them slow 465
down so some extent. However, small radius curves where a distraction task is added makes driver 466
speed so low that after the curves the drivers seem to compensate for this by increasing speed more 467
than if they had not been distracted at all. 468
25 469
Figure 9. Interaction effect of Trial × Curve after the three curves where the distraction came before the curve in the 470
distraction trial. 471
4 Discussion
472From the results it can be concluded that as long as there are delineator posts continuously along the 473
road, mean speeds on the whole road stretch do not differ between different configurations for non-474
distracted drivers. However, speeds are slower if there are no delineator posts at straight road 475
sections and even slower if there are no delineator posts at all. 476
Driving through tight curves, speeds are slower than in curves with large radius. Adding delineator 477
posts in a curve, and then additionally on the straight road sections increases speed in curves with a 478
large radius, but does not influence the already low speed in small curves. 479
It could be observed that drivers prepare for curves differently depending on how the delineator 480
posts are used: If the spacing between the delineator posts is the same for both large and small curve 481
radii, the mean speed is the same when preparing for the curves. If, on the other hand, delineator 482
26
posts are more closely spaced in smaller curves than in larger, drivers seem to prepare for the 483
smaller curves by slowing down more. 484
It seems that in curves with a small radius, drivers are more or less unaffected by how the delineator 485
posts are configured, probably because of the major need to reduce speed in order to be able to 486
control the vehicle and keep it on the road. In curves with a large radius, driving completely without 487
delineator posts is done at higher mean speeds than for small curves of all configurations, but at 488
even higher speeds if delineator posts are present in the curves, and even more so if there were 489
continuous delineator posts along the road. 490
The effect of small and large curve radius still remains when the curve is passed, in the sense that 491
speeds are higher after curves with a large radius than after curves with a small radius. Furthermore, 492
there is no difference in driver speed after curves between the configurations where the delineator 493
posts were present continuously along the road, whereas drivers drove slower if there were no 494
delineator posts on straight road stretches. 495
Distracted drivers drove somewhat slower before curves than if they were non-distracted. In the 496
curves before which there had been a distraction in the distraction trial, there was no speed 497
difference between distracted and non-distracted drivers. Having left a curve where the distraction 498
task appeared before the curve, distracted drivers drove faster after small curves but slower after 499
large curves, compared to when they were not distracted. 500
Although one of the results from this driving simulator study is that speed increases with delineator 501
posts along the road, we do not know whether this finding means that a driver would take a greater 502
safety (i.e. crash) risk driving with delineator posts at a higher speed or without delineator posts at a 503
lower speed, where he or she may not be able to identify the curve in advance to handle it properly. 504
It should, however, be kept in mind that delineator posts are not the only visual cues along a road 505
and that edge lines show the boundaries of the road, which delineator posts do not. 506
27
As mentioned in the Introduction, Summala advises speed regulation (Summala, 1986), while there 507
were no speed limit signs present during this study. It should be emphasized that the speed limit was 508
told to be higher than a typical road of the kind implemented (90 km/h as opposed to 70 km/h) and 509
we believe that introducing speed limit signs of 70 km/h would decrease speeds in the simulator, 510
mainly due to participant compliance in the experiment situation. Another question worth 511
consideration is whether the findings in this study hold true for other vehicle categories, e.g. heavy 512
vehicles. 513
To summarize, the outcome of the predictions made in the introductory chapter was the following: 514
Presence of delineator posts did lead to increased driver speed compared to absence of 515
delineator posts seen over the whole road stretch as well as in curves with a large radius. 516
However, the same was not true in curves with a small radius. 517
(Prediction partly confirmed.) 518
Given that there are delineator posts present continuously along the road, driver speed did 519
depend on the spacing between them before and in curves but not after curves. 520
(Prediction partly confirmed.) 521
Drivers did reduce their speed in connection to a secondary task where it was initiated, i.e. 522
before curves, but not in or after the curves. 523
(Prediction partly confirmed.) 524
There was no interaction between presence of a secondary task and presence of delineator 525
posts, in terms of driver speed either before, in or after curves. 526
(Prediction not confirmed.) 527
As can be seen from the bullet list above, the results of this study somewhat contradict the 528
predictions made based on previous studies and theory about delineator posts and the traffic 529
environment. While a previous field study (Zador et al., 1987) showed presence of delineator posts 530
to increase speeds in curves, the present simulator study showed that this was not true in curves 531
28
with a small radius. However, the study by Zador et al. was carried out at “curves that varied 532
systematically in direction and degree of curvature and in steepness of grade” (Zador et al., 1987, 533
p.2), which does not necessarily mean that curves with as small a radius as 250 m were included in 534
their study. 535
Since the results of this study somewhat contradict the predictions made from previous knowledge 536
and theory about delineator posts and the traffic environment, there is reason to believe that some 537
of the effects override other effects. For instance, the effect of a curve having a small radius means 538
that driver speed is affected to such an extent that the effect of delineator post configuration does 539
not contribute further. Additionally, the lack of interaction between presence of a secondary task 540
and presence of delineator posts implies that the two effects on driver speed cancel each other out 541
before the curve, because since the secondary task makes drivers slow down before curves, presence 542
of delineator posts increases speed before curves with a large radius. 543
The result that the drivers reduced their speed only when the secondary task was initiated, i.e. 544
before the curve, could be of interest to investigate further. Maybe the drivers had already handled 545
the distraction task before the curve and did not have to concern themselves with the task anymore 546
driving in the curve? Whether drivers have different strategies in handling the distraction task, and in 547
that case, whether speed differs depending on these strategies could also be of interest to examine. 548
Other things to look at could be how the drivers handled the distraction task depending on 549
delineator post configuration and other factors that potentially could affect driver behaviour. 550
5 Conclusions
551The main finding from this study is that as long as there are delineator posts continuously present 552
along the road, the overall driver speed is essentially the same, regardless of how the delineator 553
posts are spaced. Presence of delineator posts will lead to higher speeds than if there are no 554
delineator posts present. 555
29
Curvature of the road affects driver speed and in general, speeds are slower in connection to curves 556
with small radius than with large radius. The results of this study imply that by using more closely 557
spaced delineator posts in curves with a small radius compared to when the curve radius is large, 558
there is a potential to slow down driver speed even more. 559
Another finding was that the speed reducing effect of a secondary task was only prevailing where the 560
task was initiated, when it was initiated before a curve, which implies that the driver is adaptive in a 561
given context. This simulator study does not discriminate between the theories by Wilde, Fuller, 562
Summala and Näätänen but rather confirms what they have in common, that driver behaviour is 563
influenced by environmental factors, such as delineator posts as discussed in this study. 564
6 Acknowledgements
565The authors wish to acknowledge Åsa Forsman at VTI for helpful support concerning the statistical 566
analyses. This paper was funded by the Swedish National Road and Transport Research Institute. 567
References
568Ahlström, C., Bolling, A., Sörensen, G., Eriksson, O., & Andersson, A. (2012). Validating speed and 569
road surface realism in VTI driving simulator III VTI rapport 745A. 570
Bella, F., & Calvi, A. (2013). Effects of simulated day and night driving on the speed differential in 571
tangent-curve transition: A pilot study using driving simulator. Traffic Injury Prevention, 572
14(4), 413-423. doi: 10.1080/15389588.2012.716880
573
Blaauw, G. J. (1985). Vehicle guidance by delineation systems at night. Ergonomics, 28(12), 1601-574
1615. 575
Fors, C., & Lundkvist, S.-O. (2009). Night-time traffic in urban areas. A literature review on road user 576
aspects VTI rapport 650A. Linköping, Sweden: The Swedish National Road and Transport 577
Research Institute. 578
Fuller, R. (2005). Towards a general theory of driver behaviour. Accident Analysis & Prevention, 37, 579
461-472. doi: 10.1016/j.aap.2004.11.003 580
Haigney, D. E., Taylor, R. G., & Westerman, S. J. (2000). Concurrent mobile (cellular) phone use and 581
driving performance: task demand characteristics and compensatory processes. 582
Transportation Research Part F, 3, 113-121.
583
Ihs, A. (2006). The effect of road equipment on traffic safety, accessibility and comfort - A driving 584
simulator study regarding the effect of centre line and guide posts respectively. / 585
Vägutrustningars effekt på trafiksäkerhet, tillgänglighet och komfort - En körsimulatorstudie 586
rörande effekten av mittlinje respektive kantstolpar (in Swedish with English abstract and 587
summary) VTI report 551. Linköping, Sweden: The Swedish National Road and Transport 588
Research Institute. 589
30
Jacobson, P. D., & Gostin, L. O. (2010). Reducing Distracted Driving. Regulation and Education to 590
Avert Traffic Injuries and Fatalities. The Journal of the American Medical Association, 303(14). 591
doi: 10.1001/jama.2010.414 592
Jenkins, S. E. (1991). Optimum spacing of retroreflective raised pavement markers and post-mounted 593
delineators around short radius curves. Paper presented at the CIE workshop, Melbourne.
594
Kallberg, V.-P. (1993). Reflector Posts - Signs of Danger? Transportation Research Record, 1403, 57-595
66. 596
Kircher, K., & Ahlström, C. (2012). The impact of tunnel design and lighting on the performance of 597
attentive and visually distracted drivers. Accident Analysis & Prevention, 47, 153-161. doi: 598
10.1016/j.aap.2012.01.019 599
Lundkvist, S.-O. (2012). Performance Assessment of Road Equipment. State of the Art. VTI notat 19A-600
2012. Linköping, Sweden: Swedish National Road and Transport Research Institute.
601
Nordmark, S., Jansson, H., Palmkvist, G., & Sehammar, H. (2004). The new VTI driving simulator. Multi 602
purpose moving base with high performance linear motion. Paper presented at the DSC
603
Europe 2004. Driving simulator conference Paris, France. 604
Näätänen, R., & Summala, H. (1976). Road-user behavior and traffic accidents. Amsterdam: North-605
Holland Publishing Company. 606
Othman, S., Thomson, R., & Lannér, G. (2010). Are Driving and Overtaking on Right Curves More 607
Dangerous than on Left Curves? Paper presented at the Annals of Advances in Automotive
608
Medicine - 54th Annual Scientific Conference 17-20 October 2010, Las Vegas, USA. 609
Summala, H. (1986). Risk control is not risk adjustment: the zero-risk theory of driver behavior and its 610
implications. Helsinki: Traffic Research Unit, University of Helsinki. 611
Wilde, G. J. S. (2001). Target Risk 2. A New Psychology of Safety and Health. What works? What 612
doesn't? And why... Toronto, Canada: PDE Publications.
613
Young, K., & Regan, M. (2007). Driver distraction: A review of the literature. In I. J. Faulks, M. Regan, 614
M. Stevenson, J. Brown, A. Porter & J. D. Irwin (Eds.), Distracted driving (pp. 379-405). 615
Sydney, NSW: Australasian College of Road Safety. 616
Zador, P., Stein, H. S., Wright, P., & Hall, J. (1987). Effects of chevrons, post-mounted delineators, and 617
raised pavement markers on driver behavior at roadway curves. Transportation Research 618
Record, 1114, 1-10.
619 620 621