This project has received funding from the European Union’s Horizon 2020 research and innovation programme under grant agreement No. 723201
D4.3 Technical report on
the application of the tools
for assessing traffic
impacts of automated
vehicles
Version: 1.0
Date: 2020-04-29
Authors: Johan Olstam, Fredrik Johansson, Chengxi Liu,
Iman Pereira, Charlotte Fléchon, Frank van den Bosch,
Ammar Anvar, John Miles, Jörg Sonnleitner, Paola Tiberi,
Andrea Paliotto
The sole responsibility for the content of this document lies with the authors. It does not necessarily reflect the opinion of the European Union. Neither the EASME nor the European Commission are responsible for any use that may be made of the information contained therein.
Document Control Page
Title Baseline microscopic and macroscopic models
Creator Johan Olstam
Editor Johan Olstam, Fredrik Johansson, Chengxi Liu, Iman Periera
Brief Description Descriptions of the results of the impact assessment for the eight use cases in CoEXist
Reviewers Daniel Franco and Wolfgang Backhaus
Contributors
Johan Olstam, Fredrik Johansson, Iman Pereira, Chengxi Liu, Charlotte Fléchon, Mikael Ivari, Johan Jerling, Nina Galligani
Vardheim, Frank van den Bosch, Brian Matthews, Ammar Anvar, John Miles, Gisa Gaietto, Markus Friedrich, Jörg Sonnleitner, Paola Tiberi, Andrea Paliotto, Antonino Tripodi, Edoardo Mazzia, Adriano
Alessandrini
Type (Deliverable/Milestone) Deliverable
Format Document with supplementary files for experimental design sheets and assessment tool files including results for each use case
Creation date 2020-01-27
Version number 1.0
Version date 2020-04-29
Last modified by Johan Olstam
Rights
Audience
Internal Public
Restricted, access granted to: EU Commission Action requested
To be revised by Partners involved in the preparation of the Deliverable
For approval of the WP Manager
For approval of the Internal Reviewer (if required) For approval of the Project Co-ordinator
Version Date Modified by Comments
0.1 2020-01-22
Johan Olstam Document creation and outline
0.2 2020-02-01 Johan Olstam Draft versions of chapter 1 and 2 and added draft chapters for use case 1,2, and 7
0.3 2020-02-20
Johan Olstam Added input for use case 5,6,7 and 8
0.4 2020-02-27 Fredrik Johansson & Johan Olstam
Added comments after first review of use case chapters
0.41 2020-03-02
Fredrik Johansson Updated case 7 and 8 after input from Jörg
0.5 2020-03-12 Fredrik Johansson, Iman
Pereira and Johan Olstam
Updates on use case chapters and added safety assessment for use case 3 and 4. Revisions based on review comments from Charlotte Fléchon and inputs from Ammar Anvar
0.6 2020-03-17 Johan Olstam and Iman
Pereira Complete draft of the report
0.7 2020-04-17
Paola Tiberi, Andrea Paliotto, Antonino Tripodi, Edoardo Mazzia, Adriano Alessandrini
Added safety inspection-based results
0.8 2020-04-20 Johan Olstam Complete draft of the report
0.9-0.92 2020-04-27 Paola Tiberi, Andreas Paliotto and Johan Olstam
Revision of the safety inspection-based assessment sections
0.93 2020-04-28 Adriano Allessandrini & Charlotte Fléchon
Update on the introduction wrt the two safety assessment approaches
1.0 2020-04-29
Table of contents
1
Introduction ... 8
1.1
Aim ...8
1.2
Report structure ...8
2
The CoEXist assessment approach ... 10
2.1
Overview of the approach used for assessing traffic performance and space efficiency
impacts ... 11
2.2
Overview of the approaches used for assessment of traffic safety ... 12
2.2.1 Overview of the qualitative traffic safety assessment approach ... 12
2.2.2 Overview of the safety inspection-based assessment approach ... 15
3
Traffic impact of automation in use case 1: Shared space ... 18
3.1
Traffic performance and space efficiency ... 18
3.1.1 Parameter settings in the assessment tool ... 18
3.1.2 Results ... 20
3.1.3 Discussion ... 21
3.2
Qualitative safety assessment ... 22
3.2.1 Accident type 1 – Driving accident ... 22
3.2.2 Accident type 2 – Turning off accident ... 23
3.2.3 Accident type 3 – Turning in/crossing accident ... 23
3.2.4 Accident type 4 – Pedestrian accident ... 23
3.2.5 Accident type 5 – Accident with parking traffic ... 24
3.2.6 Accident type 6 – Accident with lateral traffic ... 25
3.2.7 Accident type 7 – Other accident types ... 25
3.2.8 Results ... 26
3.3
Safety inspection-based assessment ... 27
3.3.1 Existing scenario ... 27
3.3.2 Future scenarios ... 45
3.3.3 Comparisons and road safety conclusions ... 52
3.4
Conclusions ... 53
4
Traffic impact of automation in use case 2: Accessibility during long-term
construction works ... 54
4.1
Traffic performance ... 55
4.1.1 Parameter settings in the assessment tool ... 55
4.2
Qualitative safety assessment ... 59
4.3
Conclusions ... 59
5
Traffic impact of automation in use case 3: Signalised intersection
including pedestrians and cyclists and use ... 61
5.1
Traffic performance and space efficiency ... 61
5.1.1 Parameter settings in the assessment tool ... 61
5.1.2 Results and discussions ... 62
5.2
Qualitative safety assessment ... 68
5.2.1 Accident type 1 – Driving accident ... 68
5.2.2 Accident type 2 – Turning off accident ... 68
5.2.3 Accident type 3 – Turning in/crossing accident ... 69
5.2.4 Accident type 4 – Pedestrian accident ... 69
5.2.5 Accident type 5 – Accident with parking traffic ... 70
5.2.6 Accident type 6 – Accident with lateral traffic ... 70
5.2.7 Accident type 7 – Other accident types ... 70
5.2.8 Results ... 70
5.3
Safety inspection-based assessment ... 71
5.3.1 Existing scenario ... 72
5.3.2 Future scenarios ... 85
5.3.3 Comparisons and road safety conclusions ... 98
5.4
Conclusions ... 99
6
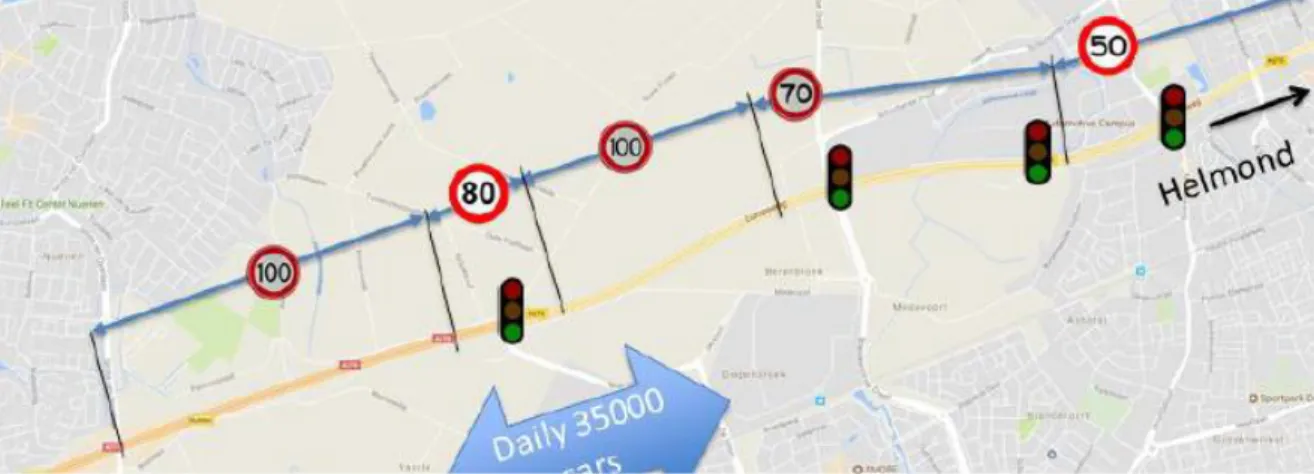
Traffic impact of automation in use case 4: Transition from interurban
highway to arterial ... 101
6.1
Traffic performance and space efficiency ... 101
6.1.1 Parameter settings in the assessment tool ... 101
6.1.2 Results and discussions ... 102
6.2
Qualitative safety assessment ... 110
6.2.1 Accident type 1 – Driving accident ... 110
6.2.2 Accident type 2 – Turning off accident ... 111
6.2.3 Accident type 3 – Turning in/crossing accident ... 111
6.2.4 Accident type 4 – Pedestrian accident ... 111
6.2.5 Accident type 5 – Accident with parking traffic ... 112
6.2.6 Accident type 6 – Accident with lateral traffic ... 112
6.2.7 Accident type 7 – Other accident types ... 113
6.2.8 Results ... 113
6.3.1 Existing scenario ... 114
6.3.2 Future scenarios ... 132
6.3.3 Comparisons and road safety conclusions ... 149
6.4
Conclusions ... 150
7
Traffic impact of automation in use case 5: Waiting and drop-off areas for
passengers ... 152
7.1
Traffic performance and space efficiency ... 153
7.1.1 Parameter settings in the assessment tool ... 154
7.1.2 Results and discussions ... 154
7.2
Qualitative safety assessment ... 164
7.2.1 Type 1 Driving Accidents ... 164
7.2.2 Type 2 Turning off Accidents ... 165
7.2.3 Type 3 Turning in /crossing Accidents ... 166
7.2.4 Type 6 Accidents with lateral traffic ... 167
7.2.5 Type 7 Other accident types ... 168
7.2.6 Results ... 169
7.3
Conclusions ... 171
8
Traffic impact of automation in use case 6: Priority Junction
(roundabouts) Operation ... 173
8.1
Traffic performance and space efficiency ... 174
8.1.1 Parameter settings in the assessment tool ... 175
8.1.2 Results and discussions ... 175
8.2
Qualitative safety assessment ... 180
8.2.1 Type 1 Driving Accidents ... 180
8.2.2 Type 2 Turning off Accidents ... 181
8.2.3 Type 3 Turning in /crossing Accidents ... 182
8.2.4 Type 6 Accidents with lateral traffic ... 182
8.2.5 Type 7 Other accident types ... 182
8.2.6 Results ... 183
8.3
Conclusions ... 184
9
Traffic impact of automation in use case 7: Impacts of CAV on travel time
and mode choice on a network level ... 186
9.1
Traffic performance ... 187
9.1.1 Parameter settings in the assessment tool ... 187
9.1.2 Results and discussion ... 188
9.3
Conclusions ... 193
10
Traffic impact of automation in use case 8: Impact of driverless car- and
ridesharing services ... 194
10.1
Application of the assessment tool ... 195
10.2
Traffic performance ... 195
Vehicle distance travelled ... 195
Number of vehicles needed ... 195
10.3
Qualitative safety assessment ... 196
10.4
Conclusion ... 196
11
Conclusions and lessons learnt ... 197
12
References ... 198
1 Introduction
The many uncertainties related to the introduction of automated vehicles imply a need to for a structured way of assessing impacts for different future development with respect to penetration rates of automated vehicles and mixes of different types of automated vehicles but also for different travel demand levels and behavioural changes of road users. In order to provide a summarized picture of potential impacts for
different stages of coexistence between automated vehicles and other road users an assessment approach was developed (see D3.3 (Pereira et al., 2020) for details). To simplify the assessment and to create a standard way of presenting the results taking uncertainties into account the approach was implemented in one spreadsheet-based tool for assessment of traffic performance and space efficiency and one tool for qualitative safety assessment.
1.1 Aim
The aim of this report is to present the results from applying the tools for assessing traffic impacts of automated vehicles to the simulation outputs of the eight use cases within CoEXist. The aim of the traffic performance and space efficiency tool is to concisely present an assessment of the traffic performance impact of the introduction of automated vehicles, based on the output from models, including the
uncertainties considered. The aim of the qualitative safety assessment tool is to provide rough estimates on how automated driving functions might affect safety for use case relevant accident types. Both of these tools are tested and demonstrated through the applications presented here.
1.2 Report structure
This report is one of several reports describing the evaluation of the traffic impact of automated vehicles for the eight CoEXist use cases. There are in total seven deliverables related to the evaluation of the use cases:
• D1.3 Use case specifications (Olstam and Johansson, 2018a)
• D1.4 Scenario specifications for eight use cases (Olstam and Johansson, 2018b)
• D3.1: Completed experimental design templates for eight use cases and AV-ready alternative design (Olstam, 2018)
• D4.1 Baseline microscopic and macroscopic models (Liu and Olstam, 2018)
• D4.2 Technical report on the application of AV-ready modelling tools (incl. input and output data) (Olstam et al., 2020b)
• D4.3 Technical report on the application of the tool for assessing traffic impacts of automated vehicles
• D3.4 AV-ready hybrid road infrastructure design recommendations • D4.7 Guidelines: How to become an AV-ready road authority?
These reports include documentation at different stages of the specification and evaluation of the use cases. D1.3 and D1.4 presents the use cases and the scenarios at the planning stage. D3.1 describes the more formalised experimental designs based on the measures and uncertain factors described in D1.3 and D1.4. Deliverable D4.1 describes the development of the traffic models for the current situation without
automated vehicles, while D4.2 describes the inclusions of the automated vehicles in the traffic model applications for the use cases and the simulation results. D4.2 will constitute a final report for the traffic modelling and include updated and revised descriptions of the steps documented in the four earlier deliverables, hence D1.3, D1.4, D3.1, D4.1 and can be seen as draft versions of different parts of D4.2 as illustrated in Figure 1. Deliverable D4.3 is a complement to D4.2 with presentation of the results using the tool for assessing traffic impacts of automated vehicles. Deliverable D3.4 will include conclusions on current road designs and tested measures in the eight use cases focusing on the results and not on all the technical details with respect to the traffic modelling. The last deliverable in the bullet list (D4.7) will include summaries of the evaluation of the different use cases from D3.4 and discuss possible implications for the road authorities.
The present report starts with a short description of the assessment approach and the tools developed to structure the assessment and the presentation of the results (section 2). Detailed descriptions of the application of the assessment tools to each use case are presented in section 3 to 10. Conclusions and lessons learnt are presented in section 11.
Figure 1 Structure of deliverables related to the description of the traffic modelling, results and interpretation for the use cases.
Introduction and background (D1.3)
Scope and modelling approach (D1.3)
The network (some from D1.3, but mostly new in
D4.1)
The traffic (some from D1.3, but mostly new in
D4.1)
Verification (D4.1)
Calibration (D4.1)
Validation (D4.1)
Questions to be investigated (D1.4)
Experimental design (D1.4 and D3.1)
Implementation of the alternative designs (D3.1)
Simulation results (D4.2)
Result discussion (D4.2)
Analysis of impact of automation
Conclusions
D4.1
D4.2
D3.1
2 The CoEXist assessment approach
The CoEXist assessment approach consists of two parts:• One assessment approach and a set of tools for assessment of traffic performance and space efficiency
• Two different assessment approaches for estimation of safety effects
The assessment approach for traffic performance and space efficiency (detailed described in D3.3 (Pereira et al., 2020) and in Olstam et al. (2020a)) use the outputs from the automation-ready transport modelling tools (described in D2.11 (Sukennik, 2020) and D2.8 (Sonnleitner and Friedrich, 2020)) as input. The traffic models are applied to a set of consistent experiments with respect to penetration rates and different mixes of AV classes. Initially planned experimental designs are described in deliverable D3.1 (Olstam, 2018) and final experimental designs are described in D4.2 (Olstam et al., 2020b). Relevant performance metrics, presented in deliverable D3.2 (Olstam et al., 2019), are calculated from the model outputs and used to assess the traffic impact of automation with respect to traffic performance and space efficiency for different infrastructure designs. The calculation of these metrics is automated by the tool presented in D3.3.
Two safety assessment methods and tools are introduced to assess potential safety effects of the
introduction of different automated vehicles. The two approaches are described in detail in detailed in D3.3 (Pereira et al., 2020).
The first, a qualitative safety assessment tool, is based upon a thorough review of the advanced driver assist systems (ADAS) functions which will be the building blocks of the lower automation level according to SAE. Using a European accident classification database which describes accidents according to the manoeuvres, the tool gives an indication whether each automation function could have a positive or negative impact to improve safety and applies the results in the different microscopic use-cases of the CoEXist project.
The second, a quantitative method based on the consolidated safety inspection techniques, uses the results of the safety inspection performed on site, which assesses the infrastructural weaknesses of the site safety wise and lists a number of potential interventions to improve it, to consider the effect that the most advanced (SAE level 4 and 5) automated vehicles can have on it. It uses the driving logics defined by the CoEXist project and quantifies the risks related to sites and assesses by comparison whether any problem highlighted for manual driver can be made better or worse by automation and whether new problems could arise. The final output is a comparison of two risk levels in the state of the art and in the design scenario to assess how the designed scenario compares to the state of the art in terms of safety. It also applies to microscopic use-cases.
The two approaches are different and supplementary. First main difference is that the qualitative approach applies to all ADAS functions and not only to fully automated vehicles; the second is that the first is an approach easy to transfer to any site. The second gives a more detailed analyses but requires the
presence on site of a road safety expert to make the initial safety inspection and then applies to the higher automation levels and according to the different driving logics as defined by the CoEXist project.
2.1 Overview of the approach used for assessing traffic performance and
space efficiency impacts
When conducting investigations of the transition period the mixes of different AVs should be taken into consideration. Depending on the assumptions made on the behaviour of AVs the resulting estimate of capacity, delay, travel time, etc. will vary significantly. The transition period is therefore suggested to be divided into a limited set of stages (not defined in terms of specific number of years in the future, but rather by the level of automation). In CoEXist three stages have been defined and are presented in the bullet points below.
• Introductory: Automated driving has been introduced, but most vehicles are conventional cars. Automated driving is in general significantly constrained by limitations (real or perceived) in the technology.
• Established: Automated driving has been established as an important mode in some areas.
Conventional driving still dominates in some road environments due to limitations (real or perceived) in the technology.
• Prevalent: Automated driving is the norm, but conventional driving is still present.
For each use case traffic model runs are conducted for all the combinations of uncertain factors specified by the experimental design and the output is used to calculate the traffic impact of automation, in CoEXist specified as the relative improvement in the performance metrics for each case with AVs and compare it to the baseline without any AVs.
The results from the simulation experiments belonging to the same stage of coexistence can be seen as “samples” of the traffic impact of automation during that stage. The traffic impact of automation at a specific stage is presented in terms of the median, the minimum, and the maximum values for that stage, to
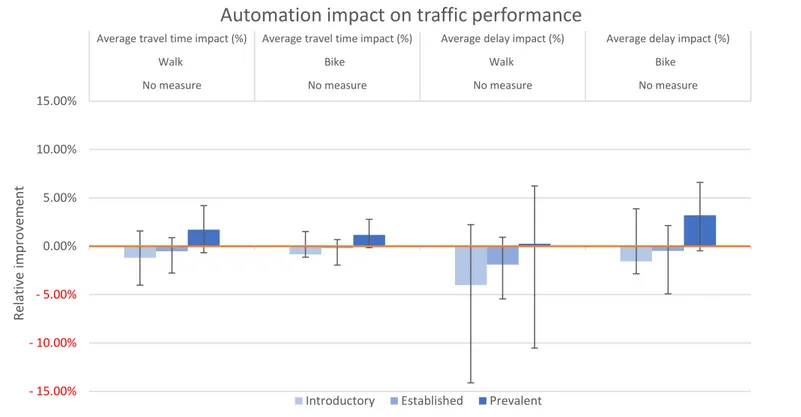
compactly represent the results, including the uncertainty. In order to determine whether the traffic impact of automation is acceptable at a given stage, these values can be compared to the acceptable thresholds defined by the cities or road authorities. An example of how the variation in impact on traffic performance metrics for different stages of coexistence is presented and visualized in the assessment approach is given in Figure 2. The example shows relative improvement in average travel time and average delay; hence a positive value implies a decrease in travel time and delay. The orange bars represent the relative
improvements that can be accepted; in the example no declines can be accepted for pedestrians while some decline can be expected for minibuses and cars. When interpreting these figures it is important to remember that the “error-bars” do not represent confidence intervals but the minimum and maximum relative improvement among all experiments belonging to the same stage of coexistence. For example, if 10 different combinations of penetration rates, AV mixes and traffic demands are considered for the
Introductory stage, the median and the minimum and maximum relative improvement in average travel time for conventional cars are shown as a bar with a lower and upper “error” bar.
Figure 2 Example of visualization of the traffic impact of automation in terms of median, min and max relative improvement for all experiments belonging to the same stage of coexistence. The orange bars represent acceptable thresholds.
2.2 Overview of the approaches used for assessment of traffic safety
2.2.1 Overview of the qualitative traffic safety assessment approach
The approach of the safety assessment is depicted in Figure 3. A complete description of the approach is given in D3.3. The approach relies on evaluating the expected impact of the driving function on accident types in combination with the road environment.
-20.00% -15.00% -10.00% -5.00% 0.00% 5.00% 10.00% 15.00% 20.00% Conventional Car Conventional
Truck Walk Conventional Car
Conventional
Truck Walk
Average travel time Average delay
R el ative Impr ove me nt
Automation impact on traffic performance
Figure 3 Basic approach of the safety assessment tool
Due to the high uncertainty linked with estimating the impact of CAVs on road safety completed with a lack of data, a qualitative impact assessment has been chosen. Furthermore, the accident types – driving functions evaluation contains almost only neutral or positive rating, since it is unexpected that driving functions that are, at least in the long run, jeopardising safety will be brought to the market. The possibility that driving functions enhance the occurrence of some accident type is, however, not excluded and has been identified for very few cases.
The assessment is conducted in 3 steps:
1. Select the relevant type of accident based on facts or educated guesses on which types of accident are recurrent in the area covered by the use case.
2. Select the relevant driving functions – the one of interest for the use case. 3. Display the results.
Detailed description of all considered accident types and driving functions are given in D3.3. There are seven accident categories:
1. Driving accident 2. Turning off accident
3. Turning-in / Crossing accident 4. Pedestrian accident
5. Accident with parking vehicles 6. Accident in lateral traffic 7. Other accident type
Each category is divided into 10 sub-categories (except category 7 and 3 which have 9 sub-categories). This gives in total 68 different accident type categories.
• Level 3
o Traffic jam chauffeur o Highway chauffeur • Level 4
o Parking garage pilot o Motorway pilot o Arterial pilot o Urban pilot • Level 5
o Fully automated private vehicles
The tool gives an indication if a driving function is expected to have a positive, neutral or negative impact on an accident situation for each road environment with the help of the four pictograms shown in Table 1: Table 1 Pictograms used in the road safety impact assessment tool and their meaning
Pictogram
Meaning
The road safety could be negatively impacted
The road safety is not expected to be impacted
The road safety could be positively impacted
The road safety could be very positively impacted
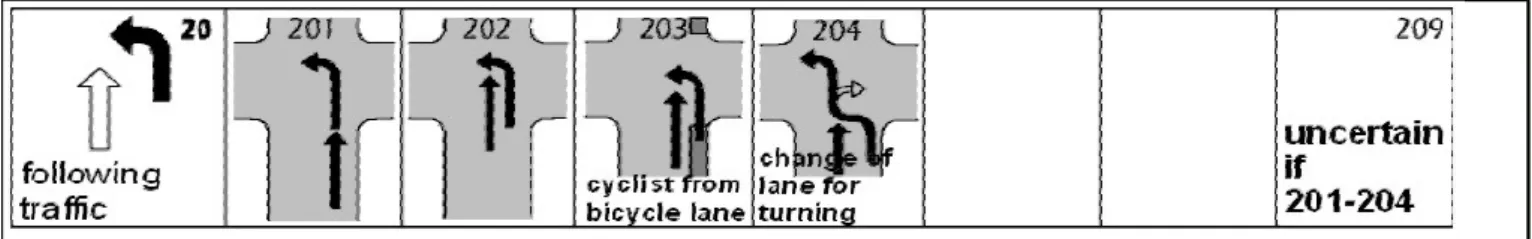
The tool includes a database that contains the information of the influence of the driving functions on each type of accident for each road environment. In the end the tool gives the results in the form shown in Figure 4.
Figure 4 Screenshot of the road safety impact assessment tool Type of
accident Description Sketch
Lane change assist (LCA) Lane departure warning (LDW) Blind Spot Monitoring [VDA] Adaptive cruise control (ACC) Lane keeping assist (LKA) Highway
chauffeur Motorway pilot
Type 10 In a curve
Type 14 On a straight road
Type 23 Conflict between a vehicle turning off to the right and the following traffic
Type 51 Conflict between a vehicle swinging out to avoid a parking vehicle and a following vehicle.
Type 62 Conflict between a veh. wh. Is braking, standing or going slow due to traffic or non priority and a following vehicle.
2.2.2 Overview of the safety inspection-based assessment approach
The approach for safety inspection-based assessment is depicted in Figure 5. A complete description of the approach is given in D3.3. The approach combines the consolidated knowledge of the usual road safety inspections with a new risk assessment of future scenarios where conventional and automated vehicles coexist.
Figure 5 Steps of the safety inspection-based assessment approach The main steps are:
1. Identification and risk assessment of the problems found in the current situation. 2. Identification and risk assessment of expected problems in automated scenarios. 3. Comparison of the risk scores obtained.
Each scenario is defined with a different combination of conventional and automated vehicles, which differ according to their driving logic, i.e. Rail safe, Cautious, Normal and All-knowing. The driving logics follow different principles that define their behaviour which lead to variations in terms of likelihood of occurrence of crashes.
Using the same criteria for assessing the likelihood of occurrence and severity of a potential crash, this methodology gives an indication of the impact of the introduction of automated vehicles on road safety compared to a baseline corresponding to the current situation with all human driven vehicles.
Current situation
•Road safety inspection (site visits and collection of data / information)
•Identify crash risks (also considering "usual" road users' behaviours and crash data, if any) •Recommend road safety improvements
Automated scenarios
•Identify potential crash risks based on automation driving logics (and on current situation) •Recommend road safety improvements for each scenario / penetration rate considered
Comparison
•Compare crash risks identified for current situation and for each scenario •Describe safety changes from current situation to automation scenarios
Conclusions
•Classify automation scenarios based on potential crash risks
The risk value is calculated with the following formulation:
Figure 6 Risk value calculation for each problem
Then the final risk of each scenario is calculated as the sum of the individual risk of each problem (Figure 7).
Figure 7 Process for the computation of the final risk of the use-case
An example of a risk assessment table of identified problems for a specific scenario is shown in the Table 2.
Likelihood value
Weight of
severity Risk value
Final risk of the use-case Risk value nth problem Risk value 2nd problem Risk value 1st problem Sum
Table 2 Risk assessment table for a scenario. F refer to frequency (likelihood of occurrence), S refer to severity and R is the risk value calculated according to Figure 6.
No.
CONVENTIONAL VEHICLES ALL-KNOWING AVs Total
% F S R % F S R R S.1 25 0.4 0.3 0.12 37.5 0.1 0.3 0.03 0.05 S.2 25 0.4 0.3 0.12 37.5 0.1 0.3 0.03 0.05 S.3 25 0.4 0.6 0.24 37.5 - - - 0.06 S.4 25 0.4 0.3 0.12 37.5 0.4 0.3 0.12 0.12 A.1 25 0.7 0.3 0.21 37.5 0.4 0.3 0.12 0.14 A.2 25 0.4 0.6 0.24 37.5 0.1 0.6 0.06 0.11 … … … … TOTAL RISK 0.85
Once the total risk value of each scenario has been obtained, it is possible to represent the risk variation in relation to the change in the percentage of automated and conventional vehicles as shown in Figure 8.
Figure 8 Risk evolution based on AVs scenarios
0.00
0.30
0.60
0.90
1.20
1.50
1.80
2.10
0%
20%
40%
60%
80%
100%
R
isk
%
o
f
veh
ic
le
ty
p
e
3 Traffic impact of automation in use case 1:
Shared space
Use case 1 consists of the area with shared space characteristics in connection to Kungstorget in central Gothenburg, see Figure 9. The definition of shared space varies between countries. In general, a shared space is an area without any clear infrastructure separation of travel modes and where pedestrians and vehicles can move freely, but only at walking pace and with caution. Exact rules differ between countries; in Sweden the formal name is ‘Gångfartsområde’, that is, walking speed area, and all vehicles are limited to walking speed and should give way to pedestrians. Bicycles are included as vehicles in these regulations.
Figure 9 The proposed study site ‘Kungstorget’ and its surroundings. The blue arrows indicate large pedestrian flows that crosses Vallgatan and Kungstorget. The red marked polygon indicates the area of interest and black marked polygon the area included in the simulation model.
The main focus in use case 1 is to investigate the impact that automated vehicles will have on the level of service for all users utilising the area, and to see how sensitive the predicted impact is with respect to assumptions made on the interaction between active modes and AVs and on the assumptions on the behaviour of the AVs. In addition emphasis is also put on identifying in what stage of coexistence it would be feasible to incorporate AVs without any significant drawbacks to the traffic flow of all users in the area.
3.1 Traffic performance and space efficiency
3.1.1 Parameter settings in the assessment tool
The impact of automation is in this use case analysed in terms of the relative improvement of average travel time, average delay, average travel time per distance, and total travel time. Since the travel time per
distance showed no additional information, this metric is not depicted in any of the upcoming figures for this use case. The figures presented in upcoming sections also show the minimum and the maximum value from each stage depicting a potential range of the automation impact.
From a city perspective there is potentially an interest in defining thresholds for when the impact of
automation on the active modes is considered to be unacceptable. These thresholds would be given by the corresponding city; however, no such information exist for this use case.
In the model of the area there are three transport user classes present, cars, minibuses and pedestrians. The main focuses of the use case are the minibuses providing a last mile service which also constitute 50% of the vehicle demand in the model. The entire fleet of minibuses is replaced by minibus (AV) in the three different stages of coexistence. In contrast to the standard approach in CoEXist, to assess the impact of automation as the relative improvement for the remaining non automated road users. As there are no remaining conventional minibuses at any stage of coexistence for minibuses, the impact is evaluated as the relative improvement when replacing the entire conventional minibus fleet with an automated counterpart. The general CoEXist approach is motivated partly by that the value of time of drivers will be reduced when the car is automated, but this is not the case for the minibuses since it is the value of time of the
passengers that is relevant, and that is not expected to be significantly affected by automation. However, the impact of automation on conventional cars is assessed using the standard CoEXist methodology. In addition to the assessment of the impact of automation, an infrastructural measure is also investigated, measure 1: pedestrian crossings. The purpose of implementing pedestrian crossings in the model is to see what effects channelization of pedestrians, and clear walking areas would have on the impact of
automation. In the current design pedestrians cross at any location at Kungstorget. Figure 10 shows where the crossings would be applied limiting the crossing possibilities for pedestrians.
3.1.2 Results
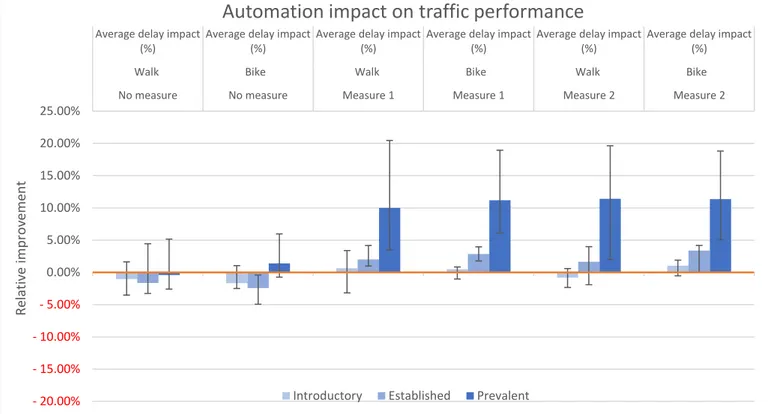
Figure 11 shows the impact that automation has on each transport user class for each stage of coexistence in terms of the chosen metrics. As expected, the automation impact on pedestrians is very limited due to that the pedestrians are given the right of way, and this is assumed to be valid also in the future, see D4.2 for a more extensive discussion on the modelling of this. The pedestrian performance metric affected most is the average delay which varies from -2.4% in the Introductory stage up to -0.81% in the Prevalent stage. The impact of automation on the other pedestrian performance metrics is insignificant.
One of the metrics that is impacted the most by the introduction of AVs is the average delay. The delay for minibuses shows a relative improvement that ranges from -170% to -110% in the Introductory stage and in some case in the Prevalent stage it reaches 3% less delay in comparison to the theoretical conventional minibus fleet. As seen in Figure 11, even though delay could potentially be positively improved the travel time has a median increase of almost 80% in the Introductory stage eventually reaching a median increase of approximately 40% in the Prevalent stage.
Figure 11 Automation impact on traffic performance in terms of average travel time and delay
In the Introductory stage the fleet of conventional cars is intact from today. By changing the entire minibus fleet from manually driven to Basic AV in the Introductory stage we see negative effect on the average travel time and delay for conventional cars; the relative improvement in travel time is approximately -20% and in delay approximately -80%. In the Established stage a proportion of the cars are substituted for Basic AVs and the minibus fleet changes to Intermediate AVs we see a lesser deterioration of the relative
improvements of the travel times and delays, -16% and -69% respectively, finally reaching a level of -6.8%
-180.00% -160.00% -140.00% -120.00% -100.00% -80.00% -60.00% -40.00% -20.00% 0.00% 20.00%
No measure No measure No measure No measure No measure No measure No measure No measure Car Car (CV) Minibus Walk Car Car (CV) Minibus Walk Average travel time impact (%) Average travel time impact (%) Average travel time impact (%) Average travel time impact (%) Average delay impact (%) Average delay impact (%) Average delay impact (%) Average delay impact (%) Re lat iv e im p ro ve m en t
Automation impact on traffic performance
and -47% in the Prevalent stage when an even larger fraction of cars are automated and the minibuses become Normal AVs.
One measure to improve the traffic performance is investigated in this use case: introduction of pedestrian crossings to try to channel the pedestrian flows to cross the street at specific places instead of anywhere. The simulations indicate clearly that this will lead to a breakdown of the vehicle traffic since much of the pedestrian flow across Kungstorget is concentrated to one pedestrian crossing, leading to a continuous stream of pedestrians which completely hinders the vehicle traffic. The impact on traffic performance when implementing the measure is not presented in detail since it is immediately evident from the simulation that the system breaks down when implementing the measure.
3.1.3 Discussion
Discussion, No measureThe impact of automation can be interpreted as large and negative, especially for conventional cars and minibuses in the Introductory stage. However, these transport user classes constitute a small proportion of the total person hours spent in the network. Thus, the negative impact is experienced by a minority of the total traffic on Kungstorget. It could also be discussed whether the negative effect on traffic performance could be desirable from a city perspective due to the potential gains in safety, mainly for pedestrians, due to the lower speed of the vehicles.
Although the relative effect on delay is rather high for conventional cars, the additional delay is only from around 8 s per vehicle in the Prevalent stage to around 14 s per vehicle in the Introductory stage. So, if only short sections of the network have shared space characteristics these delays may be acceptable, but if they constitute a large part of the network an automated last mile service may be infeasible, given the assumed capabilities of the AVs.
The relative change in travel time for conventional cars is much less than that of delay, but this is simply an effect of that the delay is much smaller than the travel time (by necessity), and that the travel time increase for conventional cars due to automation is all delay.
The increase in travel time and delay for both AVs and CVs due to automation derives from two
assumptions. The first is that AVs are assumed to keep the speed limit for shared spaces, 8 ± 2 km/h. This will directly lead to an increase in travel time for AVs due to their lower desired speed and will also affect CVs since these will be hindered by the slow-moving AVs. The AVs will not by definition be delayed by this, since the increase in travel time is due to a decreased desired speed. The CVs on the other hand will incur a delay equal to the increase in travel time. The second assumption is that AVs in the Introductory stage are assumed to keep a much larger safety margin to pedestrians than manually driven vehicles. This implies that they incur more delay in interactions with pedestrians than CVs, and also hinders any CVs that queue up behind them during such interactions. As the stages progress the AVs are assumed to be able to keep a smaller safety margin to pedestrians, and in the Prevalent stage it is assumed that they keep a margin just slightly larger than that of CVs. This leads to similar delays for minibuses in the Prevalent stage as for conventional minibuses in the baseline.
Since the only difference between the base line and the Introductory stage is the automation of the minibus fleet, the difference in average free flow travel time for the minibuses is around 35 s, given by the difference in desired speed of the automated and conventional minibuses. Similarly, the difference in average delay is
around 25 seconds. That is, the speed limit compliance of the automated minibuses has a larger impact on the travel time than the more passive interaction with the pedestrians. This means that the delay is a smaller fraction of the travel time for the automated minibuses, so if the extended travel time due to the low free flow speed feels acceptable for passengers, the delay is unlikely enough to render the last mile service infeasible, at least for the later stages of coexistence.
The result that the traffic performance of the pedestrian traffic is unaffected by the automation may be due to specifics of the design of the study site. At the site vehicle traffic is one-directional going from north-east to south-west and the main pedestrian flow crosses the vehicle traffic stream directly where the vehicles turn into the area with shared space characteristics. This leads to that the, often short, queue that forms upstream of the conflict area is located in an area where no pedestrians are moving. If the main pedestrian flow instead had crossed the vehicle path at a more central point of the shared space, or if the vehicle flows would have been bi-directional or just directed in the opposite direction, the queues of vehicles caused by the interaction with the major pedestrian flow could possibly hinder lesser pedestrian flows crossing the street.
Since Kungstorget is a pedestrian heavy area other, possibly more qualitative factors, such as the attitudes towards automation, could be investigated in order to give a more solid understanding of the potential impact of automation at the site. Such factors are not investigated within the CoEXist project.
Discussion, Measure: pedestrian crossings
The simulation results indicate that the vehicle traffic breaks down completely if the proposed measure is implemented; a significant fraction of the input demand does not leave the network during the study period (SDR<1), indicating severe queueing. In addition to this, pedestrian travel time is slightly increased due to less direct routes through the network. Thus, no further analysis of the results from the simulations of the measure is motivated since the measure clearly worsen the situation.
3.2 Qualitative safety assessment
The upcoming sections show visual illustration of the accident types that are identified as relevant for use case 1. A majority of the relevant accident types involves conflicts between vehicle and pedestrians, which is expected on such a high pedestrian volume area. Accident types involving stationary parked vehicles is also selected due to the taxis that are parked at Kungstorget a majority of the time. Although other accident types are identified as possible to occur, the two mentioned are the main focus of the safety assessment.
3.2.1 Accident type 1 – Driving accident
Accident types classified as a type 1 are single-car accidents. As no conflict has occurred with other
vehicles in this accident type the source of the accident might for example be due to the road condition, not being able to adapt the speed to current conditions, etc. One important aspect for this accident type is the geometry of the road, as it is of interest to know whether the road is straight, swaying, intersection, etc. For use case 1, two potential types of accidents from this category have been identified. A visual depiction of them is shown in Figure 12 and Figure 13.
Figure 12 Accident type 12 turning in or off to another road
Figure 13 Accident type 14 on a straight road
3.2.2 Accident type 2 – Turning off accident
Accident type 2 focuses mainly on conflicts that may occur when vehicles are turning off a road and interact with road users from the same or opposite direction. The listed accident types are mainly related to vehicle to vehicle interaction but also cyclist and pedestrians are considered. In the vehicle and pedestrian conflict listed for this accident type it is stated that the pedestrian would be crossing on a special path/track
meaning a zebra crossing. There are formal zebra crossings at Kungstorget but there exists at least one informal zebra-crossing of type 241 and 242 as illustrated in Figure 14.
Figure 14 Accident type 24 Conflict between a vehicle turning off to the right and a veh. From a special path/track or a pedestrian moving in to the same or opposite direction.
3.2.3 Accident type 3 – Turning in/crossing accident
Accident type 3 covers conflicts that mainly occurs at intersections between road users with priority and non-priority road users. Even though there are some minor intersection-like areas at Kungstorget the number of vehicle to vehicle interaction is considered to be insignificant and is not include as a potential conflict, especially since vehicle speeds in the area is low (15 km/h or lower). For the reason mentioned accident type 3 was considered irrelevant for use case 1, with exception for accident type 30 (.
3.2.4 Accident type 4 – Pedestrian accident
Accident type 4 includes accidents between pedestrians and vehicles related to when pedestrians are crossing the road in one way or another. That is accidents that could potentially occur on the road and not by a vehicle intruding on a designated pedestrian area, such as sidewalks or strict walking areas. As the
main transport user class in use case 1 are the pedestrians, most of the accident types presented in this category are identified as relevant for use case 1. A selection of them are presented in Figure 15 to Figure 17.
Figure 15 Accident type 40 Conflict between a pedestrian coming from the left and a vehicle. No Junction
Figure 16 Accident type 44 Conflict between a pedestrian coming from the left and a vehicle which had an obstructed line of sight by parking vehicle, tree, fence. Before a junction
Figure 17 Accident type 49 Conflict between a vehicle and a pedestrian crossing a junction diagonally or getting on/off a tram. As well as other pedestrian accidents. Behind a junction
3.2.5 Accident type 5 – Accident with parking traffic
Accidents which may occur with parked vehicles, or vehicles manoeuvring to park are considered under accident type 5. At Kungstorget there is a road section that functions as a parking area for taxis and is frequently utilised during the day. Their presence at Kungstorget are the justification of selecting potential conflicts from this category. A selection of relevant sub accident types are depicted in Figure 18 to Figure 20.
Figure 19 Accident type 53 conflict between a vehicle swinging out to avoid a parking vehicle and a pedestrian.
Figure 20 Accident type 54 conflict between a vehicle which is stopping to park or entering a parking space and a vehicle of the moving traffic.
3.2.6 Accident type 6 – Accident with lateral traffic
Accident type 6 would mainly consider lateral conflict in vehicle to vehicle interaction. Although vehicle volume during peak hour is low at Kungstorget, there is a risk of vehicle to vehicle conflicts. In addition, accident type 6 also covers conflicts between vehicle and pedestrian on the same lane, which is most relevant for use case 1. A selection of the selected accident types within this category are illustrated in Figure 21 and Figure 22.
Figure 21 Accident type 60 conflict between a vehicle and another vehicle driving in front on the same lane.
Figure 22 Accident type 67 conflict between vehicle which is not overtaking and a pedestrian on the same lane.
3.2.7 Accident type 7 – Other accident types
Accident type 7 is the last category and covers the more unusual accident types e.g. accidents with animals, or accidents that would occur due to sleepiness, or dizziness, etc. In general accident type 7 covers accident types that cannot be assigned to any of the accident types 1-6. Accident type 7 was
deemed irrelevant for use case 1 as there’s very little traffic during nights, and animal activity is non-existent at the site.
3.2.8 Results
The results from the qualitative assessment tool are presented in Table 3. The table show to what extent and for how many accident types the relevant driving functions might imply negative, none, positive or very positive impact on safety. The interpretation of the pictograms are given in Table 1 in section 2.2.1. For this use case which mainly include a shared space environment 27 of the 68 sub-accident types have been considered to be relevant. The results are shown for the urban pilot and the parking (garage) pilot which are the automated driving functions that are predicted to be the ones required for level 4 automated driving in a shared space.
For the shared space environment in use case 1 the urban pilot is estimated to have largest impact on accident type 4 – pedestrian accidents and type 5 – accident with parking vehicles. For accident type 4 the urban pilot imply positive (and sometimes very positive) safety impact for 9 of 10 sub-accident types. For type 4, accident type 40 and 43 are the only two accident types with pedestrian involvement where safety could potentially be impacted very positively. Both these accident types include conflicts where there’s a sight obstruction for the vehicle and as AVs drive in areas where sensors sight is obstructed they might take extra precautionary measures in order to be able to stop suddenly. For accident type 5 the estimated impact is very positive for a majority of the sub-accident types. For the other types of accidents the urban pilot might imply positive impact in some categories but is considered irrelevant for most of the sub-accident types.
As expected, the parking (garage) pilot the is not expected to have much of an impact on the safety for most of the relevant accident types for use case 1. However, for accident type 50 and 70, which are both conflicts involving parking vehicles, there’s an indication of improved safety. As for all the other accident types considered in use case 1, there’s an expectation of a positive impact on the safety by utilising an urban pilot.
Table 3 Qualitative safety assessment for use case 1 – shared space. The numbers show in how many sub-accident categories the driving function is estimated to imply negative, none, positive or very positive impacts on safety. Grey marked cells are accident categories that are considered irrelevant for the driving function in the use case.
Type of accident Urban Pilot Parking (Garage) Pilot
1 Driving accident 2
2 Turning off accident 2
3 Turning-in / Crossing accident 2 4 Pedestrian accident 7 2
5 Accident with parking vehicles 1 6 4 1
6 Accident in lateral traffic 4
7 Other accident type 1 1
3.3 Safety inspection-based assessment
This section presents the results of the safety inspection-based assessment considering the crash types and wrong manoeuvres relevant for use case 1. Three scenarios were considered based on automated vehicles penetration rates and mix of AV classes / driving logics. For each scenario, the crash frequency and severity was estimated and the risk calculated (see section 2.2.2 for an overview and Deliverable 3.3 for details on the methodology). Finally, the risk for the various scenarios was compared.
3.3.1 Existing scenario
A Road Safety Inspection (RSI) was carried out to assess the existing road safety conditions on the site for use case 1.
A visit to the site (by a team of experts) was done in January 2020, both in daytime and night-time. To facilitate the collection of information during the inspection, the following tools were used:
• Nextbase 612GW camera with integrated GPS
• Application ASIA1 (installed on a smartphone) to quickly note road safety problems and their location
during the inspections
The site was inspected and a report of those matters that may have an adverse effect on road safety was compiled. The inspection did not include any examination or verification of the compliance with any other standard or criteria. All of the issues highlighted in this report are considered by the safety inspection team to require action in order to improve the safety of the area and minimise collision occurrence. Each item identified in the inspection is outlined below, together with recommendations to mitigate the issue in question.
Background information
Description of the site
This shared space is an area in the city centre of Gothenburg, in Sweden. An overview of the area is shown in Figure 23. This square is highly used by pedestrians and cyclists, but also by few vehicles and trucks. Around the square there are several commercial activities leading to high mobility flows during all hours of the day. The vehicle driving speeds are very low, between 8 and 15 km/h.
Figure 23 Use Case 1 - Kungsportsplatsen boundaries (source: elaboration on Google Earth)
Road traffic crash analysis
This area does not have a high number of recorded road traffic crashes, probably due to the fact that the speeds are very low and that few vehicles use the shared space. The road traffic crash data recorded over the last five years (2015-2019) showed only three collisions in which motorised vehicles were involved. One collision occurred between two cars, when one of them did not follow the yielding regulations. The other
1 ASIA (Assistant for road Safety Inspections and Audits) is an application developed by FRED Engineering (www.fredeng.eu) for Android with the aim of maximizing the effectiveness of road safety audits and inspections
Avalon
two collisions occurred between a car and a pedestrian. In addition, two falls of cyclists alone have been recorded. In all these cases, there were only minor injuries. Figure 24 shows a map with the location of the recorded road traffic crashes.
Figure 24 Use Case 1 - Location of crashes
Even if the road traffic crash analysis does not show relevant results, it does not mean that the site is risk-free. In fact, the objective of the road safety inspection is specifically to identify those dangerous elements that could lead to crashes, even if they have not occurred before. Thus, it is important to specify that the results of the road traffic crash analysis and the results of the road safety inspections are not directly correlated (EuroRAP, 2020), hence:
A crash is a rare event that occurs due to one or more interacting factors, but the risk of a crash due to road-related problems is always present.
Traffic flow analysis
The latest available data on vehicle traffic flows for the site refer to 2011. The annual average daily traffic (AADT) was equal to 2,300 vehicles in one direction (Figure 25).
Figure 25 Use Case 1 - Annual average daily traffic (2011) (source: statistik.tkgbg.se) Collision
level
Risk level from road safety inspections Vehicle – pedestrian
Vehicle – vehicle Cyclist alone
These data are quite old, but some hourly measurements were made in 2018 in different cross sections and directions. Table 4 shows the vehicle count over the cross sections. The directions of the observed vehicles are seen in Figure 26, marked by the arrow on each cross section.
Figure 26 Use Case 1 Cross sections and direction of counted vehicles
Table 4 Use Case 1 - Cross sectional vehicle counts
Cross section Vehicle counts
(veh/h) 1 35 2 3 3 38 4 12 5 50
The daily average pedestrian flow measured between Wednesday 14th - Sunday 18th of November 2018 is shown in the map below, referring to values in the red ellipse (Figure 27). From this data it is evident that in this area one of the highest pedestrian flow compared to the whole center of Gothenburg is registered.
1
2
3
5
4
Figure 27 Use Case 1 - Daily average pedestrian flow (measured with wi-fi-data)
The hourly flow of pedestrians through different sections was also measured. For each cross section, the two opposite directions of the pedestrians are seen in Figure 28 and Figure 29. Table 5 and Table 6 show the pedestrian counts over the cross sections and the considered directions. The sections through which the highest flows were recorded are highlighted in red.
Figure 28 Use Case 1 - Cross sections and direction of counted pedestrians (a)
1
2
3
4
5
6
7
8
9
10
11
Table 5 Cross sectional counts of pedestrians
Cross section Pedestrian counts
(ped/h) 1 332 2 614 3 490 4 387 5 194 6 479 7 864 8 423 9 322 10 139 11 141
Figure 29 Use Case 1 - Cross sections and direction of counted pedestrian (b)
1
2
3
4
5
6
7
8
9
10
11
Table 6 Use Case 1 - Cross sectional counts of pedestrians
Cross section Pedestrian counts
(ped/h) 1 233 2 542 3 446 4 155 5 158 6 321 7 470 8 243 9 286 10 152 11 187
From the two maps it is clear that the highest flows are recorded in cross sections 2, 3 and 7, in both directions. Although the vehicle flow is significantly lower than the pedestrian one, its higher values are recorded in section 6 and in the perpendicular direction to the flow of section 2 where continuous road crossings take place so the likelihood of pedestrian-vehicle conflicts is the highest.
Road safety assessment
This section presents the results of the inspection.
In particular, it summarises the road safety problems identified, their location, the probable/typical accident (in the form of an icon) that they may cause, the recommendation to eliminate or mitigate them, and finally, their risk value.
All problems are identified with a code composed of a literal part,
representing the category of problems and a numerical part, representing the sequential number.
Road signs
In a shared space there is normally minimal signage because pedestrians represent the strong user and vehicles must give them priority and cross carefully without generating danger to them.
However, the absence at some points of road signs for the vehicles could lead them to carry out unauthorized manoeuvres, thus endangering vulnerable users.
Details are shown in the following table.
No. Location Problem Crash
type Recommendation Risk
S.1 Kungsportsplatsen Misleading path of the road
Coming from Vallgatan to the square, the configuration seems to allow drivers to enter the square where in fact vehicles are not authorized.
The effect is accentuated at night, in winter, when the streetlights illuminate the square more than the road that turns right.
Furthermore, there are no signs indicating that vehicles must turn right and there are no obstacles that block the passage.
It is recommended to place physical obstacles to avoid the transit of vehicles on the square.
In addition, it is recommended to install a right-hand turn sign.
No. Location Problem Crash
type Recommendation Risk
Especially during the summer, when there is a very high density of pedestrians and cyclists passing through the square, the mistaken crossing of it by vehicles could lead to a high likelihood of conflicts with vulnerable users who do not expect vehicles on that space.
S.2 Östra Hamngatan- Kungsportsplatsen
Manoeuvre not allowed
On Östra Hamngatan along the edge of the square, there is a parking space for motorcycles that during some hours of the day is empty and although there is the sidewalk slightly raised compared to the road, some vehicles (more likely heavy trucks) turn right going up to the square.
It is recommended to place physical obstacles to avoid this manoeuvre.
No. Location Problem Crash
type Recommendation Risk
There may be pedestrians or cyclists on the square who do not expect a vehicle to arrive from that direction and conflicts may arise.
S.3 Kungstorget Vehicle path unclear
Coming from Södra Larmgatan and going along Kungstorget, it seems that it is allowed to go straight on the square whose step is very flat.
The effect is accentuated at night because the blocks further ahead cannot be seen and during winter when
It is recommended to place physical obstacles to avoid the transit of vehicles on the square or to increase the step between the square and the street to make the difference of spaces more visible. In addition, it is recommended to install a right-hand turn sign.
No. Location Problem Crash
type Recommendation Risk
there are no tables in the square outside of the restaurant.
Furthermore, there are no signs indicating that vehicles must turn right and there are no obstacles on the edge of the square that block the passage.
Pedestrians and cyclists passing through the square do not expect the passage of vehicles that may have mistakenly crossed the square. It is likely that crashes involving vulnerable users will occur.
S.4 Intersection
Vallgatan - Kungstorget
Signs not clearly visible
At the intersection between Vallgatan and Kungstorget, in front of the hotel, vehicles could not turn left.
This is indicated on two small signs that are not clearly visible to a driver who is still on Vallgatan.
Only after wrongly turning left, it is possible to see the two signs shown in the picture indicating the forbidden transit for vehicles and motorcycles, but they are partially covered by the bikes or e-scooters that are parked in front of them.
It is recommended to install a right-hand turn sign on Vallgatan on the corner of the Avalon hotel and to move the two signs so that they are visible before making the left turn and make them more visible using a higher support structure.
No. Location Problem Crash
type Recommendation Risk
This leads to reversing or U-turning manoeuvres with limited visibility which are very dangerous due to the high presence of vulnerable users who do not expect such manoeuvres and could be involved in a crash.
Roadsides
Roadside obstacle, whether fixed or derived from unappropriated vehicles stops, could lead to risks both for vehicles and pedestrians.
Details are shown in the following table.
No. Location Problem Crash
type Recommendation Risk
RS.1a Intersection
Vallgatan - Kungstorget
Obstacle on the road
Along Kungstorget, the sign indicating to turn left on Vallgatan for all vehicles except bicycles is placed on the road and seems to be a temporary sign.
The base of the sign is an obstacle for vehicles passing through the intersection and may be hit because there is not much space for two vehicles to meet side-by-side. It can also cause vehicles to divert into the opposing lane because of a sudden steering or a sudden brake. The obstacle is also potentially dangerous for bicycles.
It is recommended to replace the temporary sign with a permanent one or in the meantime to place it outside the roadside.
No. Location Problem Crash
type Recommendation Risk
RS.1b Intersection
Vallgatan - Kungstorget
Obstacle on the road
As RS.1a.
It is recommended to replace the temporary sign with a permanent one or in the meantime to place it outside the roadside.
0.01
RS.2 Kungsportsplatsen Blocked roads due to truck operations
The passage of trucks in the area around Kungsportsplatsen for the unloading of goods and for garbage removal is allowed from 5 to 11 a.m.
However, around 8:00 a.m., a high concentration of trucks (mostly heavy trucks) often block the roads completely. This leads to reversing or U-turning manoeuvres with limited visibility.
The time period from 7:00 to 9:00 is also one of the pedestrian peak hours during weekdays.
The high presence of vulnerable road users, who could not expect reversing or U-turning manoeuvres, could be dangerous and lead to crash.
It is recommended to increase police enforcement in order to minimise these situations, trying to not block the transit of vehicles during unloading of goods. In the medium-long term, policies for goods delivery should be revised, for instance by prioritising use of smaller trucks or by revising the time period for good delivery (different from peak hours).
No. Location Problem Crash
type Recommendation Risk
RS.3 Kungsportsplatsen Dangerous manoeuvres due to truck congestion
When trucks block the passage along the road, some dangerous manoeuvres are carried out to avoid them. Many vehicles, also including other trucks, use the sidewalks to cross the obstacle.
A person exiting a shop along the sidewalk or a pedestrian that overtake the truck on the road may not be seen by the vehicle and may be run over.
It is recommended to increase police enforcement in order to minimise these situations, trying to not block the transit of vehicles during unloading of goods. Poles on sidewalk preventing the vehicles to drive on it are also recommended.
No. Location Problem Crash
type Recommendation Risk
RS.4a Kungsportsplatsen Entering from Taxi Parking
The manoeuvre should generally not create any problems, however sometimes an inattentive driver can enter the road and cause a minor accident.
Increase the space between the parking lot and the lane so that approaching vehicles can better understand if a taxi is leaving the parking lot.
0.03
RS.4b Kungsportsplatsen Entering from Taxi Parking
As RS.4a.
Increase the space between the parking lot and the lane so that approaching vehicles can better understand if a taxi is leaving the parking lot.
Conflicts with crossing vulnerable road users
As a shared space, one of the main safety problems observed in use case 1 is conflicts with crossing pedestrians and cyclists. Because of the absence of confined space for crossings (i.e. pedestrian zebra crossings), pedestrians (and cyclist) could cross the road spaces in every points of the square. This means that drivers must pay attention continuously to the road margins and being ready to brake.
To face this problem, the administration imposed a very low speed limits of 8 km/h in the square area. The speed limit on the other roads are higher but the actual speed of drivers lies around 15 km/h.
No. Location Problem Crash
type Recommendation Risk
C.1a Intersection
Vallgatan - Kungstorget
No confined spaces for pedestrians crossing
Pedestrians and cyclists can cross the road in every point of the square with the risk to cross in front of a vehicle that is not able to react in time.
Check that drivers follow the speed limits and, in case not, think about speed reduction-based countermeasures (traffic -calming
countermeasures).
0.42
C.1b Intersection
Vallgatan - Kungstorget
No confined spaces for pedestrians crossing
As C.1a.
Check that drivers follow the speed limits and, in case not, think about speed reduction-based countermeasures (traffic -calming
countermeasures).
Road Safety Inspection summary
It is important to highlight that the risk value themself obtained from the risk formulation is of minor importance here, and it is the comparison of the final risk scores obtained for the current situation and the scenarios with automated vehicles of the same use case that is of main interest in the assessment.
Ref. Items resulting from Inspection Recommendations Risk value
S.1 Misleading path of the road Installation of physical obstacles and a right-hand turn sign 0.42
S.2 Manoeuvre not allowed Installation of physical obstacles 0.24
S.3 Vehicle path unclear
Installation of physical obstacles or increase of the step between square and road and installation of a right-hand turn sign
0.42
S.4 Signs not clearly visible Increase the visibility of signs and installation of a
right-hand turn sign 0.21
RS.1 Obstacle on the road Removal of sign from the road 0.04
RS.2 Blocked roads due to truck operations Increase police enforcement and revision of policies for
goods delivery 0.07
RS.3 Dangerous manoeuvres due to truck operations Increase police enforcement and installation of poles on
sidewalk 0.24
RS.4 Entering from Taxi Parking Increase the space between the parking lot and the lane 0.04
C.1 No confined spaces for pedestrian crossing Check for speed limits compliance and eventually improve
traffic calming countermeasures. 0.43