OVERCOMING CAPITAL CONSTRAINTS
AND CHALLENGES OF FAST GROWTH
AS AN IT SME
Master’s Thesis within Business Administration
Author: Andreas Helmersson
Tutor: Anders Melander
Fredrik Lundell Jönköping May 2010
Master’s Thesis in Business Administration
Title: Overcoming Capital Constraints and Challenges of Fast Growth as an IT SME.
Author: Andreas Helmersson
Tutor: Anders Melander, Fredrik Lundell
Date: 2010-05-21
Subject terms: Capital structure, capital constraints, financing growth, effects of growth, SME’s, lending techniques, trade credit, financial gap.
Abstract
Problem: High wage countries depend on SME's to lower unemployment, to trigger economic growth and to utilize the 'knowledge waste' created by large investments in human capital. However, due to their limited ac-cess to capital markets SME's are seen as unfavourably dependent on their own generation of internal funds to grow. Among SME's, IT firms are seen as most representative for this struggle, since they have i) a bad reputation within the public and institutional sector due to the dot-com era, and ii) assets with low collateral value (e.g. immaterial as-sets, human capital, knowledge, prototypes and ideas that all have un-known, unsecure and hard to predict second-hand or future values). Despite these unfavorable characteristics, some IT firms are growing considerably fast. What can we learn from them?
Purpose: Describe the financial situation of IT SME's. Investigate how those IT firms that are fast growing have grown and financed their growth, and how they have managed the effects of growth.
Method: Due to the nature of the purpose a mixed method research approach was adopted. The quantitative investigation aimed at describing their fi-nancial situation and took the form of a statistical analysis of the entire IT firm population, using data from the Swedish database 'Affärsdata'. The qualitative approach took the form of telephone interviews with a sample of fast growing IT firms, to get closer to the reasoning behind their growth and it’s financing. This research approach enabled cross referencing, strengthening some of the empirical evidence found. Conclusion: Evidence was found on IT firms growing with assets of less collateral
value resulting in low amounts of long term debt. Indications were found on the traditional life cycle perspective regarding SME finance has to be changed to fit IT firms; after surviving the first years of inter-nal funding and years of overdependence on short term debt, they reach a stage (e.g. in a financial crisis, facing international expansion, or substantial R&D costs) when financial assistance is needed. Indications were also found on IT firms operating in a highly unpredictable envi-ronment demanding advanced cash management routines that today are not prioritized in favor of growth. To handle this, and to reach fi-nancial assistance when needed (most likely by involving a risk capital-ist in exchange for firm ownership), those firms showing stability (i.e. through low personnel turnover, high profitability or a large cash buf-fer) seem to have been more successful.
Table of Contents
1
Introduction ... 1
2
Problem statement ... 2
3
Theoretical framework ... 3
3.1 Financial situation ... 3
3.2 SME growth and its financing ... 5
3.2.1 Growth strategies ... 5
3.2.2 Growth rate ... 6
3.2.3 Growth financing ... 6
3.2.4 Lending technologies ... 7
3.3 Managing the effects of growth ... 8
3.3.1 Cost of growth... 8
3.3.2 Flexibility ... 9
4
Method...10
4.1 Abductive method ... 10
4.2 Mixed method approach ... 10
4.3 Financial situation ... 11
4.3.1 Data collection. ... 11
4.3.2 Data analysis ... 11
4.4 Growth, it’s financing and possible effects of growth ... 12
4.4.1 Sampling ... 12
4.4.2 Data collection ... 13
4.4.3 Data analysis ... 13
4.5 Problems and weaknesses ... 13
5
Findings and analysis ...14
5.1 Financial situation ... 14
5.2 Growth and its financing ... 15
5.2.1 Normal versus fast growth rate ... 16
5.2.2 Airtech ... 16
5.2.3 FrontLine ... 17
5.2.4 JAVAtec ... 18
5.2.5 Effectnet ... 19
5.2.6 Discussion... 21
5.2.6.1 Research and development ... 21
5.2.6.2 Trust capital ... 22
5.2.6.3 Life cycle perspective... 22
5.3 Managing the effects of growth ... 23
5.3.1 Airtech ... 23 5.3.2 FrontLine ... 24 5.3.3 JAVAtec ... 24 5.3.4 Effectnet ... 25 5.3.5 Discussion... 26 5.3.5.1 Personnel... 26 5.3.5.2 Cash management ... 26
5.3.5.3 Dynamic economy of today ... 27
5.3.5.4 Generation of internal funds. ... 27
6
Conclusions ...29
7
Evaluation and further research ...30
List of references ...31
Models
Model I Life cycle perspective of the IT firms... 23 Model II Cash management with and without long term debt ... 27
Tables
Table I IT firms versus metal firms ... 15 Table II IT firms growing at a normal rate versus a fast rate ... 16 Table III Numerical data ... 20
Appendices
Appendix I: Problematic characteristics ... 35 Appendix II: Variables ... 36
1
Introduction
Small and medium sized enterprises (SME's1) compose 99, 9 % of all companies in Sweden (Statistics Sweden, 2009), and is considered a main driver of employment and growth not just in Sweden but for the entire European region (Swedish ministry of Industry, Employ-ment and Communication, 2009; EIM 2009). In the European Union, 2002 – 2007, SME's accounted for 67 % of total employment and contributed to 84 % of all employment growth (EIM, 2009). However, their contribution to labour productivity (value added) is lower than their contribution to employment. Cold fact that can be explained by the aver-age SME being too small to capitalize on economy of scale, that its personnel is not as qualified, or that it is less capital intensive (EIM, 2009). It is therefore imperative that focus is set on realising and exposing these limitations, not only in Sweden but for most Euro-pean countries with focus on education, research and development, and knowledge as competitive advantages. SME's are the key in the pursuit of actually capitalizing on these investments, and faster change into a knowledge-based economy. Since large companies cannot utilize all the human capital produced today it leads to a significant waste. However, SME's have the capacity to step in, and to lower unemployment and trigger stagnant eco-nomic growth. They just need more capital in order to attract qualified personnel that can form as basis for growth (EIM, 2009). In addition, the European Union have acknowl-edged the ability to stimulate SME growth as the main driver of European prosperity. In-corporated as a primary goal within the Lisbon strategy (2000) and further outlined in the member states policy framework 'Small Business Act for Europe' (2008) the work to in-crease SME access to credit has clearly began.
However, the emergence of political schemes like these is, at least from an external perspective, a late awakening to a well known problem. SME's have historically always en-countered resistance when trying to obtain capital from external actors (McMillan Commit-tee on Finance and Industry, 1931; Wilson CommitCommit-tee, 1979), giving rise to the expression 'financial-gap'. A firm facing this gap is said to have made maximum use out of short-term finance, without being big enough to access the long-term finance from capital markets. Due to the high fixed cost and an institutional unwillingness to take small holdings, small firms are also viewed as prohibited from making new issues. Regarding debt finance, banks seem to limit their lending to the short- to medium term and only giving access to smaller amounts for higher charges (Fazzari, Hubbard, Peterson, 1988; Keasey and McGuinness, 1990). From an outside perspective, small firm growth seems to be heavily dependent on the reinvestment of annual free cash flow.
As of today, decades later, the very same issues appear to reflect and aggravate the fi-nancial situation of the SME's. They still experience a lack of external finance, and feel re-stricted and strained in their operations and growth (Berger and Udell, 1998). As shown by Beck et al. (2004) they also use less bank finance, development finance, and equity, but more informal sources of finance like friends and family. These results confirm what has been known for years, that smaller firms meet higher costs since they in general are more volatile and can offer less collateral. A year later (2005) the same authors also found that SME's are severely affected by these financial constraints, resulting in twice the negative ef-fect on growth as compared to larger firms with similar difficulties.
The dynamic economy of today makes it even worse for SME's. Although not yet scientifically proven it is safe to say that the recent financial crisis have negatively affected
1 SME is defined as a company with between 0 – 249 employees, and a sales turnover between 0 –
SME's access to capital (EIM, 2009). Due to their difficulties in entering the capital markets and, consequently, heavy reliance on bank finance, they have become vulnerable to credit crunches and recessions. 'Such difficulties could affect not only weak companies without cash buffers,
but also healthy companies that will find themselves facing a sudden shortage or even unavailability of credit'. Fast growing SME's will inevitably, due to over reliance on short term debt, also
in-crease the risk of illiquidity. EIM (2009) especially emphasize the importance of researching fast growing SME's, since 'they are important tools to reach the goals set in the frame of Lisbon
agenda'.
2
Problem statement
We can see the extent to which countries, especially high wage countries, depend on SME's to lower unemployment, to trigger economic growth and to utilize the 'knowledge waste'. However, due to their limited access to capital markets SME's are seen as unfavourably de-pendent on their generation of internal funds to grow. It is also apparent that SME's are severely affected by these capital constraints, and that fast growing companies (perhaps the most important group) are facing high risks of illiquidity. In this paper, focus will be set on small and medium sized IT firms2, identified as most representative for the SME financial struggle, and as having potential to become a major contributor towards this particular de-velopment of knowledge based economic growth (Oakey, 1993; Jones-Evans and West-head, 1996). The reasoning behind assuming that IT firms have severe difficulties with ob-taining external finance is not only relying on their size, but most due to the following cha-racteristics3: IT firms have i) a bad reputation within the public and institutional sector due to the dot-com era, and ii) assets with low collateral value (e.g. immaterial assets4, human capital, knowledge, prototypes and ideas that all have unknown, unsecure and hard to pre-dict second-hand or future values) found to be negatively correlated to debt (Asgharian, 1997).
However, despite displaying these problematic features there are some companies that manage to obtain sufficient financing to enable a fast growth (Business Region Göte-borg, 2009). Not only does it seem they are obtaining finance against all odds, but their growth and profitability is as vital for their own long term survival as for European pros-perity. According to Davidsson (2005) the crucial relationship between these two factors, growth and (growing with) profitability, is surprisingly almost a forgotten one within re-search. Hence attention must be put on trying to unravel the effects of fast growth and analyze how these best can be managed. Maybe we can learn something from these firms; spot common obstacles or successful strategies in their growth process and it's financing?
Seeing that IT firms and their financial constraints is a seemingly untouched research area, and for this paper not to rely on assumptions, their financial situation first needs to be described. Subsequently, this research intends to investigate how fast growing5, small and
2 In this paper IT firms are identified as computer consultants and computer programmers
accord-ing to the Swedish Business Index (SNI).
3 For a more comprehensive description of these problematic features and the reasoning behind it
see Appendix I.
4 Immaterial assets are defines as 'identifiable non-monetary assets without physical substance used for production or supply of products or services' (Swedish Accounting Council).
5 In this paper a fast growing company is defined as realizing at least 20 % average annual growth
medium sized IT firms finance their growth and manage its effects. Overall, in contrast to conventional capital structure and growth research, this study will not emphasize the past and consider growth as the end goal by searching for factors that solely foster or hinder it. Instead focus will also be set on unfolding common success factors or challenges that come with the process of growth and it's financing in the dynamic economy of today – a process that possibly could be a sporadic and continuously changing firm strategy. Conse-quently, the purpose of this study is to:
Describe the financial situation of IT SME's (financial situation).
Investigate how those IT SME's that are fast growing have grown and financed their growth (growth and its financing).
Investigate how those IT SME's that are fast growing have managed the effects of growth (managing the effects of growth).
The three headings displayed in parentheses after each bullet point above will guide you through the remaining parts of the study.
3
Theoretical framework
To show some of the possible determinants of firms' capital structure, further describe why SME's face a more problematic financial situation, and describe some of the benefits and costs with different financial choices, capital structure theory is being adopted. This par-ticular body of literature was originally a result from studies on large manufacturing com-panies (Ang, 1991), but has during the last two decades also been exposed to thorough test-ing and consequently supplemented to fit an SME reality. Below the development of this particular literature is described, only considering the main contributions with emphasize on SME's.
However, whilst capital structure analysis reflects past aggregated data at a moment in time, it has no power to predict the future or render a deeper understanding of the process of growth and it's financing. Hence, growth strategies, financing possibilities and associated trade-offs relevant for SME's to consider within this context are presented.
To grow with profitability you also need to manage the effects of growth. Hence the costs of growth along with relating areas of current thinking carrying a potential to enligh-ten and further depict the phenomena in focus will be presented. Towards the end of every section of the theoretical framework, the theories will be operationalized into questions ex-plaining its fit and usage within the investigation process.
3.1
Financial situation
Modigliani and Miller (M & M) laid the foundation to what was to become the theory of firms' capital structure. Their first 'irrelevance theorem' (1958) stated that in a perfect mar-ket a firm's choice of finance does not affect its value, since the effect of cheaper debt will be matched by an equal increase in cost of equity resulting in an unaffected cost of capital. The message was for management not to spend any time examining the right side of the balance sheet, but instead focus on the value adding left side. Since they outlined where capital structure theory is irrelevant, others were inspired to explore when and how it in fact is relevant (i.e. in non perfect markets). Even M & M modified their own theory in
1963 when they described the 'tax shield' as an advantage of debt finance that could elevate firm value, since interest is tax deductable. Why then, are firms not a 100% debt financed?
The first cost associated with debt finance are bankruptcy costs; the additional legal expenses, decreasing sales, increasing costs of production, and losses in value due to forced fire sales, that comes with a firm's bankruptcy or reorganization. These costs make firms less benevolent towards leverage and financial institutions more careful lending (Robichek and Myers, 1965). More recent studies all agree that these costs relatively decrease with firm size, making bankruptcy costs more severe for SME's (Van der Wijst and Thurik, 1991). Myers continued on his own to describe another cost, called underinvestment caused by debt overhang (1977). Highly levered firms will find it hard to finance positive net value projects (NVP's) since existing creditors deny further lending to limit exposure, and junior creditors (in a negative scenario) will only finance the repayment of more senior debt. To generalize, firms primarily valued on its expected future cash flow will find the cost of un-derinvestment to be substantial, and mature firms with limited growth opportunities will find the benefit of the tax shield to outweigh this cost. The choice between the benefit of debt (tax shield) and cost of debt overhang (underinvestment) is called the static trade-off.
In 1976, Jensen and Meckling portrayed the principal-agent relationship as another cost affecting firms' choice of finance. These so called agency costs arise from management not always performing in a value maximizing way (emphasizing reinvestment of free cash flow to increase power instead of dividend), forcing creditors to invest in monitoring d e-vices to supervise and control their behavior. Due to the elusive nature and opaque appear-ance of a smaller firm, with less financial control and historical records, these costs are comparatively higher for SME's (Chittenden, Hall and Hutchinson, 1996). Myers and Ma-jluf (1984) found evidence of the static trade-off being a second hand concern, behind the 'pecking order theory' (POT). Here a firm prefers using its internal funds, before trying to obtain debt finance, and only see new equity issues as a last resort. The behaviour was ex-plained by information asymmetry, leading to unwanted market reactions. Without full dis-closure of firms' future prospects, the market will interpret new issues as management con-sidering the equity to be overvalued, and thus in response lower its value. The same logic explains why initial public offerings (IPO's) are found to be underpriced for smaller firms, and when carried through associated with higher cost of equity for a given risk, making ex-ternal equity more expensive for SME's (Buckland and Davis, 1990). Following the POT logic profitable firms will choose internal funding and less profitable will be forced to choose external. Additionally, it entails that growth might be limited to match firms' gen-eration of internal funds.
Before moving on to SME growth considerations, it can be intuitive to see how their financial situation limit and affect them through a life-cycle perspective. Early on firms are seen as almost entirely dependent on owners’ equity which limit their chances of really seiz-ing all opportunities and grow. After survivseiz-ing the first years of underinvestment they can start making use of trade credit and short-term debt6. However, due to lack of long term debt7 and stock market quotation, rapid growth at this stage could severely hurt the liquid-ity of the firm (Weston and Brigham, 1981). Michaelas et al. (1999) take a similar stand-point when they identify the lack of long term debt to decrease a firm's chances of handling
6Short term debt is defined as the total debt due for repayment within one year, and it includes bank overdraft, current bank loans, and current liabilities (Michaelas et al. 1999).
7Long term debt is defined as the total debt due for repayment beyond one year, and it includes long term bank loans, leasing obligations, and director loans (Michaelas et al. 1999).
late payments on receivables, and thus as a result increase their dependence on short-term debt. This theoretical section will be utilized in the following way:
Determinants of SME capital structure: Size – due to agency costs
Age – due to agency costs
Profitability – due to the 'pecking order theory'
Asset structure (as a proxy for collateral) – due to agency costs Growth – due to the static trade-off
What benefits and costs of debt have they experienced?
What are their preferences between: internal equity, short/long term debt, and external equity?
3.2
SME growth and its financing
Capital constraints are uniformly considered to be the main obstruction for SME growth (Becchetti and Trovato, 2002; Riding and Haynes, 1998), but are not entirely conclusive. Bartlett and Bukvic (2001) find institutional bureaucracy to be almost as important, al-though not particularly in Western Europe but from a global perspective. The field of stra-tegic management turn to the entrepreneur himself for explaining SME growth. If not re-stricted by his perception of what is possible, his capabilities, his ability to delegate, then his desire in form of unwillingness to grow could be the true barrier (O'Farrell and Hitchens, 1988). However, when a firm is growing there are certain trade-offs that should be consid-ered, closely tied to the overall strategy and financial ability of a company; that is how to grow, with what speed, and how to finance it?
3.2.1 Growth strategies
Organic growth means that a firm grow without buying other existing companies, licences or products, meaning they increase/expand production or establish new plants on their own (Ansoff, 1965). Non-organic growth can for SME's take the form of mergers and ac-quisitions. In acquisitions one company 'swallow' another company and have the possibility to completely change its structure and processes. In mergers on the other hand, two com-panies normally of the same size unites under the control of one management (Gaughan, 2002). Although most literature on mergers and acquisitions (M&A) have its origin in large companies a recent study by Weitzel and McCarthy (2009) on SMEs' M&A behaviour found that: a) M&A is a more popular growth strategy among SME's than for larger firms, b) SME's are performing better in M&A deals, and c) the pecking order only partially ex-plains SME behaviour when found that they, in comparison to large firms, use more stock and less debt and cash to pay for their M&A. The choice between organic and non-organic growth is according to Ansoff (1965) driven by cost and time. With organic growth the de-velopment of new products, the construction of new facilities, and changes to the structure of the organization are all additional costs. The same costs are associated with the non-organic growth, which also bring transaction- and acclimatization costs but it is considera-bly faster achieved.
There is also a third and fourth way to consider and accomplish growth, in research called to grow by internationalisation or (and) networking. Networking has itself been a prominent topic of discussion within entrepreneurship research, where some studies have linked it to firm growth (e.g. Hansen, 1995). The literature on firm growth by
internation-alisation is also a growing one. Due to today’s low-cost communication and transportation of products and services, internationalisation has passed from being an alternative to growth to almost become a prerequisite, also for smaller businesses (Hurmerinta-Peltomäki, 1994) and especially for smaller countries (Julien and Ramangalahy, 2003). The relation between the two concepts is building on 'establishing and maintaining the required
rela-tionships with business partners, customers, suppliers, and governments' (Welch and Welch, 1996). In a
study by Chetty and Cambell-Hunt (2003) networks were found to be the only launching pad out of the small domestic market.
3.2.2 Growth rate
The survival rates for firms that grow are twice as big, implying that especially smaller firms can find themselves better off by growing (Phillips and Kirchhoff, 1988). On the other hand, growing too much or too fast can turn the firm into 'a victim of its own success', where they see their safety cash buffers being turned into working capital as demand increases (Churchill and Mullins, 2001). Consequently some firms choose to grow while others do not. Some have annual growth targets and strategies (e.g. 10% organic and 10% non-organic growth) while others sit tight and await opportunities to come. At heart of the is-sue, stands the trade-off between growth rate and corporate control. In some industries (e.g. technology driven or booming ones) the growth is very important to gain or withhold your market position. For an SME this can appear to be a puzzling enigma. Since internal funds in most cases are not sufficient, SME's seem to be stuck between a rock and a hard place where they either have to match their growth to the generation of internal funds and possible loose a valuable market position, or acquire an expensive stock market quotation which decreases ownership and increases chances of a leveraged buyout when the market fluctuates (Chittenden et al., 1996).
3.2.3 Growth financing
The most important financial sources for a growing SME in Sweden are owners' equity (in-ternal financing), ex(in-ternal finance in the form of debt, new issues, venture capital, and insti-tutional funding. Following the above reasoning there seem to be a connection between firm growth, its choice of financing, and risk. Hence the following considerations can prove to be useful. According to CONNECT (2005):
Internal financing. Generally, an entirely internally financed company is a slow moving company with a stable balance sheet that most definitely will stand solid when the market fluctuates. Yet at that time it might prove to have the capacity to take advantage of discounted acquisitions, and have spasmodic growth. However, when continuous or high growth is preferred, an SME is almost without exception forced to seek external capital.
External financing. External financing is not for free. Debt is offered by banks and financial institutions, but only in exchange for collateral or personal guarantees. On the other hand, if you are granted a loan they ask for no firm influence during the contract, but failure to comply with repayment obligations leads to default. Venture capital stands in contrast to debt, and carries no demands of collateral security, repayment and risk of de-fault. Instead a venture capitalist becomes a joint-owner of the firm (the original owners' percentage share of ownership decrease), and with superior expertise try to bring value quickly to the company during a predetermined time, before exiting. Venture capitalists can enter anywhere within a firms lifecycle (early, expansion or mature). The last source of fi-nance, institutional funding, is in many times a forgotten one. It demands less collateral se-curity then debt, no repayment, and wants no influence on the management of the com-pany (although the project funded needs to be carried through according to a contract). On
the other hand, in contrast to venture capital, it does not cover the capital needs fully but needs to be jointly-funded. However, to receive any of the above sources of external capi-tal, a good, sound, and well written/presented business plan is needed.
3.2.4 Lending technologies
To be able to obtain finance it is essential to actually know the reasoning behind it, and the criteria that need to be fulfilled. In the pursuit of reaching the other side of external financ-ing - banks and financial institutions, and search for possible ways to borrow money the following lending technologies are found. Bear in mind, the technologies are not exclusive of one another but might be used in combination on a regular basis. However, one is al-ways dominating. According to Berger and Udell (2006):
Financial statement lending. Primarily based upon the financial strength of the borrower, as communicated by its’ financial statements. This information is required to be scrutinized by a creditable accounting firm according to widely accepted standards. The contract itself can contain additional agreements (e.g. collateral) but should primarily be va-lued based on the expected future cash flow of the borrower.
Small business credit scoring. Collects information about the owner's credit his-tory, obtained from consumer credit bureaus, and combines it with SME data from com-mercial credit bureaus. It is a fairly new technology, associated with credits up to 500 000 SEK, high interest rates (due to borrower opacity), and are generally not performed by banks.
Asset-based lending. Collateral is used as a secondary source of repayment in many of the lending technologies, but is here the primary source rather than overall firm credit-worthiness. The technique is usually used to finance working capital needs and inventory, and the credit limit is calculated with a formula extracting the liquidation value of working capital (measured daily) and inventory (measured weekly/monthly). The collateral value of pledged assets should always exceed the credit exposure.
Factoring. Similar to asset-based lending as it puts priority on the value of an under-lying asset rather than firm risk. Differences include just financing accounts receivable, and actually selling the underlying asset (account receivable) to the lender, usually along with outsourcing of credit control, billing and collection activities. Focus is somewhat shifted from the creditworthiness of the borrower to the obligor.
Fixed-asset lending. In here the underlying takes the form of a long-lived asset not normally sold (e.g. machines, real estate). Unlike similar technologies the underlying can be identified by an identification number and pledged securely with a lien. This removes the risk of asset transfer which facilitates the monitoring of collateral known to be significant among asset-based loans. The credit is based upon market value of the asset (with a ratio less than one) and maturity is set below the lifespan of the asset, with a contract structure of periodical amortization. Failure to amortize will lead to default on the loan (payment monitoring).
Leasing. Within leasing the lender (lessor) is the actual owner of the asset usually be-ing equipment, vehicles or real estate. The lessor then simultaneously enters into a leasbe-ing (rental) contract with the borrower (lessee). The contract contains a schedule of payment details and usually an option at maturity for the lessee to purchase the asset at a specified price. Leasing, just like other technologies that base lending decision upon asset value, is a good alternative for opaque firms.
Relationship lending. This technique relies on soft information gathered over time by the loan officer's continuous contact with the SME. This soft information spans over all dimensions of the firm and may even include its future prospects as identified by suppliers, customers, or similar businesses.
Trade credit. Trade credit is not offered by financial institutions in the same sense as previous lending technologies, but included due to its importance for SME financing. In the US trade credit amounted to 33% of all debt used (1998), similar to the exposure of commercial banks. Furthermore, it cannot be classified either as an asset-based, perform-ance-based, or relationship-based lending technology, but rather a combination of them all. Credit managers (lending) usually assess financial statements and more quantitative credit scoring along with soft information and mutual trust. Researchers have found the following benefits to be associated with trade credit: suppliers have an advantage when evaluating their customers' ability to pay (by offering discounts for fast payments), trade credit can be seen as a signal of market trust and expectations, it is negatively related to strategic defaults, and it seem to benefit fast growing firms facing financial constraints (since suppliers some time extend credit in contrast to banks). This theoretical section will be utilized in the fol-lowing way:
Why have they decided to grow, and why at that specific growth rate? What growth strategies have been employed?
What organizational changes has it resulted in?
To what extent have they experienced capital constraints?
What financial sources have been exploited and why, to what investments, and how did they obtain it?
Are/were they aware of how banks and financial institutions reason about lending them money?
3.3
Managing the effects of growth
Firm growth is repeatedly equated with success. However, it can lead to several undesirable effects or challenges if not carefully planned. Growth brings organisational change in the form of new routines and practises that need to be implemented, even new facilities that after a while can force a total restructuring (Davidsson et.al., 2005). To be successful with a dynamic firm like that, within an increasingly more dynamic economy, SME's ability to adapt routines and measure their current position (e.g. financial or non-financial objectives to obtain finance, market position, future financial ability and needs, potential threats and pitfalls) and take swift actions accordingly might be the difference between success and failure.
3.3.1 Cost of growth
Ernst (1984) recognises the continuous waves of inflation and unemployment for obstruct-ing business plannobstruct-ing. Conventional measures and methods within financial accountobstruct-ing were never constructed to guide managers in highly dynamic environments, leading to an insufficient growth planning. To prevent one of the most imminent consequences of high growth in a dynamic economy from happening, that is a liquidity squeeze, he instead ar-gued for the combining of balance sheet and sales data. By doing so a company could relate its growth to liquidity and financing, to spot problems and take strategic measures in time.
Churchill and Mullins (2001) took a similar focus but also developed an exact way to calcu-late a firm’s capability to grow on internally generated funds, for managers to use as a stra-tegic tool when trading off the benefits and costs of future growth. With no doubt there appear to be ways to calculate the cost of future growth.
3.3.2 Flexibility
Another concern for growing firms in a dynamic environment is the increased risk carried by inflexible investments. This is of growing concern since by not investing in flexibility, or incorrectly value the return of flexible assets, can lead to future losses or rejection of lucra-tive investments either internally or externally when reaching for financial assistance. In re-sponse to recent decades' increasingly dynamic economy, the conventional but rather static 'net present value' technique (NPV) has been complemented by 'real option analysis' (ROA). In contrast to NPV, ROA has the potential to add value to an investment that car-ries flexibility. If a manager can revise, adapt, or adjust already made investment decisions as new information about the reality is released sometime in the future, some of the risk inherent in the project diminishes. Flexibility is an important concept of today, indepen-dent of the nature of the investment (e.g. human capital, fixed-assets), but particularly in rapidly changing, high technology, and hard to predict industries (Trigeorgis, L. 1993). So far no evidence, explaining a firms' ability to obtain finance by relating it to flexibility in i n-vestments has previously been searched for or found, to the knowledge of the author.
Following the above examples there are reasons to believe that firms being able to 1) accurately measure their current position, 2) budget and with flexibility plan for the future, and 3) balance strategic goals with present resources and future financial needs, will realise a more successful growth. This sense of current thinking can be exemplified and further strengthened by the increasing use of the tool 'Balanced Scorecard' (BSC), which in con-trast to the old budget offers a way to concretize more long term strategic goals (with or without financial character). According to a recent survey by Bain and Company (2009) 53 % of the firms worldwide use BSCs on a regular basis. However, Speckbacher et al. (2003) recognized an inconsistency among the usage of BSC, since it during the years has evolved in various directions. Some use it as a strict measurement tool without the more transcend-ing characteristics for which it was intended. This inconsistency can also be connected to the effects of using BSC, since it tends to be positively related to its strategic fit in the firm, and consequently is more than just a strict measurement tool (Braam and Nijssen, 2004). BSC is found to create value by a) translating strategy into clear objectives, b) indicating firm position and guiding and directing management efforts, and c) connecting firm re-sources to its strategic goals (de Geuser et al., 2009). No evidence, explaining a firms' ability to obtain finance by relating it to firm financial or non-financial measuring techniques has previously been searched for or found, to the knowledge of the author. This theoretical section will be utilized in the following way:
How do they handle growth; measure position, choose direction, and assess the resources needed?
What problems or threats (and at what point in time) can be associated with their growth and its financing? How did they solve them?
Have they adapted their growth or its financing to the increasingly more dy-namic economy?
4
Method
The population of interest is identified as computer consultants and computer program-mers (IT firms) in Sweden as according to the Swedish Business Index (SNI code 62010 and 62020). From this group companies with between 10 – 249 employees will form the population. Micro sized companies are excluded from this investigation since they are as-sumed, to a greater extent, to have the desire to either stay small or be highly dependent on the owners' private financial and entrepreneurial history when reaching for external capital. Furthermore, firms that only partially can be categorized as IT firms (i.e. perform contra-dictive activities), and non-active firms were removed from the population.
4.1
Abductive method
When conducting research it is common to choose between the use of inductive or deduc-tive reasoning. Simply, with induction the researcher moves from empirical observations to conclusions in order to develop theories. In contrast, a deductive method originates from theories that, together with existing knowledge, are tested empirically and either accepted or rejected. However, in reality the two rarely appear in their purest form. The result is a method that uses both deduction and induction, known as abduction. Most often abduc-tion starts with inducabduc-tion and use deducabduc-tion to test the findings. (Patel & Davidson, 2003). Yet, in this study both induction and deduction is used as a starting point; deduc-tion tests possible determinants of capital structure and inducdeduc-tion explores debt levels and key ratios that together form a statistical description of the financial situation for the IT firms. This study than seek explanations to the findings, just like the classic description of an abductive method want to test findings, but with the use of interviews instead of statis-tical hypotheses testing. Furthermore, the interviews are also used inductively, to create theories that possibly can be 'tested' by cross referencing to the statistical description of their financial situation. Obviously, this philosophical standpoint entails a mixed method research approach.
4.2
Mixed method approach
According to Tashakkori and Teddlie (2003) different methodological strategies may be adopted for different purposes in a study. Since this study relies on the 'assumption' that IT firms on average are financially constrained, this must be statistically analysed using a quan-titative method. Quanquan-titative methods are also by far the most common research strategy within capital structure research; some academic circles still frown upon the 'soft values' ex-tracted from qualitative research in comparison to statistical facts and hard conclusions (Parker and Kozel, 2004). However, during the 1990's qualitative studies began to draw at-tention as it complemented some of the previous statistical findings by bringing insight sta-tistics could not (Matthews et al, 1994). Michaelas et al. (1998) also identify that qualitative studies can be especially fruitful when investigating capital structure of SME's, since the in-dividual managers' risk taking propensity, motivations and attitudes are not easily quantified and may have a major impact on how they choose to finance their firms. Although mixed method approaches, that combine two or more methodological approaches in order to cross reference or triangulate (i.e. further strengthen empirical findings), have been success-fully employed for the last 30 years it is even less common within capital structure research than just using a qualitative approach. The decision to still use it in this particular study is not only based on the fact that the specific features of the purpose demand it, but also since it brings reliability and validity to the findings. According to Parker and Kozel (2004) the quantitative component of a mixed method approach ensures reliability and
representa-tiveness, while the qualitative part add validity by ensuring that the questions being asked are understood and appropriate for the phenomena in focus, as it attempts to approach all the 'why' questions many times left untouched. Furthermore, they recognise that since a quantitative strategy seeks uniformity of responses, in contrast to a qualitative strategy, it is not flexible enough to pursue unexpected responses as an opportunity to gain new insight. The two methodological strategies will now be presented and their fit within the in-vestigation process described.
4.3
Financial situation
To justify the discussion of IT firms in connection to capital constraints, and to enable comparison for the average reader, the financial situation of this population must be de-scribed and juxtaposed to a different line of business (SME's) not carrying the same prob-lematic features. The chosen business is 'manufacturing of metal products' (SNI code 25), since it is considered to be a classical and well respected Swedish industry carrying assets with high collateral value.
4.3.1 Data collection.
Data was collected from the Swedish database 'Affärsdata', enabling a customized collec-tion for the specific characteristics covering the two entire populacollec-tions. The database ended up consisting of 946 active IT firms, and 619 manufacturing firms, with book value data (as augmented by Myers, 1984) representing the year of 2008.
4.3.2 Data analysis
When analyzing the database the statistical software program 'SPSS' was utilized, and the following variables were created all commonly used for this purpose (Michaelas et al. 1999; Titman and Wessels, 1988; Van der Wifst and Thurik, 1993)8:
DETERMINANTS
Size: Employees and total assets. Age: 2008 less the year of incorporation
Profitability 1: Earnings after financial income / total assets Profitability 2: Earnings after financial costs / total assets Asset structure: Fixed assets / total assets
Growth: (Percentage increase in sales + percentage increase in assets) / 2 DEBT FINANCING
Long term debt: Long term debt / total assets Short term debt: Short term debt / total assets Accounts receivable: Accounts receivable / sales
Accounts payable: Accounts payable / cost of goods sold Cost of debt: Financial expenses / (total debt – accounts payable) FINANCIAL INDICATORS
Solvency: (0, 7 * untaxed reserves + equity) / total assets Liquidity: (Current assets – inventory) / current liabilities
8 A more detailed account for the reasoning behind selecting these financial indicators is available in
Numerous correlation tests were then performed in order to find determinants on IT firms' capital structure or explanations to their growth. Only correlations that are significant on the 0,01 level are considered and displayed in this study.
4.4
Growth, it’s financing and possible effects of growth
Statistical, capital structure analysis has many advantages but can never form a complete understanding of the reasoning behind the numbers; the process of growth, its financing and the effects of growth. That is why a second methodological strategy (i.e. interviews) will be employed to complement the first, and possibly reject or strengthen some of the conclusions drawn from the quantitative data collection. As a step to facilitate this strategy (i.e. guide the interviews) and give credibility to some of the interview findings, the IT firm database will also be used to compare the normal growing (306 firms) with those that are fast growing (338 firms). This enable to cross reference interview findings from a rather small sample to statistical findings covering the entire population. To see if the same va-riables determining capital structure also determine firm growth the same correlation test-ing procedure as in the first strategy is repeated. Furthermore, to find indications of some of the possible effects of fast growth, two additional variables are created:Productivity: Turnover / employees
Efficiency: Pre-tax profits after financial income / employees
Productivity and efficiency, are only used to compare normal versus fast growing IT firms since they are not suited for across industry analysis (see Appendix II for further reason-ing). Moving on, since statistical analysis has no actual power to describe the extent of capi-tal constraints or gain insight into the process and strategy of growth and it's financing, in-terviews have been performed, but with whom?
4.4.1 Sampling
Interviews with a random sample from the above described database have been performed. The sampling was performed in line with the following two criteria:
Medium sized. Naturally larger firms have more experience and information to offer about the process of growth and what it brings to a firm at different stag-es in time.
Fast growing. Since the average age is relatively low for IT firms (12 years), most of the medium sized firms have most likely realized a considerable growth. However, to further stress their need for capital and the possible ef-fects of growth, focus will be set on those firms growing fast.
When talking about fast growing firms it is referring to the OECD definition of high growth enterprises adopted for international comparison: all firms realizing at least 20 % average annual growth over a three year period (Ahmad and Rude Petersen, 2007). Since empirical tests have shown very low correlations between different growth indicators (Da-vidsson et.al., 2005), this condition must hold for both asset growth and sales growth to get a more representative measure. Unfortunately, no available database allowed for conti-nuous growth sampling, resulting in growth data from a single year. However, as a second step in the sampling, telephone calls were made to random firms within the sample to ena-ble control against the chosen growth standard until four rewarding interviews were per-formed. Notably, just as many interviews had to be excluded from this study since these firms were part of a combine (e.g. computer department just executing/bearing costs from
mother firm's technological investments) and consequently were not exposed to the same financial reality as independent firms.
4.4.2 Data collection
Subsequently, in-depth telephone interviews were performed with Chief Executive Officers and Chief Financial Officers from the four sampled firms ranging from 1 – 1,5 hours. When performing the interviews a semi-structured technique was adopted to allow control against the preidentified areas of interest, but also not to interrupt the natural flow of the discussion. The interviews were preserved through detailed notes and audio recordings when allowed for, to enable repeated listening and to really preserve the tone and exact wording of the respondent for later interpretation and analysis. This way the interviewers' influence on the data collection is minimized as according to Miles and Huberman (1994). Furthermore, numerical data describing the financial situation of the sample was gathered from 'Affärsdata'. To ensure quality of data every sampled firm was offered, and preferred, complete anonymity within this study.
4.4.3 Data analysis
The qualitative data from the interviews was later compared and analyzed together with the numerical data describing the four firms' individual financial situation and its development during the years 2005 – 2008, but also by comparing to the statistical analysis in the first methodological strategy explaining their aggregated financial situation. By iteratively going from one source of information to another patterns were identified that successively could form an empirical understanding, partially accepting and in some cases rejecting both theo-retical areas believed to be of importance, and result from the first methodological strategy. Some parts of the analysis also took place during the process of interviewing. As certain theoretical areas were found to be not as important as previously believed, other areas (e.g. personnel) emerged as almost decisive. These areas were obviously invited and treated in the study, and when necessary complementary phone calls were made to enable compari-son of these areas as well.
4.5
Problems and weaknesses
It would have been preferred to have financial data, both for the statistical and interview analyses, that displayed more years than one and four respectively. This way capital struc-ture changes over time (for the statistical analysis) and the process of growth and its financ-ing (for the interview analysis) could have been identified and better described. Considerfinanc-ing the statistical analysis (which only had data from one year) profitability and growth is prob-ably the two variables possibly shifting from year to year giving unreliable result. Other va-riables such as size, age, asset structure, debt, and solvency are most likely not that affected from year to year. Considering the interview analysis on the other hand (which contained four years of data), all the sampled firms were about the same age, which is no more than 10 years. So, they were all created immediately after the dot com era, making them especial-ly suitable for the purpose of this particular study. Furthermore, the numerical data actualespecial-ly described at least 40 % of their existence so far, and notably the most interesting part.
The reader should also keep in mind that some of the conclusions are drawn based on a sample of just four firms. However, when possible the conclusions are strengthened by relating to the statistical analyses covering the entire population. It is also noteworthy that certain parts of the interview findings are build on measuring effects of the financial crisis. Sine data only was available up to 2008 the entire scale of effects can obviously not be presented. However, the firms were clearly affected in the fall of 2008, which in
combi-nation with their recent memories of industry changes and firm effects most likely leads to an adequate depiction.
Furthermore, due to geographical reasons interviews had to be performed over tele-phone. The ideal solution would have been to sit down face to face with the respondents and go through their annual progress and the reasoning behind it from the year of incorpo-ration until today. Now the respondents have been forced to remember up to ten year old undertakings, which is questionable. However, this study mainly analyzes large and memor-able events with no need for detailed accounting, which partially should make up for this deficiency.
5
Findings and analysis
The financial situation of the IT firm population will first be described in relation to a manufacturing industry with good reputation and an asset structure of high collateral value (i.e. the metal firms) to test if they really experience a problematic financial reality. Afte r-wards the potential determinants of capital structure will be searched for. Subsequently, since focus mainly is on those IT firms that grow fast these firms' specific financial situa-tion will be described relative to normal growing IT firms, and potential determinants of their growth will be searched for. This step will also facilitate and somewhat guide the in-terview process, and give credibility to some of the inin-terview findings by enabling a com-parison between interview- and statistical findings covering the entire population. Finally the interview material from the four sampled firms will be presented and their process of growth, its finance and the consequences of fast growth will be revealed.
5.1
Financial situation
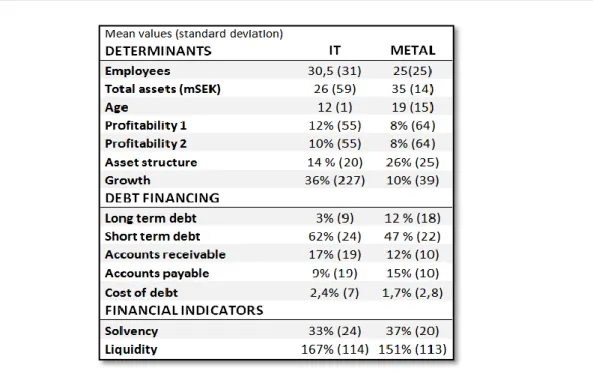
Every number in Table 1 (page 15) entails a mean value representing IT- and metal firms in Sweden. As expected, IT firms have more employees but fewer assets, and their assets carry considerably lower collateral value. Looking at the profitability, IT firms are found to be better off before financial expenses (profitability 1), and still better off (but with less margin) after financial costs (profitability 2). Furthermore, IT firms realize consi-derably more growth but have so far financed it with similar amounts of debt express-ing the static trade-off theory (Myers, 1977) at most beexpress-ing of second hand concern. How-ever, this debt has to a much larger extent taken the form of short term instead of long term, but the consequences are yet at this stage unknown. As recognized earlier IT firms do have relatively higher financial expenses (cost of debt) that decrease their profitability (marginally), most likely being the result of financial institutions adding agency costs. When looking at trade credit it is apparent that metal firms have negotiated better contracts or just have the advantage of operating in a more advantageous industry; they have less account receivable and more account payable which both improve liquidity. The cause of this difference could be many and must be further investigated during the interviews. At last it can be noted that no differences or problems in long- or short term ability to pay off obligations (solvency and cash liquidity) exist.
Table I. IT firms versus metal firms.
From capital structure theory it is apparent that size, age, profitability, asset structure and growth have the power to determine the capital structure of SME's. When searching for evidence, by correlation testing, no proof of agency costs (age and size) being of impor-tance is found. However, profitability is negatively correlated to short term debt (-0,167). Apparently IT firms do prefer internal funds, as suggested by the 'pecking order theory', and can avoid over dependence on short term debt by being profitable. Al-though agency costs are not significant when analyzing IT firms in isolation, when compar-ing them to metal firms (who on average are older and bigger) long term debt appear to be positively related. This is most likely the result of financial institutions using relation-ship as a lending technique, as they value age (track record) and size when appraising more long term credit worthiness. Moving on, asset structure appears to be of importance as well. It does not affect the size of leverage per se but rather the character of it. Since as-set structure is correlated with both long term debt (0,268) and short term debt (-0,128) for IT firms and (0,616 and -0,449) for metal firms respectively, there is no doubt that collateral value on assets is the main reason explaining differences in debt character. However, since the correlation is substantially stronger for metal firms it appears as IT firms have invented solutions to the problem, later to be investigated. Further-more, growth is, as advocated by the static traoff theory (Myers, 1977), rejected as a de-terminant in light of the quantitative data.
5.2
Growth and its financing
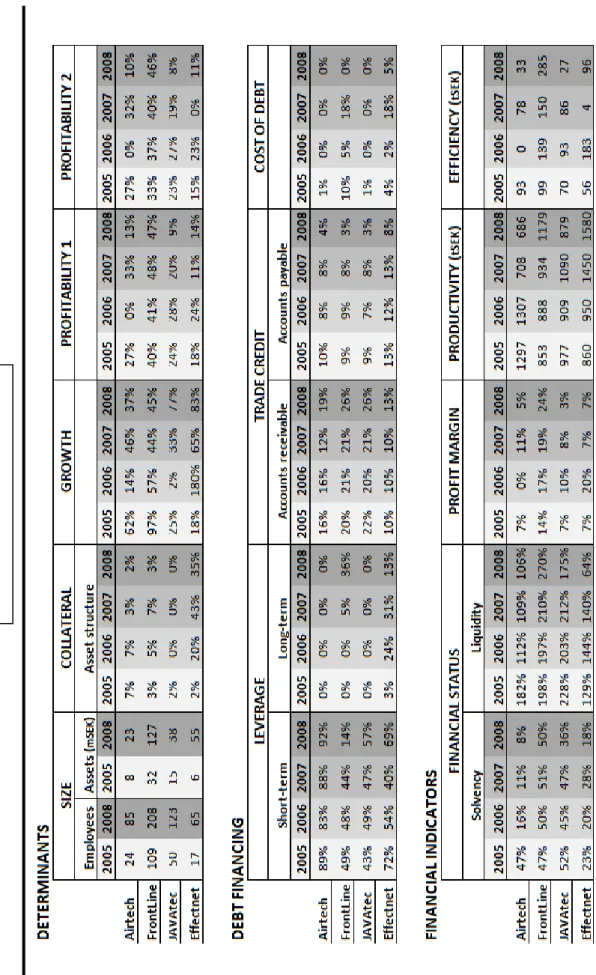
First those IT firms growing at a normal rate will be statistically analyzed against those rea-lizing a fast growth, to search for determinants of their growth and to see if their financial situation differs or if any indications of effects of high growth can be found. Every compa-ny within the interview sample will then be described in the context of growth and its f i-nancing, followed by a discussion and visualization of the findings. See Table III (page 20) for a numerical description on their individual financial situation and its development over the past four years (2005 – 2008).
5.2.1 Normal versus fast growth rate
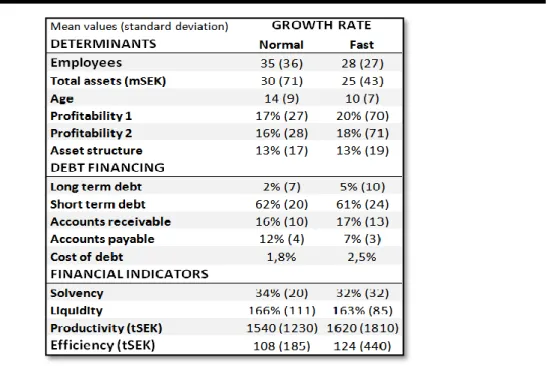
The average growth for IT firms is high but the number carries a high standard deviation, meaning that some firms grow fast and others not at all. In Table II below you see that fast growing firms appear to be slightly smaller and younger. There is no correlation to size, but growth somewhat seem to be determined by age (-0,204). This comes as no surprise as it is easier to realize growth early in the life-cycle. Furthermore, they both grow with the same asset structure and carry the same leverage, effectively meaning that the more 'successful' firms (in terms of growth) have realized their growth with assets of sim-ilar collateral value. However, once again we see a difference in debt character when fast growing firms for reasons unknown have obtained slightly more long term debt but less accounts payable. It is also true that the fast growing firms are somewhat more profitable (0,158), indicating that capital constraints might actually be present. Fi-nally, one of the more obvious characteristics carrying power to determine the growth of IT firms, that is size, will now be removed and focus will only be put on medium sized and fast growing IT firms. A group of firms that at a first glance appear be both more produc-tive and efficient, but since the two numbers carry such a high standard deviation relaproduc-tive to the 'normal' growing firms, a clear indication of a difficulty with managing the ef-fects of growth is noted.
Table II. IT firms growing at a normal rate versus a fast rate.
5.2.2 Airtech
Between 2005 and 2008 they have grown from 24 to 85 employees, and they have financed it with high amounts of short term debt (see Table III on page 20). For nine years Airtech has offered products to the airline industry with a demand closely connected to the varying quantity of airline passengers. They possess offices in Sweden, the Netherlands and the United Kingdom, and have a vision of bringing flexibility and efficiency to its customers. Throughout the years they have remained private and independent without affiliations. Due to the entrepreneurial minds of the owners Airtech started out with a unique product and solid business idea that generated sufficient internal funds to support a fast organic
growth and consequently win market share before competitors could catch up. 20% h as been their growth target and they have reached it every year, except 2006, by staying close to SAS at the start and (when feeling financially stronger) growing by internationalization. Today they have more than 50 different customers. However, in 2004 they realized that their platform (product) were starting to get obsolete in the ever changing market of high-technology, and needed considerable updates. For the first time since the start external fi-nancing was needed to support a delocalization of workers previously making money for the firm (externally) to, side by side with expert consultants to be brought in, just costing money (internally) for a substantial time onwards. Unfortunately the bank said no. As the CFO at Airtech phrased it,
'our bank had no understanding of our IT business at all; when we displayed our industry certifi-cates, years of profitability and financial stability they searched only for collateral value'.
So the project was delayed for two years until no more time was left to wait, in Janu-ary 2006. At this time the risk of losing long term clients due to their obsolete platform was imminent. Concurrently, the negotiations with the bank had reached a deadlock. Due to the urgency of the matter significant amounts of money was invested in to paying expert consultants from a neighboring firm, a firm they soon realized they had to acquire in order to get their full attention and the job done in time. By the end of the year Airtech knew something had to happen if they were to survive, which was why they bought a piece of real estate (collateral) and rented it out. This piece of collateral, along with detailed plans of their future business and explanations on why Airtech needed financial support, was used in a final but successful attempt to obtain debt finance and acquire the neighboring firm (40 % in 2007 and the rest in 2008) and develop the needed platform.
'For years we had only looked towards the future and the money going in, and all of a sudden we
had to consider the money going out. We were fumbling in the dark. Hopefully it was an important lesson and organizational awakening, but a lesson now being learnt', said the CFO when
look-ing back at 2006.
Regarding debt finance Airtech has so far not reached any long term finance but still appear as highly leveraged due to low equity and a fast growth that increase short term debt even without external financing. Their accounts receivable are all right but their accounts payable are behind industry standard. It is apparent that Airtech has grown due to entre-preneurial strength and a favorable growth strategy, without considering the debt, cost side of their business or future financial needs until forced to face its consequences.
5.2.3 FrontLine
Between 2005 and 2008 they have grown from 109 to 208 employees, and they appear to have financed it with a high profitability (keeping short term debt down) and a recent ob-taining of long term debt (see Table III on page 20). For 10 years FrontLine has developed software to mobile phones and is now one of Sweden's most successful companies based on sales, organic growth and profitability. They have offices in Europe and North America and are contracted by some of the world's largest handset vendors. They try to outperform their competitors with agile teamwork that turn ideas in to profit and customer satisfaction. Due to capital constraints and a will to grow organic they have never acquired any compa-nies, but instead focused on networking and followed their customers abroad. As an exam-ple they followed Ericsson to the USA, and created enough connections on the side to start up a steady business after completing the initial project. Despite a considerable profitability and due to the costly nature of the industry where 60 – 90 days of payment time is custom, factoring has been used as a complement to a small credit line (1 million SEK). At occ
a-sions, when facing large investments, FrontLine has also persuaded customers to co-finance the project and consequently used that as leverage when negotiating financing deals. When asked about how they obtained their factoring and credit line FrontLine re-sponded that it is a matter of being totally honest about future projections and involving your financial institution as early in the process as possible.
To stay ahead of competition in a fast changing and dynamic environment FrontLine has from the start outlined a strategy of staying flexible and agile by constantly educating their personnel, inspire to and invest in scheduled skunk work, and by trying to lead instead of following the market.
'Within this industry it is extremely important to have employees that are motivated enough to create tomorrow's solutions and to keep that knowledge and human capital within the firm for as long as possible. Our personnel feel so involved that they on their own initiative meet at evenings to elaborate on new techniques, stay sharp and ahead of competitors', the CEO proudly stated.
The biggest obstacle has been to find enough qualified personnel, which is why they d e-cided to locate two offices in the student cities Lund and Umeå, as well as start a business in Ukraine next to the famous University in Kiev. FrontLine's strategy has been successful and their profitability has been substantial enough for them to successfully grow at a fast rate without over dependence on short term debt, at least for the first ten years. At this time however, as the CEO of FrontLine explained it,
'we (the entrepreneurs) had reached our maximum potential as business leaders and needed expertise
and experience from a bigger player to know in what direction to grow and how to stay ahead. Our profitability was also not sufficient to support an international full scale expansion'.
Consequently they carefully chose to involve a 'financial partner', one that offered long term support without insisting on a quick exit strategy. The private equity company, with extensive experience in developing middle sized entrepreneur-driven firms by international expansion, acquired FrontLine (65 %) in 2007. The take-over also resulted in long-term fi-nancing and working cash (liquidity) that offered stability to a non-stable environment.
5.2.4 JAVAtec
Between 2005 and 2008 they have grown from 50 to 123 employees, and they appear to have financed it with a decent profitability (keeping short term debt down) but so far no long term debt has been reached (see Table III on page 20). The firm was created in the basement by five friends ten years ago, and has since then created mobile phone platforms by using Java technology. They are today situated all over Sweden with a primary focus on its origin in the south. JAVAtec strive at being best at what they do, and try to prove it with high customer satisfaction and by contributing to open-source software creation and edu-cational seminars within their specific field of expertise. The creators have decided to keep the ownership within the firm, and disseminated shares to every employee. This is also part of their optimistic goal of having a personnel turnover at zero.
JAVAtec's growth strategy has involved the belief in individual employees' ideas, and the courage to invest in them, to follow customers abroad and maybe most importantly to market their brand name by blogs, seminars and open-source creation. As soon as an idea becomes profitable it is released. At least until 2008 when two large business areas (re)joined forces to share costs. As a consequence the family feeling was eliminated and employees lost enthusiasm; they simply became too big too fast. Concurrently their finan-cial department, who already was suffering with simple or non-existing routines, became overloaded. For years they were told not to focus on details and used simple spreadsheet
analysis resulting in a lack of overview and ability to scan the environment and plan for the future.
'We measured our sales and current status by calculating the number of employees being at the office not making money', the CFO explained.
From a financing point of view JAVAtec have realized their weak position in nego-tiating trade credit with their major clients (big players like Ericsson), who can cancel an order at any point in time and demand 90 days of payment. Additionally, they have never reached any long term finance due to assets with low collateral value but managed to avoid short term debt by being solvent and relatively liquid. The question is for how long? Fur-thermore, JAVAtec has managed to obtain institutional finance, described as an exhaustive administrative mission, to use for developing an enterprise system for a municipality. A successful initiative since normally they have no time (i.e. money) to start developing inter-nally. Their goal is to be able to pay three monthly salaries to every employee before start-ing to develop internally, a hard thstart-ing to achieve without financial assistance.
'In this industry it is extremely important to keep investing in research and development, but so hard
in an unstable environment like ours; every month something unforeseen takes place like a contract that suddenly is cancelled simultaneously as another idea spurs into a project and another business unit is released', the CEO comments.
5.2.5 Effectnet
Between 2005 and 2008 they have grown from 17 to 65 employees, and they appear to have financed it with high amounts of debt, both short and long term as well as favorable trade credit (see Table III on page 20). For nine years Effectnet have designed, created, in-stalled and maintained networks for computer communication. They are situated all over Sweden and have clients like the government, municipalities, firms and real estate owners. Their business idea describes a focus on quality, operational stability and cost efficiency when customizing their products. Effectnet is actually a recreation of an older company that went bankrupt in the dot-com era, after which the owners and a handful employees decided to invest in the current business. At that time it was impossible to go to the bank who was terrified of firms just like Effectnet, and they have since then never obtained any finance except factoring from them. Instead they successfully pursued institutional com-plementary (50 %) finance from ALMI who carried them towards growth in their first years. ALMI is a government owned Swedish institution that aims at facilitating for busi-ness renewal and SME growth, partly using funds from the European Union. ALMI does not emphasize collateral value but instead the capacity of the business idea and managerial competence when evaluating financial assistance, and avoids directly competing with banks by having higher interest rates.