Bachelor of Science in Computer Science June 2019
Local And Network Ransomware
Detection Comparison
Filip Ahlgren
This thesis is submitted to the Faculty of Computing at Blekinge Institute of Technology in partial fulfilment of the requirements for the degree of Bachelor of Science in Computer Science. The thesis is equivalent to 20 weeks of full time studies.
The authors declare that they are the sole authors of this thesis and that they have not used any sources other than those listed in the bibliography and identified as references. They further declare that they have not submitted this thesis at any other institution to obtain a degree.
Contact Information: Author(s): Filip Ahlgren E-mail: fiaa16@student.bth.se University advisor: Dr. Prashant Goswami Department of DIDA
Faculty of Computing Internet : www.bth.se
Blekinge Institute of Technology Phone : +46 455 38 50 00 SE–371 79 Karlskrona, Sweden Fax : +46 455 38 50 57
Abstract
Background. Ransomware is a malicious application encrypting important files on a victim’s computer. The ransomware will ask the victim for a ransom to be paid through cryptocurrency. After the system is encrypted there is virtually no way to decrypt the files other than using the encryption key that is bought from the at-tacker.
Objectives. In this practical experiment, we will examine how machine learning can be used to detect ransomware on a local and network level. The results will be compared to see which one has a better performance.
Methods. Data is collected through malware and goodware databases and then analyzed in a virtual environment to extract system information and network logs. Different machine learning classifiers will be built from the extracted features in order to detect the ransomware. The classifiers will go through a performance evaluation and be compared with each other to find which one has the best performance. Results. According to the tests, local detection was both more accurate and stable than network detection. The local classifiers had an average accuracy of 96% while the best network classifier had an average accuracy of 89.6%.
Conclusions. In this case the results show that local detection has better perfor-mance than network detection. However, this can be because the network features were not specific enough for a network classifier. The network performance could have been better if the ransomware samples consisted of fewer families so better features could have been selected.
Keywords: Ransomware, Detection, Machine Learning
Acknowledgments
I would like to thank Dr. Prashant Goswami for being the supervisor of this thesis and supporting with feedback on the process. I also want to thank The Zoo, Malshare and Virusshare for providing ransomware samples for the experiment.
Contents
Abstract i
Acknowledgments iii
1 Introduction 1
1.1 Aim And Objectives . . . 2
1.2 Research Questions . . . 3 1.3 Overview . . . 3 2 Related Work 5 2.1 Local detection . . . 5 2.2 Network detection . . . 6 2.3 Background . . . 6 3 Theory 9 3.1 How Do You Get Infected . . . 9
3.2 Communication With C&C Server . . . 9
3.3 Encryption . . . 10
4 Method 11 4.1 Work Environment . . . 11
4.2 Virtual Machine Detection . . . 12
4.3 Data Collection . . . 13 4.4 Building Classifiers . . . 14 4.4.1 Local Features . . . 14 4.4.2 Network Features . . . 15 4.5 Measuring Performance . . . 16 5 Results 17 5.1 Local Detection . . . 17 5.1.1 K-Cross Validation . . . 17 5.1.2 Score Measurements . . . 17 5.2 Network Detection . . . 18 5.2.1 K-Cross Validation . . . 18 5.2.2 Score Measurements . . . 18 5.3 Comparison . . . 18
6 Analysis and Discussion 21
7 Conclusions and Future Work 23 7.1 Future Work . . . 24
References 25
List of Figures
4.1 Simple view of work environment . . . 12 4.2 Print screen of paranoid fish[5] . . . 13 4.3 Folds of K-cross validation where K is 3 . . . 16
List of Tables
Local features used for the classifier example . . . 14
Local features used for the classifier example . . . 14
Local features used for the classifier example . . . 15
Network features used for the classifier example . . . 15
Results of the local K-cross validation test . . . 17
Results of the local performance test . . . 17
Results of the network K-cross validation test . . . 18
Results of the network performance test . . . 18
Comparison of all accuracy tests . . . 18
Comparison of standard deviation from k-cross validation test . . . 19
Comparison of TP, FP, TN, FP . . . 19
Chapter 1
Introduction
Ransom malware or ransomware is a malicious application made to trick or force a user to pay a ransom. There are a few common techniques such as Scareware[10], where the malware, for example, acts like an anti-malware who found dangerous files on the system and tricks the user into paying a fine to have it removed. However, in this thesis, the focus will be on the more damaging ransomware, the encrypt-ing ransomware[10]. This ransomware is made to revoke access of files and other important services on the machine through encryption, then ask the user to pay a ransom to gain back the access. The most common way to do this is by encrypting the files with a strong algorithm like RSA or AES[15]. The process of ransomware encryption and spreading can be divided into ransomware families. For example, the ransomware WannaCry[19] spreads through the Eternal Blue exploit, encrypt files through an RSA and AES hybrid and take payments through bitcoin, while other families can spread through spear phishing[10, 22, 12] and only encrypts with RSA. This attack is a post exploit attack, meaning access to the system has been granted through other techniques like spear phishing[10, 22, 12] through email services. When a ransomware has been successfully executed its execution process could look like the following. First, gathering information about the system, this includes system arti-facts for location, computer name and whether or not it’s running inside a virtual machine. If the ransomware detects it is running inside a virtual machine it can be too high risk to execute in case it is being analyzed. Second, the remote host will send one or more encryption keys depending on the implementation. Third, the en-cryption will now start and this will be done either by iterating the entire system or specified paths and new files will be created either by the same name or with a spe-cial file extension. Common encryption algorithm used are RSA, AES or a hybrid of both. Fourth, spread further by scanning the network for common login credentials and other vulnerabilities. Fifth, creating README files, changing the wallpaper or creating a new window displaying that all the files have been encrypted. These messages will specify the encryption algorithm used and how to pay the ransom. Ransomware had a huge spike in popularity by 127%[16] in 2016 and while cur-rently less ransomware are targeting the individual, businesses are taking the hit. Businesses are a good target since they can pay more which will lead to a bigger profit per infected target for the attacker. Also, they are more likely to pay the ransom. An individual may only have lost sentimental files like family pictures but businesses lose uptime and productivity which will lead to a lot of lost money. Trend
2 Chapter 1. Introduction Micro did a study and it showed that 44%[16] of businesses have been infected with ransomware in the past two years. If they value the number of days to restore all the data and lost uptime cost, some businesses will find that it is cheaper to pay the ransom. This is why hospitals and health care companies are hit, they do not have the time to recover the data. Trend Micro also showed that almost 65% of all businesses infected paid the ransom.
Since ransomware has been around for a few years multiple techniques have been implemented to prevent these attacks. The most common way and used for any type of malware are hash detection. When a new file is discovered as a malicious applica-tion a hashsum will be generated with hashing algorithms like MD5, SHA1, SHA256 or SSDeep and then stored in a database. The hashsum, or checksum, is an appli-cation’s content summarized with a hash function to represent its uniqueness with a fixed string length. Every time a new file is downloaded or executed the hashsum of that file will be checked for matches against the database. If a match is found the execution should be aborted since it has been classified as a malicious application. Another technique used is virtual honeypot detection[18]. This technique creates a virtual environment when a new application is started, if the application rewrites or recreates specific files it can be labeled as ransomware. These techniques have been working fine in the past, but in modern time malware is evolving quickly, other solutions have to be implemented in order to keep up.
The reason this area has to be researched is that it’s a criminal activity and as long as these attacks are profitable they are going to continue. If fewer people and businesses get infected, less will pay the ransom and the number of attacks will decrease. If the detection rate is high on the entire process rather than specific ran-somware, new families and versions will be detected faster.
1.1
Aim And Objectives
The goal of this study is to figure out what section of ransomware is the most optimal to examine in order to create an accurate detection system. The sections examined was the local and network level. To figure this out, these objectives are followed:
• Setup a virtual environment that is capable of safely running and analyzing ransomware.
• Collect ransomware/goodware from malware/goodware databases to analyze in the virtual environment and extract behavior reports.
• Use the distinctive features of ransomware to build classifiers for both local and network detection.
1.2. Research Questions 3
1.2
Research Questions
The research questions for this thesis are:
• How well are machine learning techniques performing when detecting ran-somware on Windows 7 on a local level?
• How well are machine learning techniques performing when detecting ran-somware on a network level from a Windows 7 machine?
• Does local and network detection have any differences in measurements when comparing the accuracy and false positives?
These questions will be answered by conducting an experiment. The experiment will include gathering ransomware and goodware to analyze and build local and network classifiers. The classifiers will be built from the same data which will lead to a fair comparison. The results will be compared to find which classifier has the best per-formance.
1.3
Overview
The rest of the thesis will be structured as follows. First related works, exploring and discussing what other researchers have done in machine learning ransomware detection. We will then look at what we can use in our own classifiers by exploring the ransomware process. Then the method used to get the results for this thesis, this includes how data was gathered, processed and evaluated for accuracy. We will then display the results of how accurate the classifiers were. Thereafter we will discuss and analyze the results. The final chapter will conclude this thesis and we will discuss how this topic can be further researched in the future.
Chapter 2
Related Work
2.1
Local detection
The most common approach in local detection is to look at the API calls, what files are dropped and patterns in there are in overwriting files. Since most of the cryp-tography ransomware is required to do these actions in order to lock a user out of the system this allows us to create a more generalized classifier for unseen and new ransomware. An example of this is the proposed model by T. Honda, K. Mukaiyama, T. Shirai, T. Ohki, and M. Nishigaki, to detect ransomware in real time[14]. In this study, they present two methods of how users handle files and the timing of reading and writing to them. Users need to display the content of the files on the screen in order to edit it, but ransomware edits them in the background. The timing detec-tion includes three models of how ransomware encrypts a file. First reads the file content and overwrite it with encrypted content. Second, the ransomware reads the file, creates a new file with encrypted contents and then deletes the old one. Third, the ransomware reads the file, creates a new file with encrypted contents and then overwrites the old one with garbage data.
A static model was proposed by M. Medhat, S. Gaber, and N. Abdelbaki, for ran-somware detection on the local machine[17]. They created a framework based on rules like common ransomware API calls, strings, file extensions, specific paths, and AES encryption signatures. They also included a rule for ransomware that uses Mi-crosoft own encryption libraries CryptEncrypt and CryptDecrypt.
There was a more in-depth study published by Yuki Takeuchi, Kazuya Sakai, and Satoshi Fukumoto, where it was proposed a method to use a deep inspection of API calls to then use Support Vector Machines to classify ransomware[20]. They designed a vector to follow the execution sequence and count of ransomware in order for the classifier to learn the difference between ransomware and goodware. They achieved an accuracy of 97.48% with their Support Vector Machine classifier.
6 Chapter 2. Related Work
2.2
Network detection
Most of the literature on network detection has narrowed down the ransomware fam-ilies to just a few. This allows them to find patterns in their communication. It is not as common to do network detection techniques to create a generalized classifier for unseen and future ransomware.
Krzysztof Cabaj, Marcin Gregorczyk, and Wojciech Mazurczyk, came up with a ransomware detection system based on HTTP characteristics of the two ransomware families CryptoWall and Locky[11]. These characteristics were the communication patterns and average packet size in bytes. This detection system is a live analyzer meaning detection will occur in real time. They were able to achieve a detection rate of 97-98% and 1-5% false positive rate.
The research paper by Omar M. K. Alhawi, James Baldwin, and Ali Dehghan-tanha, proposed a ransomware detection classifier based on network traffic from the server[9]. They used features such as IP addresses from source and destination, ports, number of packets and number of bytes. They were able to achieve a detection rate of 97.1% with a decision tree classifier and 96.8% with a Logistic Tree Model classifier. A deep learning approach was proposed by Greg Cusack, Oliver Michel, and Eric Keller, to detect network communication with the remote server[13]. They discov-ered that the first request was a DNS(Domain name system) request to find the IP-address of the server to then use the HTTP protocol to send encryption keys. They only used these two protocols in their learner and achieved 93% accuracy. This is a more unique technique since it can be used on multiple families that use the HTTP protocol.
2.3
Background
This study will further examine how local and network compare to each other to find out which one performs better. The local level definition for this thesis is the local machine. The ransomware will run on the machine and the features extracted are from function calls to the operating system. From this, values such as files created, written to and directories iterated can be extracted. The network level detection is performed on the LAN(Local area network) where packets can be intercepted when they are being sent or received to or from the internet. The features extracted will be from the number of hosts connected and packet sizes.
It is important to further research this topic because current detection techniques are getting outdated and the ransomware production is not going to stop as long as it is profitable for an attacker. To mitigate the attacks, new detection techniques has to be introduced in order to detect unseen ransomware.
2.3. Background 7 by mapping input to output. This means we create a dataset with features and labels and this will be the input and output. Then the supervised learning algorithm is used to build a classifier from the features and labels. The classifier will then be able to make an educated guess about which feature belongs to the correct label.
There are three different supervised learning algorithms used in the experiment, K-Neighbours, Naive Bayes and Decision Tree. They were selected because no al-gorithm has the best performance in every case, and this gives the ability to find a better classifier. All of the three algorithms bring a unique way to solve the classi-fication problem. K-Neighbours works by placing all the data on a map, then when an unseen sample is introduced we place this on the same map as the other samples and measure the distance and number of samples to determine which label is correct. If we have a lot of label A close to the new sample, the algorithm will guess that the unseen samples also have the label A. The Naive Bayes algorithm works of proba-bility. It will look at all the labels and features to determine the probability of each feature linking to each label. The Decision Tree gathers all the features and decides which features make the most impact on the decisions. A tree is then created of yes and no questions to determine which label the unseen sample belongs to.
Chapter 3
Theory
In this chapter, we will examine the core components of ransomware and how they are used to successfully encrypt the system. These steps will be turned into features for the classifiers in the experiment.
3.1
How Do You Get Infected
A ransomware attack is a post exploit attack meaning it needs access to a system before it can execute. Two common ways of distributing ransomware are spear phish-ing and exploit kits[10]. Spear phishphish-ing is a type of email attack where the attacker sends specially crafted messages to individuals or companies in order to trick them into a malicious web page filled with malware. These emails often have attention-grabbing content from legitimate sources so a user feels required to click any link sent. A regular exploit can be a set of commands or some code used on a vulnerable application in order to take advantage of functionality that should not be available to the attacker. An exploit kit is basically an exploit collection that can be used manually or automated in order to quickly find outdated software that is vulnerable to the attacks.
3.2
Communication With C&C Server
The command and control server, or C&C for short, is a key part of ransomware be-cause the C&C server’s job is to provide unique encryption keys for the ransomware. This will lead to every encryption process being unique for every computer or even file since the keys are never stored in the application. The C&C server is often a compromised proxy server or a zombie in a botnet, which will provide increased anonymity for the attacker.
There are a lot of different ways ransomware can communicate with the Command and Control server. CryptoWall is going to be used as an example to demonstrate how ransomware can communicate[21]. When the ransomware has been executed the first request is to a proxy server that is most likely hacked so the attacker can fetch for the IP address and a unique identifier. The IP address and identifier is then sent to the C&C server so it can contact the infected device. The C&C server will
10 Chapter 3. Theory generate an encryption key and send it to the device along with a TOR(The Onion Routing) address that is for paying the ransom. The TOR address is basically a nor-mal web server with triple layered encryption and multiple middle nodes to further give the attacker anonymity.
Communication with the C&C server is not always the only traffic that is gener-ated. Some ransomware can send basic HTTP GET requests to multiple different servers in order to make the C&C less obvious for analyzers.
3.3
Encryption
Ransomware cannot encrypt the entire system since the victim still has to pay the ransom after encryption. That is why there are preset directories to encrypt. Here are some common directories that can be included:
"C:\Users\<User>\Documents\*" "C:\Users\<User>\Pictures\*" "C:\Users\<User>\Music\*" "C:\Users\<User>\Documents\*" "C:\Users\<User>\Appdata\*" "$Recycle.Bin\*" "X:\*" (Secondary drives)
Ransomware also has the ability to specify what file extensions to encrypt to only encrypt files important to the user and not the system. Every ransomware does not have their own list, but if it has one, it can contain extensions such as ".doc", ".png", ".jpg", ".mp3", ".txt" and more.
When a file has been encrypted file extensions can be changed to make a bigger mark on the system and make sure the user knows everything is encrypted. WannaCry[19] is an example of this where every encrypted file extension will be changed to ".wncry".
Chapter 4
Method
The method used to answer the research questions is an experimental research where we compare different classifiers at the local and network levels to find which one has the best performance. Ransomware and goodware data is gathered and three different classifiers are trained for both local and network level. The virtual envi-ronment is booted from a virtual machine snapshot which, will lead to consistent data extracted from the ransomware. The snapshot is a saved state of the virtual machine, so this gives the ability to save temporary settings and launched applica-tions for each sample. When there is no difference in how the data is extracted the only changeable variable is how the classifiers are built. The performance is then evaluated and compared to find which is the most optimal for ransomware detection. The reason this method is the most optimal is that we can use the same dataset on all classifiers. When we isolate how the classifiers are built we can get the actual performance, compared to literature research where results can vary on how the ex-periment was conducted.
4.1
Work Environment
The host machine used was Linux Mint 18 64-bit. The guest which is the virtual machine running the ransomware was running Windows 7 64-bit version. Windows 7 was used because it’s still widely used by both individuals and businesses and it has more research on anti-virtual machine detection compared to other operating systems.
The virtual environment used was Virtual Box[4] with the malware analysis tool Cuckoo[2]. Virtual Box was selected because it had more documentation on how to avoid anti-virtual machine detection, which we will talk about more in the next section. When only working with Virtual Box the process can be time-consuming and hard to get a malware behavior report back to the host machine. To solve this Cuckoo sandbox was implemented, an automated malware analyzer to speed up the process and generate both network and local reports for specific applications. With this, if a malware sample is now submitted we would only get API(Application pro-gramming interface) calls, files dropped and other behaviors for that specific process. However, this would not include the network traffic, but by keeping few applications installed the network noise would only consist of Windows 7’s own requests, DNS
12 Chapter 4. Method requests, and information sent between the host and guest.
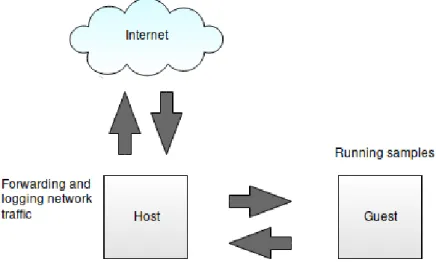
A typical instance of the data collection process is the host machine starts a Cuckoo service which will listen for malware submissions. When a sample is submitted a snapshot is started with required applications already running and the submitted malware will execute. If the malware requires network-access it will go through the host for logging and forwarding to the internet. After the malware process is done the virtual machine closes and a report is sent back with all information needed.
Figure 4.1: Simple view of work environment
In the common target directory "C:\Users\<User>\Documents\" fake files and di-rectories were generated so the ransomware had more data to encrypt. There were 10 directories created with each having 100 subdirectories and each subdirectory having 5 to 10 files. The file name, extension, and content were randomly generated to look like actual files.
4.2
Virtual Machine Detection
In the later years, malware has evolved from a simple exploit or malicious code to a more sophisticated malware where it has different techniques to avoid being analyzed. Some of the ransomware collected are using these techniques to detect whether or not it’s running inside a virtual machine. This is done by looking at different artifacts hidden in the system like the number of processors, disk space, default username, Windows registry strings and much more. To avoid this we can use an application called antivmdetection[1] by nsmfoo to install the Virtual Box with fewer artifacts. This program will generate a Virtual Box configuration file that will then hide differ-ent strings in the windows registry. When an operating system is just installed there won’t be any files or logs of any activity and the malware would think it is a freshly installed machine for analyzing. To work around this antivmdetection has a second
4.3. Data Collection 13 script that will generate, delete and write to files to make the system seem more used. To test if the virtual machine artifacts were removed paranoid fish[5] can be used. This application will scan a lot of well-known artifacts and display if they are changed or not, as seen in figure 4.2. Note that every issue can not be fixed such as differences in rdtsc(Read Time-Stamp Counter) since it is not simple to change the CPU(Central processing unit) time stamp variation.
Figure 4.2: Print screen of paranoid fish[5]
4.3
Data Collection
To make a classifier that can detect ransomware we require sample data from both ransomware and non-malicious application also known as goodware.
Ransomware has been gathered from three different databases, The zoo[7], Malshare[3] and Virusshare[8], however, the majority of the sample were collected from Virusshare. All of the collected samples have different hashsums, meaning everyone is unique in some way. We do not know how many samples came from each family due to Virusshare being unclear in their description, but the confirmed families are Wan-naCry, CryptoLocker, Cerber, CryptoLocker, CryptXXX, TeslaCrypt and possibly more. In this experiment, 112 samples were used for classification and testing. The list goodware or non-malicious applications were gathered from the software informer[6] and then downloaded at their own home page. The list of goodware
14 Chapter 4. Method includes browsers, anti-virus, file downloaders, and other trusted everyday applica-tions. There were 74 unique programs were collected and used for classification and testing.
4.4
Building Classifiers
When deciding on classifiers the requirements needed for this experiment were clas-sification speed and high performance on a small amount of data. This would also be a supervised classifier meaning labels and features are submitted in pairs to build a classifier. The number classifiers were narrowed down to K-Neighbors, Decision Tree and Naive Bayes. These will then be compared to make sure we have the best results possible.
When selecting features for the classifiers to build upon we have to be careful of what to choose. Too few features and the classifier will not have enough data to make a good decision while at the same time too many features can lead to the data being too similar. In the following sections, we will discuss what features are fitting for local and network data.
4.4.1
Local Features
Ransomware on a local computer can be quite aggressive which means a lot of dif-ferent API calls can be used. In the API call summary, we can find how many times files have been created, written to and deleted. Some ransomware renames the en-crypted files on the system to show clearly that everything is enen-crypted. We can create features of this by using the variation of renamed and created files. This is the features used for the local classifier:
Number Name Description
1 CreatedFiles Number of created files
2 NtWriteFile Number of files written to
3 FindFirstFileExW Number of API calls, find file with at-tribute in directory
4 SetFilePointer Number of pointers handled
5 GetFileAttributesW Number of API calls, find file with at-tribute
6 NtReadFile Number of files read
7 Directory Enumeration Number of directories enumerated 8 File Extension Variation Variation of file extensions
9 Home Directory Iterations Number of time home directory is enu-merated
4.4. Building Classifiers 15
Example 1 2 3 4 5 6 7 8 9
Ransomware 16694 59321 17744 90114 16562 45100 16388 125.32 1022
Goodware 1746 1189 638 134 382 707 325 16.04 0
4.4.2
Network Features
Gathering network data from ransomware can be more problematic since most of the network packets are encrypted and we don’t always know the IP address of the C&C server. However, we can find patterns in when, how and what are sent. For one example some ransomware can send HTTP requests to hundreds of legitimate sites to make it harder to analyze the connection to the control server. We can turn this into a feature by looking at how many hosts were connected to and how much data was sent. This is the features used for the network classifier:
Number Name Description
1 nrOfHosts Number of hosts connected to 2 GetTopProtocols Most used protocol
3 NrOfPacketsToDst Number of packets sent to hosts
4 NrOfPacketsToHost Number of packets received from hosts 5 BytesToDst Number of bytes from host
6 BytesToHost Number of bytes from received from host
Example 1 2 3 4 5 6
Ransomware 779 6 47395 73738 7885680 67996367
16 Chapter 4. Method
4.5
Measuring Performance
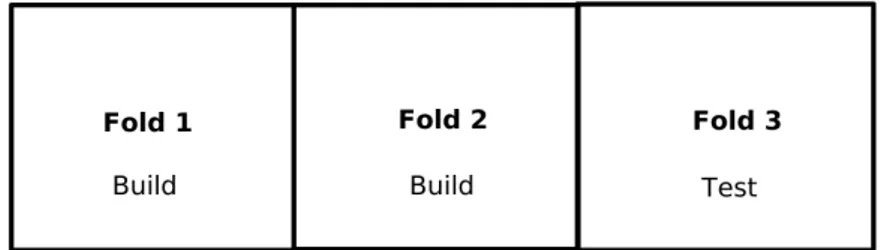
To evaluate the performance of the classifiers we will look at measurements like accuracy, false positives, true positives, false negatives, and true negatives. We will then use the k-cross validation test to make sure we have avoided overfitting. Overfitting is when the classifier only can predict known data by fitting the algorithm to specific values. This would lead to poor classification of new datasets and making the classifiers useless. This test will divide the data into K different folds which are a group of features selected at random. Every fold will either be part of building or testing. The test will be run K times and each time a new test fold will be selected to get new versions of the classifiers. The classifier is constructed in multiple different ways and if there are no critical difference in performance we have no data suggesting overfitting. In that case, our classifiers would have a good performance on unseen datasets.
Figure 4.3: Folds of K-cross validation where K is 3
For example, figure 4.3 displays the first iteration of the k-cross validation test where the k is three. Each fold has one-third of the ransomware samples, fold 1 and 2 will be used to build and fold 3 to test. The next iteration, fold 1 and 3 will be used for testing and fold 2 for building. The last iteration, fold 2 and 3 will be used for building and fold 1 for testing. Each time creating a new classifier with new test data.
Chapter 5
Results
In this section, we will look at the results of building the two different classifiers and look at their performance.
The K-cross validation test was performed with 3 folds in order to give plenty of data for the testing fold. With this number of folds, the dataset achieved a training set of 74 and a test set of 37.
The score measurements are based on one build of the classifier, which means there are no average value from multiple builds. The training data and test data were divided into equally large sets where they both had the same amount of ransomware and goodware. The tables shows how accurate the test was, how many true posi-tives(TP), false positives(FP), true negatives(TN) and false negatives(FP).
5.1
Local Detection
All the classifiers had good performance with an average accuracy of 96% in the k-cross validation test. However, the Decision Tree had the most reliable scores with a standard deviation of 2.2%.
5.1.1
K-Cross Validation
Classifier Fold 1 Fold 2 Fold 3 Average Stdev K-Neighbours 94.59% 93.51% 100.0% 96.03% 2.84% Naive Bayes 95.89% 92.11% 100.0% 96.0% 3.22% Decision Tree 98.67% 93.33% 96.1% 96.03% 2.18%
5.1.2
Score Measurements
Classifier Accuracy TP FP TN FN K-Neighbours 98.02% 99.01% 0.99% 99.0% 0.99% Naive Bayes 98.02% 100.0% 0.0% 98.02% 1.98% Decision Tree 94.06% 96.04% 3.96% 98.02% 1.98% 1718 Chapter 5. Results
5.2
Network Detection
The network performance did not have as good results as the local classifier. All the classifiers could be called unreliable since most of them have a high standard deviation. However, the decision tree has the highest score and the least variation in the k-cross validation test and achieved an accuracy of 89.6%.
5.2.1
K-Cross Validation
Classifier Fold 1 Fold 2 Fold 3 Average Stdev K-Neighbours 76.47% 92.5% 93.51% 87.49% 7.8% Naive Bayes 76.6% 77.08% 87.88% 80.52% 5.21% Decision Tree 83.33% 90.67% 94.74% 89.58% 4.72%
5.2.2
Score Measurements
Classifier Accuracy TP FP TN FN K-Neighbours 83.17% 91.09% 8.91% 92.08% 7.92% Naive Bayes 84.16% 100.0% 0.0% 84.16% 15.84% Decision Tree 91.09% 95.05% 4.95% 96.04% 3.96%5.3
Comparison
In this section, tables are presented in a side by side comparison based on the pre-vious results. This table is the average accuracy of all three classifiers for both local and network detection from the k-cross validation test.
K-Neighbours Naive Bayes Decision Tree
0 20 40 60 80 100 96.03 96 96.03 87.5 80.5 89.6 % Avg A ccuracy Local Network
5.3. Comparison 19 The table presents the standard deviation of all three classifiers for both local and network detection from the k-cross validation test. The value is supposed to be low because when there are a variation in performance there is a chance of over fitting.
K-Neighbours Naive Bayes Decision Tree
0 5 10 15 20 2.84 3.22 2.18 7.8 5.21 4.72 % Standard deviation Local Network
This table displays true positives(TP), false positives(FP), true negatives(TN) and false negatives(FP) in percent for all three classifiers based on previous results.
K-Neighbours Naive Bayes Decision Tree
0 5 10 15 20 0.99 0 3.96 0.99 1.98 1.98 8.91 0 4.95 7.92 15.84 3.96 %
Local(FP) Local(FN) Network(FP) Network(FN)
The results show that the local detection technique can achieve better accuracy. This will then also lead to less false positives and false negatives as shown in the tables. The tables also shows that the standard deviation of the network classifier is higher which can be a sign of overfitting and unreliable results.
Chapter 6
Analysis and Discussion
The results were not surprising that with the same ransomware samples and tech-niques the overall performance was better on a local level. The ransomware on the local system can be quite aggressive and are set to some specific behavior character-istics that are almost unavoidable such as re-creating or overwriting a large amount of files. While the network detection has to rely on patterns in communication since most of the available data is encrypted.
The classifiers built for local detection all had good accuracy and overall performance with the highest average accuracy of 96%. The standard deviation was between 2% and 3% which can be a bit worrying, however, the sample size is quite small and that can lead to higher percentages even if the actual variation is not too large. The classifiers built for network detection had not quite as good accuracy as local detection, with the highest average accuracy of 89.6%. The stability of these classi-fiers was low with the standard-deviation of 4.7%, 5.2%, and even 7.8%. This is most likely caused by two things, too much variation in ransomware families and unable to find the C&C server. A lot of other network detection with machine learning studies are focusing on a more narrow amount of ransomware families[11]. This means that it’s easier to find patterns in their communication with the C&C server and build features from there. With this, it would also be easier to find the communication with the server, because in this experiment a few ransomware had the ability to create a connection with legitimate services, which lead to a more difficult process of find-ing patterns that would fit ransomware usfind-ing this technique and the ones that didn’t. The lack of ransomware and goodware samples could be considered an issue for this experiment since these techniques rely on having a good amount of data. However, ransomware samples are scarce and it’s important to be able to create a classifier with small amounts of data. Compared to other problems such as spam where you can acquire thousands of different emails. We now have to find good features to create a fast and reliable classifier since any outlier will hurt the final results. It’s important to note the limitations of this supervised learning technique, which is that this only looks at the system when the execution of an application is completed, and cannot detect ransomware in real-time. This would mean that every new appli-cation would have to be run in a virtual environment before launching on the actual system.
Chapter 7
Conclusions and Future Work
This experimental study has been comparing local and network detection with a su-pervised machine learning technique. The initial reason behind the experiment was to discover if there are any differences in local detection and network detection. To test this an experiment was proposed where ransomware would be tested on multiple different classifiers for both a local and network level.
The ransomware was gathered from sources such as The Zoo[7], Malshare[3] and Virusshare[8]. Then the samples were executed in a virtual machine with anti-virtual machine detection, and Cuckoo extracting data from it. The data extracted were API calls from the system and intercepted network traffic, where the data was used for building and testing classifiers. The classifiers were then built and taken through a series of tests to validate their performance.
The results showed that the local detection were more accurate when detecting ran-somware in this particular experiment. The local detection had an average accuracy of 96% for all classifiers. The best performing classifier for network detection had 89.6% average accuracy, with more accuracy variety in each K-cross validation test. The weak performance of the network classifier could be because of the large spread of ransomware families since the communication is encrypted and therefore have to rely on communication patterns instead of actual messages. Also, not being able to reliably find the C&C server since some ransomware samples made connections to multiple legitimate services.
24 Chapter 7. Conclusions and Future Work
7.1
Future Work
The current ransomware detection techniques are not adequate if we want a safe internet. These techniques are outdated and easy for ransomware creators to bypass. In order to keep up with the massive production of ransomware, new detection tech-niques has to be introduced that can detect unseen ransomware. Further research on this topic could be done by answering these questions:
• Will changing the ransomware samples to more specific ransomware families affect the results?
References
[1] antivmdetection. https://github.com/nsmfoo/antivmdetection. Accessed: 2019-05-13.
[2] Cuckoo. https://cuckoosandbox.org/. Accessed: 2019-05-13. [3] Malshare. https://malshare.com/. Accessed: 2019-05-13.
[4] Oracle vm virtualbox. https://www.virtualbox.org/. Accessed: 2019-05-13. [5] Paranoid fish. https://github.com/a0rtega/pafish. Accessed: 2019-05-13. [6] Software informer. https://software.informer.com/software/. Accessed:
2019-05-13.
[7] Thezoo. https://github.com/ytisf/theZoo. Accessed: 2019-05-13. [8] Virusshare. https://virusshare.com/. Accessed: 2019-05-13.
[9] Omar M. K. Alhawi, James Baldwin, and Ali Dehghantanha. Leveraging Ma-chine Learning Techniques for Windows Ransomware Network Traffic Detection, pages 93–106. Springer International Publishing, Cham, 2018.
[10] Ross Brewer. Ransomware attacks: detection, prevention and cure. Network Security, 2016(9):5 – 9, 2016.
[11] Krzysztof Cabaj, Marcin Gregorczyk, and Wojciech Mazurczyk. Software-defined networking-based crypto ransomware detection using http traffic char-acteristics. Computers Electrical Engineering, 66:353 – 368, 2018.
[12] D. D. Caputo, S. L. Pfleeger, J. D. Freeman, and M. E. Johnson. Going spear phishing: Exploring embedded training and awareness. IEEE Security Privacy, 12(1):28–38, Jan 2014.
[13] Greg Cusack, Oliver Michel, and Eric Keller. Machine learning-based detec-tion of ransomware using sdn. In Proceedings of the 2018 ACM Internadetec-tional Workshop on Security in Software Defined Networks & Network Function Vir-tualization, SDN-NFV Sec’18, pages 1–6, New York, NY, USA, 2018. ACM. [14] T. Honda, K. Mukaiyama, T. Shirai, T. Ohki, and M. Nishigaki. Ransomware
detection considering user’s document editing. In 2018 IEEE 32nd International Conference on Advanced Information Networking and Applications (AINA), pages 907–914, May 2018.
26 References [15] Eugene Kolodenker, William Koch, Gianluca Stringhini, and Manuel Egele. Pay-break: Defense against cryptographic ransomware. In Proceedings of the 2017 ACM on Asia Conference on Computer and Communications Security, ASIA CCS ’17, pages 599–611, New York, NY, USA, 2017. ACM.
[16] Steve Mansfield-Devine. Ransomware: taking businesses hostage. Network Se-curity, 2016(10):8 – 17, 2016.
[17] M. Medhat, S. Gaber, and N. Abdelbaki. A new static-based framework for ransomware detection. In 2018 IEEE 16th Intl Conf on Dependable, Autonomic and Secure Computing, 16th Intl Conf on Pervasive Intelligence and Computing, 4th Intl Conf on Big Data Intelligence and Computing and Cyber Science and Technology Congress(DASC/PiCom/DataCom/CyberSciTech), pages 710–715, Aug 2018.
[18] C. Moore. Detecting ransomware with honeypot techniques. In 2016 Cyberse-curity and Cyberforensics Conference (CCC), pages 77–81, Aug 2016.
[19] M. Satheesh Kumar, J. Ben-Othman, and K. G. Srinivasagan. An investiga-tion on wannacry ransomware and its detecinvestiga-tion. In 2018 IEEE Symposium on Computers and Communications (ISCC), pages 1–6, June 2018.
[20] Yuki Takeuchi, Kazuya Sakai, and Satoshi Fukumoto. Detecting ransomware using support vector machines. In Proceedings of the 47th International Con-ference on Parallel Processing Companion, ICPP ’18, pages 1:1–1:6, New York, NY, USA, 2018. ACM.
[21] A. Zahra and M. A. Shah. Iot based ransomware growth rate evaluation and detection using command and control blacklisting. In 2017 23rd International Conference on Automation and Computing (ICAC), pages 1–6, Sep. 2017. [22] Wira Zanoramy A. Zakaria, Mohd Faizal Abdollah, Othman Mohd, and Aswami
Fadillah Mohd Ariffin. The rise of ransomware. In Proceedings of the 2017 International Conference on Software and e-Business, ICSEB 2017, pages 66– 70, New York, NY, USA, 2017. ACM.
![Figure 4.2: Print screen of paranoid fish[5]](https://thumb-eu.123doks.com/thumbv2/5dokorg/4985542.137171/25.892.221.674.345.707/figure-print-screen-of-paranoid-fish.webp)