THESIS
ANAEROBIC DIGESTION OF ORGANIC WASTES:
THE IMPACT OF OPERATING CONDITIONS ON HYDROLYSIS EFFICIENCY AND MICROBIAL COMMUNITY COMPOSITION
Submitted by Laura Paige Griffin
Department of Civil and Environmental Engineering
In partial fulfillment of the requirements For the Degree of Master of Science
Colorado State University Fort Collins, Colorado
Summer 2012
Master’s Committee:
Advisor: Susan K. De Long Sybil Sharvelle
ii ABSTRACT
ANAEROBIC DIGESTION OF ORGANIC WASTES:
THE IMPACT OF OPERATING CONDITIONS ON HYDROLYSIS EFFIENCY AND MICROBIAL COMMUNITY COMPOSITION
Anaerobic digestion (AD) is an environmentally sustainable technology to manage organic waste (e.g., food, yard, agricultural, industrial wastes). Economic profitability, however, remains a key barrier to widespread implementation of AD for the conversion of specific feedstocks (e.g., manure, the organic fraction of municipal solid waste (OFMSW), and agricultural residue) to energy. Specifically, high capital and operating costs and reactor instability have continually deterred the use of AD. In order to develop AD systems that are highly efficient and more cost-effective, it is necessary to optimize the microbial activity that mediates the digestion process. Multi-stage AD systems are promising technologies because they allow for separate process optimization of each stage and can enable processing of high-solids content waste. Leachate is recycled through the system, which reduces heating and pumping costs, as well as conserving water. The leachate recycle, however, leads to an increase in ammonia and salinity concentrations. At this time, the impact of reactor conditions (ammonia and salinity concentrations) on hydrolysis is not well understood. As hydrolysis is one rate-limiting step of the process in the conversion of refractory wastes (e.g., lignocellulosic materials), optimization of hydrolysis has the potential to radically improve the economic profitability of AD. The specific objectives of this research were to: 1) determine the effects of operating conditions on hydrolysis efficiency for a variety of solid wastes
iii
(manure, food waste, and agricultural residue); 2) determine hydrolysis kinetic parameters as a function of the operating conditions; and 3) identify characteristics of microbial communities that perform well under elevated ammonia and salinity concentrations.
To this end, small-scale batch reactors were used to determine hydrolysis efficiency and kinetic rates. Initially, the AD sludge inoculum was exposed directly to the high ammonia and salinity concentrations (1, 2.5, 5 g Total Ammonia Nitrogen (TAN)/L and 3.9, 7.9, 11.8 g sodium/L) as would occur in a reactor treating organic waste with leachate recycle. Results demonstrated a need to acclimate, or adapt, the microorganisms to high concentrations, as methane generation was significantly inhibited with high concentrations. Thus, the organisms were acclimated for two to four months to these testing conditions. The batch studies were repeated, and results demonstrated substantial improvement in hydrolysis efficiency and methane generation. However, although differences in kinetic rates were not statistically significant, general trends in hydrolysis rates suggested that hydrolysis efficiency decreases with increased ammonia and salinity concentrations for a variety of feedstocks (i.e., manure, food waste, agricultural residue). Additionally, results demonstrated that acclimation was necessary to achieve optimal hydrolysis rates. Furthermore, microbial community composition changes in the inocula post-acclimation indicated that reactor inoculation could help improve tolerance to elevated levels of ammonia and salinity to minimize reactor start-up times and improve economic viability.
iv
ACKNOWLEDGMENTS
I would first like to thank my advisor Dr. Susan De Long for her wisdom, support, encouragement, and patience. She always found the time to help with the inevitable problems that arise during research, and her guidance was invaluable throughout my research experience. Additionally, I would like to thank Dr. Sybil Sharvelle, who continually provided insight, guidance, and advice throughout the entire process.
I would also like to thank Dr. Mary Stromberger for her insightful comments on this manuscript and Dr. Kimberly Catton for kindly agreeing to take part in the defense. I would like to thank and acknowledge Emilie Lefevre and Lucas Loetscher for their technical contributions to this work. Finally, I thank my fiancé, Jordan Wilson, for his never-ending encouragement and faith.
v
TABLE OF CONTENTS
List of Tables ... viii
List of Figures ... ix
1.0 Introduction ...1
1.1 Research Motivation ...1
1.2 Research Objective ...2
1.3 Thesis Overview ...3
2.0 Background and Literature Review ...4
2.1 Microbiology of AD ...5
2.2 Currently Available AD Reactor Designs...6
2.2.1 Reactor Configurations ...6
2.2.2 Solids Content ...7
2.2.3 Number of Stages ...8
2.3 Current State of Technology ...9
2.3.1 AD of Manure ...9
2.3.2 AD of OFMSW ...11
2.4 Benefits and Challenges of Multi-Stage AD Technology ...13
2.5 Impact of Operating Conditions on Hydrolysis ...15
2.5.1 Ammonia Inhibition ...15
2.5.2 Salinity Inhibition ...17
2.6 Acclimation of Microbial Inocula ...18
2.7 Determining Hydrolysis Rates ...20
2.8 Molecular Biology Tools Useful to Engineers ...21
2.9 Summary ...24
3.0 Anaerobic Digestion of Manure: The Impact of Process Conditions on Hydrolysis Efficiency and Microbial Community Composition...25
3.1 Introduction ...25
3.2 Methods...28
3.2.1 Manure and Inoculum Collection ...28
vi
3.2.3 Acclimation of Microbial Inocula ...30
3.2.4 Analytical Methods ...31
3.2.5 Calculation of Hydrolysis Rates ...32
3.2.6 Microbial Community Composition Analysis ...33
3.2.7 Microbial Community Composition Statistical Analysis ...35
3.3 Results and Discussion ...35
3.3.1 Hydrolysis Rate Determination...35
3.3.2 Microbial Community Composition Analyses ...40
3.4 Conclusions ...43
4.0 Anaerobic Digestion of Food Waste: The Impact of Process Conditions on Hydrolysis Efficiency and Microbial Community Composition...45
4.1 Introduction ...45
4.2 Methods...47
4.2.1 Food Waste and Inoculum Collection...47
4.2.2 Hydrolysis Batch Reactor Set-up ...48
4.2.3 Acclimation of Microbial Inocula ...48
4.2.4 Analytical Methods ...48
4.2.5 Calculation of Hydrolysis Rates ...48
4.2.6 Microbial Community Composition Analysis ...49
3.2.7 Microbial Community Composition Statistical Analysis ...49
4.3 Results and Discussion ...49
4.3.1 Hydrolysis Rate Determination...49
4.3.2 Microbial Community Composition Analyses ...52
4.4 Conclusions ...55
5.0 Conclusions ...57
Appendix A: Hydrolysis Kinetic Rates for Agricultural Residue ...60
Appendix B: Nutrient Solution Preparation ...62
Appendix C: Glucose Controls ...64
Appendix D: Acclimation of Inoculum ...67
vii
Appendix F: Hydrolysis Kinetic Rates for Food Waste ...78 References ...81
viii
LIST OF TABLES
Table 2.1 Excerpt of operational digesters treating manure in the U.S ...10
Table 3.1 Characteristics of inocula and substrate...29
Table 3.2 Kinetic rate values according to regression analyses ...37
Table 4.1 Characteristics of inocula and substrate...48
Table 4.2 Kinetic rate values according to regression analyses ...50
Table A.1 Kinetic rate values according to regression analyses ...61
Table E.1 qPCR primer sequences* ...72
Table E.2 Kinetic rate values determined via regression analyses ...74
Table E.3 Biomass measurements for manure-fed inocula ...74
Table E.4 Effect of biomass concentration on measured hydrolysis rates ...75
ix
LIST OF FIGURES
Figure 2.1 AD process flow chart. ...6
Figure 2.2 Multi-stage AD process ...14
Figure 2.3 pKa table for ammonia ...16
Figure 3.1 Batch reactors for determining hydrolysis kinetic rates ...30
Figure 3.2 Regression analyses for a range of ammonia concentrations (β= 0.49) ...36
Figure 3.3 Regression analyses for a range of salinity concentrations (β = 0.49) ...36
Figure 3.4 Electropherograms illustrating mcrA–targeted peaks ...41
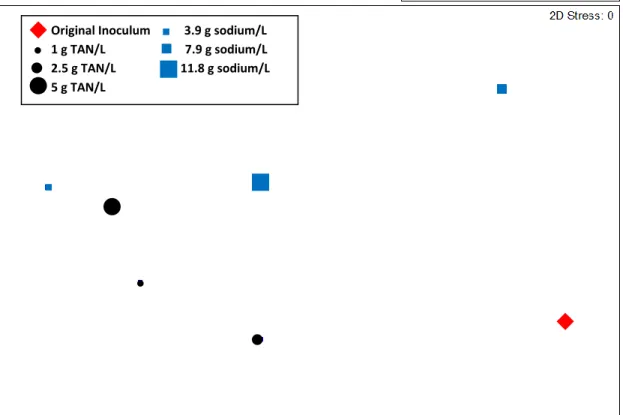
Figure 3.5 Multidimensional scaling plot based on mcrA-targeted T-RFLP ...42
Figure 4.1 Regression analyses for a range of ammonia concentrations (β= 0.11) ...49
Figure 4.2 Regression analyses for a range of salinity concentrations (β= 0.11) ...50
Figure 4.3 Electropherograms illustrating mcrA-targeted peaks ...53
Figure 4.4 Multidimensional scaling plot based on mcrA-targeted T-RFLP ...54
Figure A.1 Regression analyses for a range of ammonia concentrations ...60
Figure C.1 Methane production over time for a range of ammonia concentrations for inocula used in manure batch tests ...64
Figure C.2 Methane production over time for a range of salinity concentrations for inocula used in manure batch tests ...64
Figure C.3 Methane production over time for a range of ammonia concentrations for inocula used in food waste batch tests ...65
Figure C.4 Methane production over time for a range of salinity concentrations for inocula used in food waste batch test ...65
Figure D.1 Methane production for directly exposed inoculum to high ammonia concentrations (glucose as substrate) ...67
Figure D.2 Methane production for directly exposed inoculum to high salinity concentrations (glucose as substrate) ...68
Figure D.3 ATP concentration for directly exposed inoculum to high ammonia concentrations (glucose as substrate) ...68
Figure D.4 ATP concentration for directly exposed inoculum to high salinity concentrations (glucose as substrate) ...69
x
Figure D.5 Methane production for acclimated inoculum to high salinity concentrations
(glucose as substrate) ...70
Figure E.1 Regression analyses demonstrating the impact of biomass (by volume)...73
Figure F.1 Regression analyses for a range of ammonia concentrations (β= 0.11) ...78
1
1.0 Introduction
1.1 Research Motivation
Recent increases in environmental regulations for pollutant minimization have demonstrated the need for safe and effective methods of organic waste disposal. Anaerobic digestion (AD) is an environmentally sustainable technology for converting a variety of feedstocks (waste sources) including manure, the organic fraction of municipal solid waste (OFMSW), and agricultural residue to energy in the form of methane (Demirer et al., 2005a). Furthermore, the digestion of multiple feedstocks (co-digestion) has the potential to increase overall energy generation through synergistic interactions. Anaerobic digestion involves a series of processes that first break down organic matter into sugars and amino acids via hydrolysis. Acidogenic and acetogenic bacteria convert these products into acetic acid, which is then converted to methane via methanogenesis.
Current AD technologies for the treatment of manure and OFMSW are often nonviable in the U.S. due to lack of economic profitability. In arid regions, manure is often collected via means that result in a high-solids waste, and since water is a scarce resource, reactors that are able to effectively digest this high-solids feedstock are needed. Furthermore, since the cost of landfilling (the most common method of MSW management) in the U.S. is low, it is difficult for existing sustainable alternative waste treatments, such as AD, to compete as viable treatment methods. Additionally, reactor instabilities specific to the treatment of high-solids manure and OFMSW (e.g., build-up of toxic products such as rapid volatile fatty acid (VFA) accumulation) have contributed to decreased digestion efficiency and loss of profits. Therefore, digesters capable of
2
stable performance and economic profitability are needed to allow for the widespread AD implementation treating high-solids manure and OFMSW.
Multi-stage AD systems are a promising technology for the treatment of manure and OFMSW, but key operating parameters that determine reactor stability and efficiency are still not fully understood. AD is a microbially-mediated process, and previous research has demonstrated that the organisms which mediate each process perform optimally under different conditions (Ward et al., 2008). Multi-stage AD systems separate each process of the system, allowing for individual process optimization. This type of system may also recycle leachate through the system to conserve water and reduce energy costs; however, this recycle may result in a build-up of ammonia and salinity, which can inhibit microbial waste conversion at high concentrations. Fresh water can be used to decrease the concentrations of these inhibitors, but this additional consumption leads to an increase in heating and pumping costs. Thus, the optimal balance of energy and water consumption versus process efficiency must be determined to maximize the economic benefit of the system.
1.2 Research Objective
Since hydrolysis is a rate-limiting step in the breakdown of lignocellulosic material, optimization of this step has the potential to greatly increase economic profitability. However, hydrolysis remains one of the least understood steps in the process (Miron et al., 2000; Gavala et al., 2003), and studies examining the impact of operating conditions (e.g., ammonia and salinity concentrations) on hydrolysis are needed to guide reactor design and operation. Thus, the objective of this research was to investigate the effects of operating conditions (e.g., ammonia and salinity concentrations)
3
on hydrolysis efficiency of manure, OFMSW, and agricultural residue and determine hydrolysis kinetic parameters as a function of ammonia and salinity concentrations. Additionally, this study sought to identify microbial community characteristics that lead to optimal process performance.
1.3 Thesis Overview
The following chapter (Chapter 2) presents an introduction to AD, designed to familiarize the reader with the current state of technology for manure and OFMSW and associated challenges that are barriers to economically profitable implementation. Research was conducted to determine hydrolysis kinetic rates and microbial community composition for the AD of manure and food waste (a component of OFMSW) and is presented in Chapters 3 and 4, respectively. The last chapter (Chapter 5) is dedicated to summarizing the findings and implications of this study and recommends future work. The appendices include additional research conducted on hydrolysis for agricultural residues (Appendix A) and supplemental methods and data involved in the determination of hydrolysis rates.
4
2.0 Background and Literature Review
AD has the potential to address two large issues facing today’s society: manure management and OFMSW treatment. First, the issue of manure management has become increasingly important as current practices of manure disposal (e.g., composting for land application, anaerobic lagoons) by concentrated animal feeding operations (CAFOs) contribute to surface and groundwater pollution and release significant volumes of methane to the atmosphere (US EPA, 2011; Gloy, 2011). Because methane has 21 times the Global Warming Potential (GWP) of carbon dioxide (Gloy, 2011), avoiding methane emissions is critical. Secondly, heightened interest in diverting MSW from landfills has been demonstrated by recently issued programs (e.g., recycling programs) and policies (Levis et al., 2010). Currently, approximately 54% of MSW is disposed of in landfills (US EPA, 2008), with approximately 50-70% of MSW being organic material (Verma, 2002). Although the OFMSW is a potential energy source, difficulties associated with the diversion of the organic fraction (e.g., expensive and complex equipment), alternative treatment costs, and process reliability have slowed landfill diversion. AD provides a means for utilizing valuable organic waste (e.g., waste that would ultimately end up in landfills), but future work is needed to improve process reliability and economic benefits. This chapter provides a discussion of the AD microbiological process and available AD designs, followed by a description of the current state of AD technology for manure and OFMSW. It also presents an in-depth discussion on benefits, challenges, and operating parameters associated with multi-stage AD systems. Finally, because on-going efforts to develop and optimize AD technologies can be guided by molecular biology
5
tools to track the required microorganisms, a description of appropriate molecular biology tools is included.
2.1 Microbiology of AD
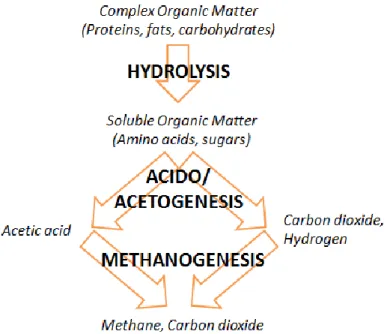
To engineer economically viable AD systems for the treatment of manure and OFMSW, it is first necessary to understand the microbiology that mediates the digestion process. The AD system is divided into three processes: hydrolysis, acidogenesis/ acetogenesis, and methanogenesis. As shown in Figure 2.1, first hydrolytic bacteria convert complex organic matter (proteins, fats, and carbohydrates) present in the waste feedstock into soluble fatty acids and other organic monomers. This process is mediated by hydrolytic enzymes including proteases, which degrade proteins, lipases, which degrade fats, and cellulases, which degrade cellulose. Next, acidogenesis converts the hydrolysis products (amino acids, fatty acids, and sugars) into VFAs, alcohols, carbon dioxide, and hydrogen. Byproducts, including ammonia and hydrogen sulfide, are also produced (Strik et al., 2005). Acetogenesis further converts the acidogenesis products into acetic acid, carbon dioxide, and hydrogen. In the final process, methanogenic Archaea produce methane from the products of acido/acetogenesis. There are two main types of microorganisms responsible for methane formation: acetoclastic methanogens and hydrogen-utilizing methanogens. Acetoclastic methanogens split acetate (an electron donor) into carbon dioxide and methane (Lachavanne et. al., 1997). Hydrogen-utilizing methanogens use hydrogen and reduce carbon dioxide to form methane (Mara et al., 2003). The former pathway is the dominant mechanism and typically accounts for approximately 70% of methane production in AD reactors because hydrogen is limited in AD (Mara et al., 2003; Monnet, 2003; Verma, 2002).
6
Figure 2.1 AD process flow chart
2.2 Currently Available AD Reactor Designs
A variety of different AD reactor designs have been developed to date. These AD systems may be classified according to the following characteristics:
Reactor configuration (batch or continuous)
Solids content (wet or dry)
Number of stages (single-stage, two-stage, or multi-stage) 2.2.1 Reactor Configurations
In batch systems, a reactor is loaded with feedstock, run to completion, emptied and reloaded. Batch reactors benefit from technical simplicity and low operating costs. However, they require a larger footprint due to lower organic loading rates than continuously fed reactors (Verma, 2002). Additionally, batch reactors often suffer from instability in microbial populations, and since AD is a microbially-mediated process, the
7
efficiency of the digestion process depends upon the stability of the microorganisms present.
In continuous systems, reactors are continuously fed feedstock, allowing a steady-state to be reached in the reactor with a constant gas yield. Two conventional continuous feed reactor configurations are completely-stirred reactors (contents of reactor are mixed by mechanical agitation or effluent or biogas recirculation) and plug-flow reactors (contents of reactor are pushed along a horizontal reactor). Although continuous reactors have higher operating costs due to pumping requirements, these reactors are able to maintain microorganisms within the system, thereby avoiding lag times associated with microorganism growth in batch reactors (Chaudhary, 2008).
2.2.2 Solids Content
Digesters may be further classified according to the total solids (TS) content of the waste to be digested. Batch reactors may be operated as either wet reactors (less than 15% TS) (Tchobanoglous et al., 1993) or dry reactors (22-40% TS) (Verma, 2002). Conventional wet technologies include complete mix reactors and plug-flow digesters and operate at maximum solids contents of 3-10% and 10-14%, respectively (Wilkie, 2005; Demirer and Chen, 2005b). For high-solids wastes including manure and OFMSW, to maintain a solids content less than 14%, high volumes of water may be required to dilute wastes, which increases capital and operating costs because large reactor volumes are required and heating and pumping requirements are increased (Verma, 2002). Therefore, dry reactors are often used to digest high-solids waste. Dry reactors are characterized by smaller AD reactor footprints than wet reactors (Verma, 2002) and often operate as vertical, high-solids plug-flow reactors (Rapport et al., 2008). However,
8
conventional dry reactors also require an increased energy input to move and/or pump the waste through the reactor in comparison to a diluted, low-solids content reactor (e.g., complete mix or low-solids plug-flow systems) (Verma, 2002).
2.2.3 Number of Stages
Digesters also can be operated as single-stage, two-stage, or multi-stage reactors. Single-stage reactors are the simplest of reactor configurations. In single-stage systems, all the digestion processes take place in one reactor, and these systems benefit from lower capital and operating costs (Vandevivere, 2002; Kelleher, 2007). In contrast, two-stage reactors separate the hydrolysis and acido/acetogenesis processes from methanogenesis. In the first stage, digestion is limited by the rate of hydrolysis of cellulosic materials; the second stage is typically limited by the rate of microbial growth (Chaudhary, 2008). Two-stage designs allow for separate optimization of each process (e.g., longer biomass retention times in the methanogenesis reactor), which can increase biogas yield because hydrolytic and methanogenic bacteria are known to have different optimal conditions (Verma, 2002), Additionally, this type of reactor is more stable than single-stage reactors (Chaudhary, 2008; Vandevivere, 2002), as the latter are more subject to process failures due to pH changes or ammonia build-up (Chaudhary, 2008; Rapport et al., 2008). For example, in a two-stage system, pH may be adjusted prior to flow through the methanogenesis reactor. As with continuously fed reactors, microorganisms may be retained in this system. Furthermore, multi-stage reactors may be used to separate each process (e.g., hydrolysis, acido/acetogenesis, and methanogenesis) into three reactors, providing further process control and optimization over each process and increased methane yields.
9 2.3 Current State of Technology
2.3.1 AD of Manure
Historically, traditional methods of manure management have not been environmentally sustainable. Anaerobic lagoons are a common method of treating livestock waste (Wang et al., 2004) that have been successfully implemented since the early 1960s (Safley and Westerman, 1992), but they accounted for over 60% of North American methane emissions to the atmosphere from animal waste in 1990 (Sharpe and Harper, 1999; Adler, 1994). In 2010, methane emissions from livestock manure management (primarily lagoons) continued to rise relative to the 1990s and accounted for approximately 8% of total U.S. anthropogenic methane emissions (US EPA, 2010). Thus, alternative manure management technologies are needed.
AD is an attractive alternative for manure management because it allows methane to be captured and used as an energy source. However, farm-based AD reactors traditionally have experienced high failure rates largely due to issues such as poor installation or equipment failure (e.g., generators) (Frame et al., 2001). For example, up until 1998, more than 60% of on-farm digesters failed (Lusk, 1998). Improved system design and installation practices, as well as heightened understanding of operational parameters (e.g., optimal pH or VFA concentrations), has enhanced the performance of farm-based AD systems; furthermore, recent increased use of co-digestion on farms has helped increase process stability through feedstock synergisms and improved methane yields to become more economically feasible (Paul, 2008). Currently, the majority of farm-based AD systems treat mostly manure (AgSTAR EPA, 2011), and it is estimated that there are 176 anaerobic digesters in operation at commercial livestock farms in the
10
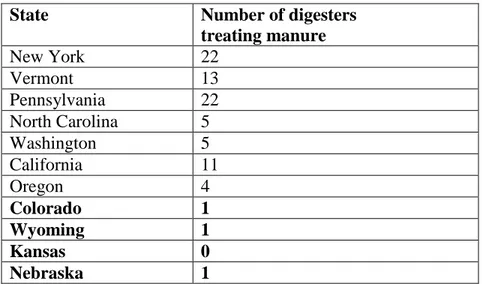
U.S. (AgSTAR EPA, 2011). As seen in Table 2.1, the majority of digesters are located in the Eastern U.S., with a few digesters operating along the western coast.
Table 2.1 Excerpt of operational digesters treating manure in the U.S. (AgSTAR EPA, 2011)
State Number of digesters
treating manure New York 22 Vermont 13 Pennsylvania 22 North Carolina 5 Washington 5 California 11 Oregon 4 Colorado 1 Wyoming 1 Kansas 0 Nebraska 1
Clearly, regional factors play a large role in the feasibility of AD systems treating manure. Of the digesters in operation, approximately 30% of the AD systems are operated as complete-mix systems and 47% are plug-flow reactors (AgSTAR EPA, 2011). As manure is often collected by wet scraping (using large volumes of water to scour manure from concrete gutters) in the Eastern U.S., which results in solids contents of approximately 12% (Demirer and Chen, 2005b), these conventional technologies are suitable and economically viable. However, this type of manure collection results in a high water usage that is simply not an option in arid regions. As a result, dry scraping of manure is employed, utilizing tractor-mounted blades to scrape manure from the lots. Dry scraping is also used in cold regions, where freezing conditions prevent the use of flushing or necessitate infrequent collection. The solids content of manure collected via dry scraping is greater than 25% (Hall et al., 1985), and further dilution of the waste with
11
water is often either impractical or unfeasible because of increased costs and resource consumption. Consequently, pumping and mixing of the manure are unachievable, thereby rendering continuously-stirred and plug-flow reactors nonviable or non-profitable for application in arid regions. As a result, alternative designs capable of maintaining reactor stability and that require minimal water usage are needed to effectively digest high-solids waste including dry scraped manure.
2.3.2 AD of OFMSW
Municipal solid waste (MSW), encompassing refuse generated by a community with the exception of industrial, construction, hazardous, or agricultural waste (Tchobanoglous et. al, 1993; US EPA, 2012), is a prevalent waste source that has historically caused environmental concern. In 2009, Americans alone generated 243 million tons of MSW, over half of which ended up in landfills (US EPA, 2009). Because landfills are estimated to be the second highest source of anthropogenic methane emissions in the U.S. (Levis and Barlaz, 2011; US EPA, 2010) and require a large land footprint, waste diversion is needed. Since OFMSW (e.g., food waste, wood, paper) accounts for approximately 50-70% of the total waste material (Braber, 1995; Kayhanian, 1994), this waste represents a valuable, underutilized energy source.
The implementation of AD systems treating OFMSW varies greatly by world regions due to differences in economic profitability. Currently, AD of OFMSW is widespread in Europe; approximately 200 plants spanning over 17 countries that treat mixed MSW and biowaste (source separated, biodegradable MSW) are currently in operation (De Baere and Mattheeuws, 2010). This successful application is due largely to economic initiatives (high energy prices, high tipping fees, and tax incentives) in Europe
12
and to European Union requirements that by 2016 Member States must reduce the amount of landfilled organic waste by 65% relative to 1995 levels (Levis et al., 2010; Rapport et al., 2008). Despite such an abundance of digesters in Europe, there is only full-scale digester treating OFMSW in North America (Canada). The city of San Jose, CA recently received permission to implement a digester treating commercial organic waste and construction is underway (Zero Waste Energy, 2012). The main factors contributing to lack of use of AD for OFMSW treatment in the U.S. are cost and process reliability. Overall cost could be improved by energy-supported regulations (e.g., tipping fees, tax credits, carbon credits) (Rapport et al., 2008) or more efficient, economically viable AD technologies through reduced capital and operating costs and increased profits from energy generation.
Reactor instabilities and operational challenges in conventional technologies treating OFMSW decrease process performance and lead to a loss of economic profits. OFMSW can form scum layers that cause clogging in pipes due to its heterogeneous nature and tendency to separate (Rapport et al., 2008), and pretreatment of OFMSW is often required for homogenization prior to digestion which requires complex equipment and leads to a loss in organic solids (Rapport et al., 2008). As OFMSW typically contains 30-60% solids, large volumes of water also are required to dilute the waste to appropriate levels for application in wet digesters (Rapport et al., 2008). Additionally, toxic compounds present in OFMSW (e.g., heavy metals) can diffuse through reactors in wet systems and inhibit microbial activity (Vandevivere, 2002). Most notably, since portions of OFMSW (e.g., non-cellulosic food waste components) degrade rapidly during hydrolysis, acid build-up in reactors is a common occurrence, and pH drops have been
13
shown to greatly inhibit methanogenic activity (Cho et al., 1995). Thus, AD systems that are economically profitable and stable (e.g., prevention against pH shock) are necessary to allow for implementation in the U.S.
2.4 Benefits and Challenges of Multi-Stage AD Technology
Multi-stage AD systems that utilize a “dry” hydrolysis process are promising technologies that can be designed to overcome the main barriers associated with digestion of dry-scraped manure and OFMSW: high-solids content and rapid VFA accumulation, respectively. As shown in Figure 2.2, fresh organic matter can be packed in leachate bed reactors (LBRs), which can be operated as batch reactors with leachate recirculation. Water is largely conserved through leachate recirculation (Shahriari et al., 2012), thus making this system a suitable applicable in arid regions, and heating and pumping requirements are also reduced. Leachate from the LBRs can be pumped and held in a compositing tank, where acido/acetogenesis occurs. Leachate is then fed to the high-rate methanogenic reactor continuously. The high-rate methanogenic reactor may be a fixed-film reactor (reactor that utilizes support materials to maintain biofixed-film and prevent washout of microorganisms) or an upflow anaerobic sludge blanket (USB) reactor (reactor containing a thick sludge layer that degrades waste flowing upward). The acido/acetogenic and methanogenic stages act as continuous reactors, which results in constant gas production (Chaudhary, 2008).
14
Figure 2.2 Multi-stage AD process
*High-rate methanogenic reactor may be fixed-film reactor or upflow anaerobic sludge blanket reactor.
Although the leachate recirculation is highly desirable to conserve water, it also creates challenges including build-up of ammonia (by-product of AD) and salinity in the aqueous phase (Shahriari et al., 2012). While there is a great wealth of knowledge concerning optimum operating conditions for methanogenesis (Chen et al., 2008), currently there is little understanding of the impact of operating conditions on hydrolysis rates. This knowledge will help guide reactor design by determining leachate recycling ratios, and, consequently, the amount of additional fresh water and energy (e.g., heating and pumping) required to dilute elevated ammonia and salinity concentrations. As a result, reactor performance can be maximized in spite of the challenging conditions created by elevated ammonia and salinity concentrations. Hydrolysis is a rate-limiting step in the digestion of recalcitrant wastes such as lignocellulosic matter (Colberg, 1988; Nielsen et al., 2004; Pavlostathis and Giraldo-Gomez, 1991), and thus, optimization of this step has the potential to radically increase economic profitability of AD by lowering
15
required reactor volumes, decreasing operating costs, and increasing methane generation. Therefore, to render these systems more economically viable, additional research is needed to determine optimum operating conditions for hydrolysis.
2.5 Impact of Operating Conditions on Hydrolysis 2.5.1 Ammonia Inhibition
Inhibition of the overall AD process by ammonia is a common occurrence during the digestion of feedstocks with naturally high ammonia concentrations such as manure (Angelidaki and Ahring, 1993). Numerous studies have been conducted to determine the inhibitory levels of ammonia concentrations on methane production (Chen et al., 2003). Hulshoff Pol et al. (1982) reported a significant lag phase during the start-up of a USB reactor treating wastewater operating at 1 g NH4-N/L as compared to USB reactors begun
with 0.4 g NH4-N/L or less. Van Velsen (1979) reported gradually increasing
methanogenic inhibition to occur at concentrations from 0.72 to 4.95 g NH4-N/L during
the treatment of sewage sludge; however, methane production still occurred at concentrations of 4.96 g NH4-N/L. Several studies have reported half maximal inhibitory
concentration (IC50) for methanogenesis to occur at ammonium nitrogen concentrations
ranging from 4.0 to 12.8 g NH4-N/L (Gallert and Winter, 1997; Sung and Liu, 2003). For
example, Lay et al. (1998) determined the IC50 for methane production to occur from
4.09 – 5.55 g NH4-N/L, and toxicity levels (point at which methanogenesis levels were
not detectable) were reached at 5.88 to 6 g NH4-N/L. Hendriksen and Ahring (1991)
determined IC50 levels for methanogenesis to occur at 6 g NH4-N/L, and complete
16
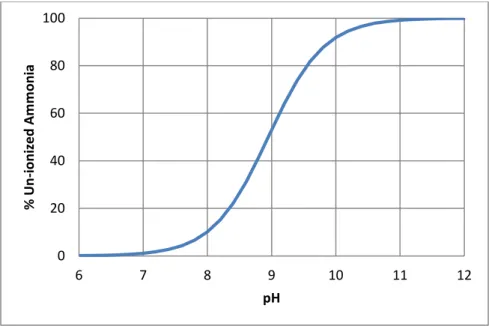
Past research has shown that the free ammonia (FA) concentration (NH3) in a
system is responsible for the ammonia inhibition observed (Braun et al., 1981; De Baere et al., 1984; Angelidaki and Ahring, 1993). The concentration of FA is dependent on three main parameters: total ammonia concentration, pH, and temperature (Hansen et al., 1998). For a given total ammonia concentration, FA concentration increases with increasing pH values (Figure 2.3). As the temperature of a system increases, the fraction of total ammonia that is in the form of FA also increases (Hansen et al., 1998). Thus, thermophilic digesters have been shown in several studies to be much more sensitive to ammonia toxicity (Braun et al., 1981; Van Velsen, 1981; Parkin and Miller, 1983; Angelidaki and Ahring, 1994).
Figure 2.3 pKa table for ammonia
As a result, reactors operating at high pH values (e.g., 8) and thermophilic temperatures may experience up to ten times the FA concentrations regarded as inhibitory (Hansen et al., 1998; Angelidaki and Ahring, 1993). Since not all papers report specific operating
0 20 40 60 80 100 6 7 8 9 10 11 12 % Un -i o n ize d Am m o n ia pH
17
conditions such as temperature or pH (or do not maintain constant pH values), it is often difficult to directly compare literature values; this lack of knowledge is one explanation for the wide range of inhibitory values reported because the values of total ammonia vary greatly with slight operational changes. Furthermore, differences in microbial communities could cause reactor inhibition at different ammonia concentrations. However, it is clear from the literature that ammonia inhibition studies have focused on the effects to methanogenesis, and research is needed to investigate the inhibition levels specifically on hydrolysis.
2.5.2 Salinity Inhibition
The concentration of dissolved solids (e.g., potassium, magnesium, calcium, and sodium) in an AD system at high levels can inhibit microbial activity (Chen et al., 2003). Sodium is one of the most prevalent cations found in organic wastes (e.g., manure, certain foods) that can interfere with microbial metabolism at high concentrations (Kugelman and McCarty, 1964; Rinzema et al., 1988; Gourdon et al., 1989). Several studies have been conducted to determine optimal and maximum sodium levels for methanogens. Sodium concentrations ranging from 0.1-0.2 g/L were found to be favorable for the growth of mesophilic anaerobes (McCarty, 1964). Similarly, Kugelman and Chin (1971) determined 0.23 g sodium/L to be the optimum concentration for mesophilic aceticlastic methanogens. Fang et al. (2011) found that methanogenic activity was reduced by 50% at 11 g sodium/L in the anaerobic digestion of manure. Numerous additional studies have determined a 50% inhibition level to occur from 5.6-53 g sodium/L for methanogenesis (Chen et al., 2003; Liu and Boone, 1991; Soto et al., 1993; Vallero et al., 2003). Despite the extensive research done on methanogenesis, however,
18
little research has been conducted to determine the impact of salinity on hydrolysis rates. Additionally, causes of the wide range of inhibitory values are not fully understood but could be attributed to several variables, such as differences in microbial communities present in the inocula or length of acclimation periods. Thus, research is also needed to determine the effects of acclimation on hydrolysis.
2.6 Acclimation of Microbial Inocula
Acclimation, the process of adapting microorganisms and microbial communities to a given set of environmental conditions, has been reported to increase the activity (e.g., methane generation rates) of microorganisms in the presence of inhibitors (Chen et al., 2008). Koster and Lettinga (1984) determined that methanogenic sludge could adapt to gradually increasing concentrations of ammonium-nitrogen up to 1.7 g NH4-N/L without
causing a significant lag in methane production; sludge exposed to concentrations of 2.1 g NH4-N/L immediately produced methane, but at lower rates. Hashimoto (1986)
reported ammonia nitrogen inhibition on methanogenesis at 4 g/L for acclimated cultures as compared to 2.5 g/L for unacclimated cultures. Koster and Lettinga (1988) studied the anaerobic digestion of potato waste and observed methanogenic activity at total ammonia nitrogen (TAN) concentrations (NH3-N + NH4+-N) as high as 11.8 g/L after adaptation,
in contrast to observed methanogenic toxicity at 1.9 g/L before adaptation. Similarly, studies also have demonstrated improved reactor performance as a result of acclimation to high sodium concentrations (Chen et al., 2008). Mendez et al. (1995) reported an increase from 12.0 to 17.0 g sodium/L in the 90% inhibition level of methanogens from anaerobic sludge after an acclimation period of 719 days. Chen et al. (2003) reported
19
methanogenesis toxicity increased from 12.7 to 22.8 g sodium/L after acclimation to 4.1 and 12.0 g sodium/L, respectively.
However, this phenomenon of acclimation is not fully understood (Chenowyth et al., 1987). There are two possible mechanisms of adaptation: (1) changes within the predominant existing microorganisms (i.e., changes in activity due to enzyme regulation), and (2) microbial community population shifts due to selective growth of specific microorganisms (Fry and Day, 1992). Interestingly, acclimation of microorganisms (specifically, methanogens) to higher salinity concentrations has produced mixed results. Rinzema et al. (1988) was unable to adapt a pure culture of Methanothrix sp. to higher salinity concentrations of 14 g sodium/L after a 12 week period. This suggests that the Methanothrix sp. is not capable of adaptation via mechanism #1, and the Methanothrix sp. would not be selected for during the adaptation of a mixed community. Additionally, Vallero et al. (2002, 2003) reported that sodium tolerance levels of sulfate-reducing microorganisms cultured under thermophilic conditions could not be increased through gradual additions of sodium chloride to 9.8 g sodium/L. Thus, since the results of acclimation studies have demonstrated varying effects on performance, the process of acclimation as a technique for improving performance cannot be considered fully reliable at this time. Furthermore, since the acclimation strategies that maximize performance are not well documented, and methods of acclimation can vary widely (e.g., acclimation time, sudden or gradual chemical additions), indicators of acclimation performance (e.g., methane generation, microbial community response) need to be monitored to determine the most efficient means of acclimation.
20 2.7 Determining Hydrolysis Rates
The study of kinetics can provide a quantitative measure of hydrolysis behavior (Luo et al., 2012) and help guide the design and operation of reactors by determining the effects of operating conditions on hydrolysis. A wide range of different hydrolysis kinetic models have been successfully applied to AD systems, including first order models and modified first order models. Hydrolysis in AD systems has been traditionally modeled using a first-order kinetic rate via Equation 1 (Eastman and Ferguson, 1981):
S is the volatile solids concentration, t is the time (days) and k is the first-order rate coefficient (day-1). Thus, the cumulative processes taking place in hydrolysis, such as the different degradation rates of various particle sizes or compositions, are simplified into one first-order model (Eastman and Ferguson, 1981).
Hydrolysis, however, is often affected by the degradability of the substrate, especially with complex matter comprised of lignocellulosic materials (e.g., manure, components of food waste) (Vavilin et al., 2008). For example, research has reported the following organic fractions for various feedstocks: 82% (office paper, food waste), 72% (yard waste), and 22% (newsprint) (Kayhanian et al., 1991; Kayhanian and Tchobanoglous, 1992). When the biodegradability is less than 100%, it is important to modify Equation 1 to include the substrate biodegradability, which can be determined by batch studies. The first-order kinetic rate model including a biodegradability factor is as follows:
21
( ) β is the non-degradable fraction of the substrate, and S0 is the initial substrate
concentration.
Additionally, recent studies have suggested that hydrolysis rates also are affected by high inoculum-to-feedstock ratios (Fernandez et al., 2001). As a result, Equation 2 may be modified to account for biomass concentration or activity:
( ) X is the hydrolytic biomass concentration and n is a power index. For example, Sanders (2001) demonstrated different hydrolysis rates for the degradation of gelatin with different initial sludge concentrations using Equation 3. Thus, it is necessary to use Equation 3 to normalize hydrolysis rates when AD systems are limited by microorganism concentrations. However, if the system is saturated with biomass and additional inoculum does not improve rates, Equations 1 or 2 may be used to calculate hydrolysis rates. Additional variables, such as particle diameter (e.g., surface area limits rate) or shape, may also be included in kinetic models to allow for individual experiment optimization. 2.8 Molecular Biology Tools Useful to Engineers
Traditionally, engineers have relied upon macroscopic measurements (e.g., chemical oxygen demand (COD), VFA concentration) of the reactor influent and effluent as indicators of reactor performance, but this provides limited understanding of the microbial communities that mediate the process. Now, advanced molecular biology tools are able to provide detailed knowledge of microbial composition inside the reactors (Talbot et al., 2008). Anaerobic digesters contain complex microbial consortia (Riviere et
22
al., 2009), and it has been documented that microbial community composition can have notable impacts on reactor performance (McHugh et al., 2004; Carballa and Smits, 2011). For instance, several studies theorize that shifts in composition or quantity of microbial archaeal and bacterial communities can signal reactor instabilities (e.g., overload of organic input waste) and allow for preventative measures to be taken (McHugh et al., 2004; Lee et al., 2008).
Molecular biology tools can be used to establish correlations between the quantity of specific types of microorganisms present in AD systems and reactor stability and performance (Carballa and Smits, 2011). Although the majority of studies have focused on targeting the 16S rRNA gene to determine phylogenetic profiles of the microbial communities present in the reactors (Bouallagui et al., 2004; Sasaki et al., 2007; Chachkhiani et al., 2004), these tools provide limited information because phylogenetically related organisms displaying different functional capabilities cannot be readily distinguished. Tools targeting functional genes (e.g., genes involved in hydrolysis, acido/acetogenesis, or methanogenesis) provide more detailed information with respect to the quantities of microorganisms with specific functional capabilities (e.g., cellulose-hydrolyzing bacteria and methanogens). Quantitative polymerase chain reaction (qPCR) is a molecular technique that amplifies and quantifies a targeted gene (Hurst et al., 2007). qPCR targeting the 16S rRNA gene and mcrA gene (which encodes the alpha subunit of methyl-coenzyme M reductase) has been used successfully to characterize and quantify microorganisms in digesters. Conklin et al. (2006) utilized qPCR to determine if microbial community dominance of Methanosarcina leads to more stable digestion in response to engineered feeding frequencies. Traversi et al. (2011) used
23
qPCR to demonstrate the importance of Methanosarcina as bioindicators of reactor performance. Song et al. (2010) quantified methanogenic groups via the 16S rRNA gene to more accurately estimate methane production and biokinetic parameters to guide AD design and operation. Westerholm et al. (2011) used qPCR to conclude that the quantity of acetogens in an anaerobic digester was not affected by high ammonia levels (6.9 g NH4-N/L). This suggests that the acido/acetogenesis process in a multi-stage system
could be successfully operated at high ammonia levels, thus rendering the process more economically viable. However, very few studies have used qPCR to quantify cellulose-degrading bacteria in anaerobic systems to further optimize the hydrolysis process. Pereyra et al. (2010) recently developed a qPCR assay targeting the cel5 and cel48 families of cellulose-degrading bacteria for use in characterizing the microbial communities in sulfate-reducing bioreactors; however, these assays have not been applied to anaerobic digesters.
In addition to quantification, the identification of specific microorganisms present in reactors can help predict or improve reactor performance (e.g., bioaugment reactors with bacteria known to perform well under specific reactor conditions). Terminal restriction fragment length polymorphism (T-RFLP) is a rapid, low-cost molecular tool for microbial community profiling that can be used to track changes in microbial communities in response to engineered variables (e.g., feedstock, nutrient concentrations). For example, Collins et al. (2003) utilized T-RFLP targeting Archaea and Bacteria as a biomonitoring tool to demonstrate the stability of the archaeal communities and relative diversity of bacterial communities during the start-up of a psychrophilic anaerobic digester. Wang et al. (2009) reported community structure
24
differences in co-digesters depending upon the feedstock or organic loading rate; this knowledge suggests that reactors receiving different seasonal waste input could require an acclimation time to process the new waste.
However, the identification of hydrolytic organisms that are tolerant to high ammonia and salinity concentrations remains to be elucidated. Furthermore, assays that target functional genes (e.g., genes involved in cellulose degradation) are still very limited and only target specific families (e.g., cel48) of hydrolyzing genes.
2.9 Summary
Although AD is an ideal technology for the treatment of manure and OFMSW, feedstock-specific challenges to digestion (e.g., high solids) have prevented widespread implementation of AD systems. An appropriate multi-stage technology was proposed in this thesis that incorporates a leachate recycle to conserve water and reduce heating and pumping requirements. However, this recycle leads to an increase of ammonia and salinity concentrations, and currently there is a lack of knowledge concerning the effects of these specific operating conditions (e.g., ammonia and salinity concentrations) on hydrolysis efficiency. Increased understanding of reactor response and efficiency from these conditions will help guide reactor design and operation, ultimately maximizing economic benefit.
25
3.0 Anaerobic Digestion of Manure: The Impact of Process Conditions on Hydrolysis Efficiency and Microbial Community Composition
3.1 Introduction
Livestock manure generates over one billion tons of waste annually in the United States (Labatut et al., 2011). In 2010, methane emissions from livestock manure management (e.g., lagoons) accounted for approximately 8% of total U.S. anthropogenic methane emissions (US EPA, 2010). Because methane has a Global Warming Potential of 21 times carbon dioxide (Gloy, 2011), the need to reduce methane emissions is paramount. Furthermore, conventional methods of manure management (e.g., land application and lagoons) contribute to groundwater and surface water contamination (Wen et al., 2005;US EPA, 2011; Burkholder et al., 2007).As environmental regulations are becoming increasingly strict (such as requiring discharge permits for concentrated animal feeding operations (US EPA, 2008)), the development of efficient, environmentally-conscious methods of manure disposal is needed (Wen et al., 2004).
The AD of manure represents an environmentally sustainable technology for manure management that offers several advantages over conventional methods, including solids reduction, odor control, potential for nutrient recovery through post-AD composting, and biogas production for energy generation (Demirer and Chen, 2005a; Holm-Nielsen et al., 2009). While conventional wet AD reactor designs are able to effectively treat manure collected as a slurry (e.g., via wet-scraping), these systems operate at a maximum solids content of 10-16% (Ward et al., 2008; Demirer and Chen, 2005b), and regional climatic factors (i.e., arid conditions and freezing temperatures) often necessitate dry-scraping of manure or infrequent manure collection, which typically
26
leads to greater than 25% solids content (Hall et al., 1985). Dilution of these wastes is either impractical or unfeasible. Thus, conventional AD reactor designs are not suitable for application to manure in arid regions, and alternative designs are needed.
Multi-stage AD systems that utilize leachate-bed hydrolysis reactors are a promising technology that can convert high-solids wastes to biogas (Yang et al., 2003; Shin et al., 2010; Bouallagui et al., 2004). In these systems, leachate is trickled over the high-solids waste to promote hydrolysis. The leachate, which contains hydrolyzed waste in the form of VFAs, can be transferred to an acido/acetogenesis storage tank and subsequently passed to a high-rate methanogenesis reactor (e.g., fixed-film reactor) where biogas is produced. Physical separation of the processes (i.e., hydrolysis, acido/acteogenesis, and methanogenesis) results in a more stable and robust system that is resistant to reactor perturbations such as leachate acid spikes. Furthermore, each process can be optimized independently to maximize the activity of the specific microbes that mediate each process (Song et al., 2004; Ince, 1998; Demirer and Chen, 2005b; RIS International, 2005). Additionally, leachate can be recycled through the system to conserve water and reduce heating and pumping costs. However, one drawback of this approach is that leachate recycle leads to an increase in the aqueous phase concentrations of ammonia (by-product of AD) and salinity, which are originally present in the manure.
High ammonia and salinity concentrations have been shown to negatively impact methanogenesis and overall process performance (Kayhanian, 1994; Kugelman and McCarty, 1964). Although nitrogen is an essential nutrient for microorganisms and low concentrations of ammonia (less than 0.2 g/L) are beneficial to the digestion process (Liu and Sung, 2002; Chen et al., 2003), TAN concentrations ranging from 1.7 to 14 g TAN/L
27
have been shown to inhibit methane production by 50% (Sung and Liu, 2003; Bujoczek et al., 2000; Chen et al., 2008). Sodium is also a required nutrient for growth of microorganisms, and optimal sodium concentrations ranging from 0.1 to 0.23 g/L for mesophilic anaerobes have been reported (McCarty, 1964; Kugelman and Chin, 1971). However, higher sodium concentrations have been shown to inhibit methanogenesis; half maximal inhibitory concentration (IC50) values of 5.6 to 53 g/L of sodium have been
documented (Feijoo et al., 1995; Chen et al., 2003; Omil et al., 1995; Vallero et al., 2002; Liu and Boone, 1991; Soto et al., 1993; Vallero et al., 2003). The reasons for the discrepancies in reported IC50 values are unknown, but, for the studies reported in the
literature, reactor configurations, operating conditions, and microbial community adaptation periods varied. As past research has focused on optimization of methanogenesis or the overall performance of single-stage systems, the impact of ammonia and salinity concentrations on hydrolysis rates is not well understood.
The knowledge of the impact of ammonia and salinity concentrations on digester performance is needed to guide reactor design to determine optimal leachate recycling ratios, and, consequently, the amount of additional fresh water and energy (e.g., heating and pumping) required. Furthermore, strategies are needed to improve process performance in the presence of elevated ammonia and salinity concentrations (e.g., develop improved microbial seeds) to improve the economic viability of AD in arid regions. Hydrolysis is a rate-limiting step in the digestion of recalcitrant wastes such as lignocellulosic matter (Colberg, 1988; Nielsen et al., 2004; Pavlostathis and Giraldo-Gomez, 1991), and thus, optimization of this step has the potential to radically increase
28
economic profitability of AD by lowering required reactor volumes, decreasing operating costs, and increasing methane generation.
Therefore, the objective of this study was to determine the effects of operating conditions (e.g., ammonia and salinity concentrations) on hydrolysis rates, as well as identify characteristics of microbial communities that can effectively hydrolyze manure under conditions of high ammonia and salinity concentrations.
3.2 Methods
3.2.1 Manure and Inoculum Collection
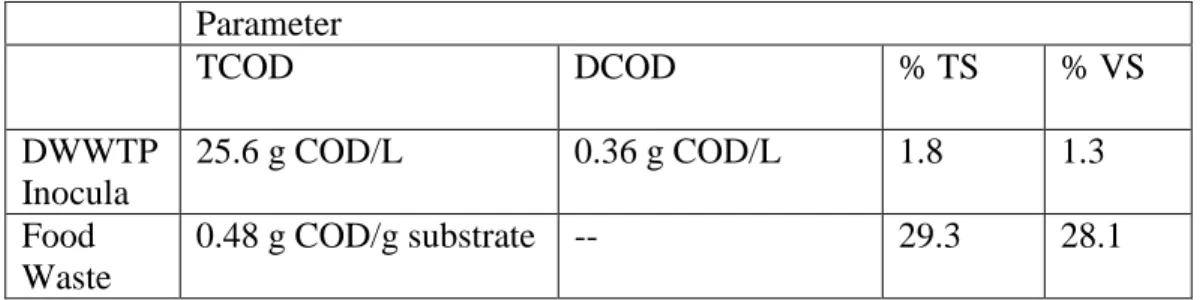
Manure was collected from Five Rivers Cattle Feeding LLC in Greeley, CO. The manure was ground and homogenized using a food blender (Hamilton Beach, Southern Pines, NC) and then sifted through a 0.5 mm mesh sieve. The ground manure was stored at 4°C for subsequent use. Microbial inoculum for batch reactor tests was collected from the Drake Municipal Wastewater Treatment Plant (DWWTP) mesophilic digester (Fort Collins, CO). The inoculum was purged with nitrogen gas and maintained at 35°C after collection. Manure and inoculum were analyzed for total and volatile solids (TS and VS, respectively) content, and total and dissolved chemical oxygen demand (TCOD and DCOD, respectively) prior to each experimental set-up as described in Section 3.2.4. The same initial manure and inoculum were used for every batch test to minimize compositional differences due to different collection periods. Initial characteristics of the inocula and substrate are shown in Table 3.1.
29
Table 3.1 Characteristics of inocula and substrate Parameter
TCOD DCOD % TS % VS
DWWTP Inocula
25.6 g COD/L 0.36 g COD/L 1.8 1.3
Manure 0.82 g COD/g substrate -- 71.2 41.3
3.2.2 Hydrolysis Batch Reactor Set-up
140-ml luer lock plastic syringes (Sherwood Medical, Northern Ireland) fitted with three-way luer lock valves (Cole Parmer, Vernon Hills, IL) were used as small-scale batch reactors to allow for biogas collection at constant pressure and anaerobic sampling (Figure 3.1). Digestion tests were conducted with 60 ml nutrient solution (Owen et al., 1978) (Appendix B) and 60 ml acclimated inoculum (Section 3.2.3). Manure was supplied at an initial concentration of 5 g COD/L. Ammonia (supplied as NH4Cl) and
salinity (supplied as NaCl) were added to the nutrient solution to produce nutrient solutions with high levels of ammonia (1, 2.5, and 5 g TAN/L) or salinity (3.9, 7.9, and 11.8 g sodium/L). Digestion tests were also conducted for “baseline” ammonia and salinity concentrations (0.14 g TAN/L and 1.2 g sodium/L, respectively) that were originally present in the nutrient solution. Syringes without manure were run as controls to measure gas production from the inoculum alone, and syringes with inoculum fed glucose as the sole carbon source were run to ensure that methanogenesis was not rate-limiting (Appendix C). Syringes were incubated in an incubator shaker (100 rpm) at 35°C. All tests were performed in triplicate. Hydrolysis reaction periods lasted approximately 10 to 15 days.
30
Figure 3.1 Batch reactor for determining hydrolysis kinetic rates
3.2.3 Acclimation of Microbial Inocula
Initial tests demonstrated the need for acclimation of the microbial inocula to the elevated ammonia and salinity concentrations tested (Appendix D). Thus, 1-L glass flask batch reactors were set up to acclimate microbial seeds to each of the ammonia and salinity concentrations listed above. Inoculum (200 ml) from DWWTP and nutrient solution (800 ml) were mixed and adjusted to the appropriate amount of ammonia (1, 2.5, and 5 g TAN/L) or sodium (3.9, 7.9, and 11.8 g sodium/L), and the pH was adjusted to approximately 7.1. All batch reactors were fed 5 g manure every two weeks, and 500 ml of the reactor contents were removed and replaced with 500 ml of fresh nutrient solution once a month to prevent buildup of inhibitory compounds, such as ammonia or hydrogen sulfide. Hydrolysis rates were determined for each culture after four months of acclimation. Since the baseline ammonia and salinity concentrations present in the
31
nutrient solution were not considered to be elevated, inocula subjected to 0.14 g TAN/L or 1.2 g sodium/L were not acclimated to the testing conditions prior to kinetic rate testing.
3.2.4 Analytical Methods
The volume of biogas produced during the reaction period was measured by determining the distance the syringe plunger moved, and gas volumes measured at 35ºC were converted to gas volumes at standard temperature and pressure using the Ideal Gas Law (Bettelheim et al., 2009). Gas samples were analyzed at room temperature via gas chromatography for methane composition using a Hewlett Packard Series 2180 gas chromatograph equipped with an Alltech column packed with HayeSep Q 80/100 mesh operating at injection and detector temperatures of 100°C. TS and VS of the inocula and substrate were measured according to the procedures documented in Standard Methods for the Examination of Water and Wastewater (APHA, 1995). Liquid samples were collected and analyzed for TCOD and DCOD using Hach’s COD High Range Vials and digestion colorimetric method according to the manufacturer’s instructions (Hach, Loveland, CO). Samples were filtered through a 0.2 μm syringe filter to remove particulate COD prior for DCOD analysis. To monitor the concentration of ammonia throughout the acclimation period and ensure that there was not a notable increase in the targeted concentrations (1-5 g TAN/L) resulting from a small volume of added manure in the flasks, Hach’s Nitrogen-Ammonia High Range Reagent Set was utilized according to the manufacturer’s instructions. Ammonia concentrations did not vary largely due to amounts contributed from the manure; thus, it was concluded that additional salt concentrations inherent in the manure were also negligible and were not factored into the
32
amount of sodium added to the nutrient solution. Free ammonia concentrations were calculated as a function of pH, temperature, and total ammonia nitrogen concentrations. 3.2.5 Calculation of Hydrolysis Rates
Hydrolysis rates were estimated in each batch reactor by isolating the hydrolysis step from methanogenesis. To determine hydrolysis kinetic rates, each immediate hydrolysis product (e.g., soluble products) and downstream products that already underwent acido/acetogenesis (e.g., methane) were included to account for all solubilized material in the system. Thus, hydrolysis kinetic rates were calculated for each batch test as follows. All of the hydrolysis products (immediate and downstream) were converted to COD equivalents, summed for each time point and divided by the initial COD input to the system to yield the extent of substrate solubilization using Equation 1 as described previously (O’Sullivan et al., 2008):
( )
Each reaction period lasted approximately 10-14 days, and it was concluded that any new biomass formed in the system was negligible in comparison to the COD from soluble compounds and methane formation; thus, this term was excluded from Equation 1. To determine the rate of hydrolysis, a first-order kinetic model was applied to the data according to the following equation:
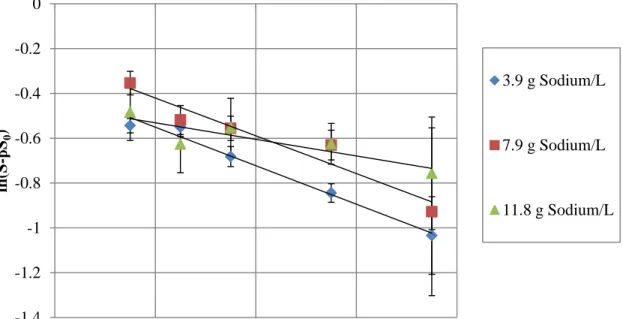
( ) ( )
S is the substrate concentration (1-Extent of Solubilization), t is the time (days), k is the first-order hydrolysis rate constant (day-1), β is the non-degradable fraction of the substrate, and S0 is the initial substrate concentration (Vavilin et al., 2008). β was
33
determined through long-term batch digestion tests. Kinetic rates were calculated for each individual reactor and then averaged over the triplicate reactors to estimate hydrolysis rates for each operating condition. Attempts to modify Equation 2 by including a biomass factor are described in Appendix E, but it was concluded that the methods of biomass measurement utilized were non-representative of actual biomass in the system.
3.2.6 Microbial Community Composition Analysis
To track changes in the microbial community composition as a function of each operating condition, functional gene-based terminal restriction length polymorphism (T-RFLP) analyses were conducted on DNA isolated from each acclimated and un-acclimated culture. At the end of each inocula acclimation period (4 months), DNA was extracted from culture samples using the MoBio PowerSoil DNA Isolation kit (MoBio Laboratories, Inc., Carlsbad, CA) according to the protocol and stored at -20°C. In an attempt to track changes to the hydrolyzing microbial communities, extracted DNA was subjected to PCR amplification of the cel5 and cel48 genes (genes encoding glycoside hydrolases of families 5 and 48) as described previously (Pereya et al., 2010; Lefevre, 2011). Despite repeated efforts utilizing DNA samples from a variety of reactor conditions (e.g., varying ammonia, salinity, and feedstock compositions), it was not possible to amplify cel genes present in the microbial communities examined in the present study using existing primers; thus, T-RFLP analysis was not possible. To track changes to the methane-producing microbial communities, T-RFLP analysis was conducted targeting mcrA (gene encoding the alpha subunit of methyl-coenzyme M reductase). Briefly, DNA was PCR-amplified using mcrA primers developed by Luton et al. (2002). The forward primer was labeled on the 5’ end with 6-carboxylfluorescein
34
dipivalate-6-aminohexyl amidite (6-FAM) dye. The amplifications were performed using a Bio-Rad S1000 Thermocycler (Bio-Rad Laboratories, Hercules, CA). Reactions consisted of 1X Reaction Buffer (5 Prime, Gaithersburg, MD), 1X PCR Enhancer (5 Prime), 1 mM Mg(OAc)2, 0.05 mM each dNTP (New England Biolabs, Ipswich, MA),
0.5 µl of formamide, 0.2 µM of each primer, 7 U Taq polymerase (5 Prime), 2 µl DNA template, and nuclease-free water to a final volume of 50 µl. The thermocycling program was as follows: 3 min at 95ºC, followed by 40 cycles of 40 s at 95ºC, 30 s at 56ºC, and 30 s at 68ºC, and a final extension of 7 min at 68ºC. Amplicons were treated with Klenow fragment as follows: 50 µl of PCR product was incubated with 2.5 U of Klenow fragment (New England Biolabs), 5.7 µl of 10X Buffer N2 (New England Biolabs), and 0.3 µl of 10mM each dNTP for 1 hr at 20ºC. The products were then purified using NucleoSpin Extract II (Macherey-Nagel, Bethlehem, PA) according to the manufacturer’s instructions and re-suspended in 35 µl of elution buffer. To gel purify correctly sized amplicons, 35 µl of the products were run on a 1% agarose gel; the bands were extracted using the NucleoSpin Extract II kit (Macherey-Nagel) according to the manufacturer’s instructions and suspended in 50 µl nuclease-free water. The purified amplicons were digested with 10 U each of restriction enzymes MspI and HaeIII (New England Biolabs) and 1X Buffer N4 (New England Biolabs) for 12 hr at 37ºC. The digestion products were cleaned-up using the QIAquick Nucleotide Removal Kit (Qiagen, Hilden, Germany), re-suspended in 50 µl elution buffer, and stored at -20 ºC. Products were submitted to the Colorado State University Proteomics and Metabolomics Facility for T-RFLP analysis.
35
3.2.7 Microbial Community Composition Statistical Analysis
T-RFLP data was analyzed via non-metric multi-dimensional scaling (NMDS) to identify and characterize microbial community changes. Estimated fractional abundances for each operational taxonomic unit (OTU) were calculated by dividing each fragment peak area by the total peak for a given electropherogram. Terminal restriction fragments (T-RFs) representing less than 5% of the total area were excluded to focus on the dominant members of the community and eliminate possible “background” T-RFs caused by the amount of labeled DNA loaded onto the separation gels (Sait et al., 2003; Rees et al., 2004). Then, T-RFLP data was analyzed using the statistical software Primer v6 (Primer-E Ltd, Plymouth, United Kingdom). The similarity matrices were calculated according to the Bray-Curtis coefficient:
{
∑ | |
∑ ( )}
Sjk represents the similarity between the jth and kth samples and yij represents the data in
the ith row and jth column (Clarke, 1993). NMDS plots were generated using 100 restarts and plots with stress values greater than 0.2 were omitted (Clark, 1993).
3.3 Results and Discussion
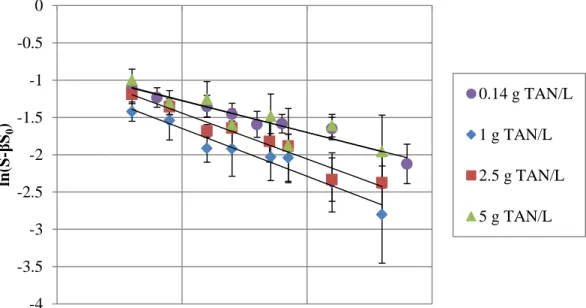
3.3.1 Hydrolysis Rate Determination
Regression analyses of the hydrolysis data according to Equation 2 are presented in Figures 3.2 and 3.3 as a function of the ammonia and salinity concentrations (1 - 5 g TAN/L and 3.9 - 11.8 g sodium/L), respectively.