AN ANALYSIS O F CSM GRADUATE DEGREES GRANTED BETW EEN
FALL 1988 AND SPRING 1991
By J u lia B. Long
All rights reserved INFORMATION TO ALL USERS
The qu ality of this repro d u ctio n is d e p e n d e n t upon the q u ality of the copy subm itted. In the unlikely e v e n t that the a u th o r did not send a c o m p le te m anuscript and there are missing pages, these will be note d . Also, if m aterial had to be rem oved,
a n o te will in d ica te the deletion.
uest
ProQuest 10783780Published by ProQuest LLC(2018). C op yrig ht of the Dissertation is held by the Author. All rights reserved.
This work is protected against unauthorized copying under Title 17, United States C o d e M icroform Edition © ProQuest LLC.
ProQuest LLC.
789 East Eisenhower Parkway P.O. Box 1346
A th e sis su b m itted to th e F acu lty an d th e B oard of T ru stees of th e Colorado School o f M ines in p a rtia l fulfillm ent of th e req u ire m e n ts for th e degree of M a ste r of Science (M athem atics).
G olden, C olorado D ate d c t m i Signed: ia B. Long A pproved: >r. R u th A. M a u re r T h esis A dvisor G olden, Colorado D ate 1 8 0 * * . m i D r. A rdel J . Boes P rofessor a n d H ead M a th em atics D e p a rtm e n t
ABSTRACT
T his th e sis analyzes th e ch aracteristics of 522 stu d e n ts who w ere aw ard ed CSM g ra d u a te degrees betw een F a ll 1988 an d S p rin g 1991. F o u r m e a su re s a re calculated in d e term in in g th e tim e to com plete a degree. The m e a su re s a re a tte m p te d h o u rs ta k e n , th e sis h o u rs ta k e n , te rm s ta k e n , an d c a le n d a r tim e to com plete a degree. In fo rm atio n a b o u t a stu d e n t's m ajor, degree, residency, citizenship, fu ll/p a rt tim e s ta tu s , fin an cial aid , p ro g ram ty p e, h o u rs, term s, sponsorship, a n d tim e to com plete th e degree is
included. S ta tistic s a re com puted for each c h aracteristic to te s t for differences betw een groups. I t is found t h a t some c h arac teristics cause s tu d e n ts to ta k e few er or g re a te r n u m b ers of h o u rs, th e s is h o u rs, te rm s, or y e a rs to com plete th e degree.
U sin g th e in fo rm atio n ob tain ed from th e sta tistic s, tw o sim u latio n m odels a re created. T he sim u latio n s a re d ep en d en t u pon th e ty p e of su p p o rt th e stu d e n t receives a n d th e fu ll/p art tim e sta tu s . V a ria tio n s are done on th e sim u latio n s: ch anging th e p ercen tag es of fu ll/p a rt tim e stu d e n ts h a s little effect upon th e h o u rs for a degree, b u t d ecreasin g th e h o u rs for p a r t tim e stu d e n ts begins to quickly drop th e h o u rs for a degree. T his stu d y w as done for th e CSM G ra d u a te School to provide background in fo rm a tio n for possible changes to th e fu ll/p a rt tim e ru le a n d tu itio n s tr u c tu r e .
P age
A B S T R A C T ...iii
LIST OF A P P E N D IC E S ... ... v
L IST O F F IG U R E S ... vi
LIST OF T A B L E S ... vii
ACK NO W LED G EM EN TS... viii
CH A PTER S 1. I n tro d u c tio n ... 1
2. M ethodology... , ...9
2.1 In tro d u c tio n to M ethodology ...9
2.2 S ta tistic s M ethodology... 10
2.3 S im u latio n M ethodology...15
3. S im u latio n A nalysis of CSM G ra d u a te D e g ree s... 22
3.1 P roblem D efinition a n d D a ta G a th e r in g ... 22
3.2 S im u la tio n ... 25
4. R e s u lts /C o n c lu s io n s ... 41
4.1 C om m ents on th e D a tab a se R e s u lts ... 42
4.2 C o m m en ts on th e S ta tis tic a l D ifferen ces... 43
4.3 C o m m en ts on S im u la tio n R e s u lts ... 45 4.4 C o n c lu s io n ... 51 FU T U R E R E S E A R C H ...54 R E FE R EN C ES C IT E D ... 56 SE L EC T E D B IB LIO G R A PH Y ...57 iv
L IST O F A PPEN D IC ES
Page
A PPE N D IX A: D a ta b a s e R e s u lts ...58 A. 1: E x p la n atio n of T e rm s... 59 A .2: D atab ase T a b le s...62 A .3: D is tr ib u tio n F ig u r e s ... 67A PPE N D IX B: S ta tis tic s ... 70
B .l: R egression E q u a tio n ...71 B.2: S ta tistic a l T e s ts ... 72 A PPE N D IX C: S im u la tio n ... 81 C .l: S im u latio n N e tw o rk s ... 82 C.2: S im u la tio n C o n tro l S ta te m e n ts ... 87 C.3: Sam ple O u t p u t ... 89 v
L IST O F FIG U R ES
P age
FIG U R E 1: S im u la tio n o f H o u r s ... 30
FIG U R E 2: S im u latio n of S u p p o rt a n d H o u r s ... 31
FIG U R E 3: S im u latio n #1 - M a ste rs Confidence I n te r v a ls ...46
FIG U R E 4: S im u latio n #1 - D octorate Confidence In te rv a ls ... 47
FIG U R E 5: S im u latio n #2 - M a ste rs Confidence I n te r v a ls ... 48
FIG U R E 6: S im u latio n #2 - D octorate Confidence In te rv a ls ... 49
FIG U R E A -l: M asters D istrib u tio n o f T e rm s ... 67
F IG U R E A-2: D octorate D istrib u tio n of T e r m s ...67
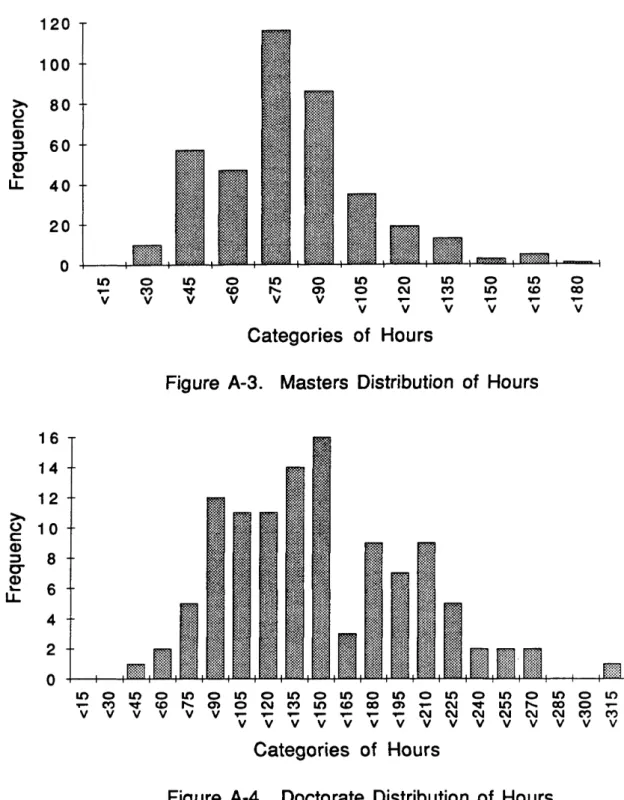
FIG U R E A-3: M a s te rs D istrib u tio n o f H o u rs ...68
F IG U R E A-4: D octorate D istrib u tio n of H o u rs ...68
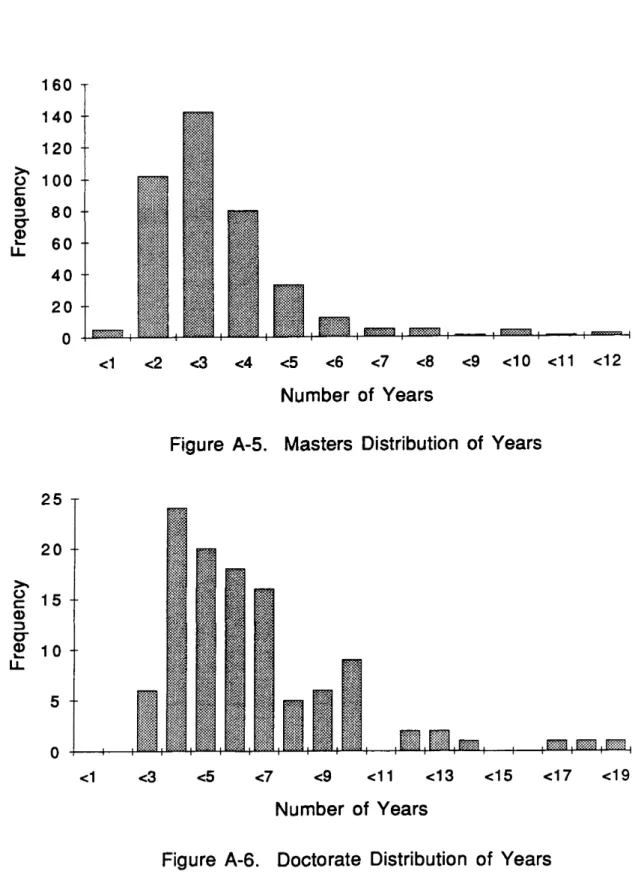
F IG U R E A-5: M a ste rs D istrib u tio n of Y e a rs ...69
F IG U R E A-6: D octorate D istrib u tio n of Y e a rs ... 69
FIG U R E C -l: S im u latio n #1 N e tw o rk ...82
FIG U R E C-2: S im u latio n #2 N e tw o rk ... 84
FIG U R E C-3: S im u latio n #1 C ontrol S ta te m e n ts ...87
F IG U R E C-4: S im u latio n #2 C ontrol S ta te m e n ts ...88
FIG U R E C-5: S am ple S im u latio n O u tp u t... 89
LIST OF TABLES
Page.
TABLE 1: M a s te rs D eg ree C o rre la tio n s ...10
TABLE 2: D octorate D egree C o rrela tio n s...10
TABLE 3: D istrib u tio n s for S im u latio n # 1 ...32
TABLE 4: D istrib u tio n s for S im u latio n #2 - M a s te rs ...33
TABLE 5: D istrib u tio n s for S im u latio n #2 - D o c to ra te ... 34
TABLE 6: S u m m ary of C alcu latio n of N u m b er of R u n s ... 37
TABLE 7: R esu lts of S im u latio n # 1 ... 39
TABLE 8: R esu lts of S im u latio n # 2 ... 40
TABLE A -l: M a ste rs A verages by D e p a rtm e n t...62
TABLE A-2: D octorate A verages by D e p a rtm e n t... 62
TABLE A-3: Professional D egree A verages by C a te g o rie s... 62
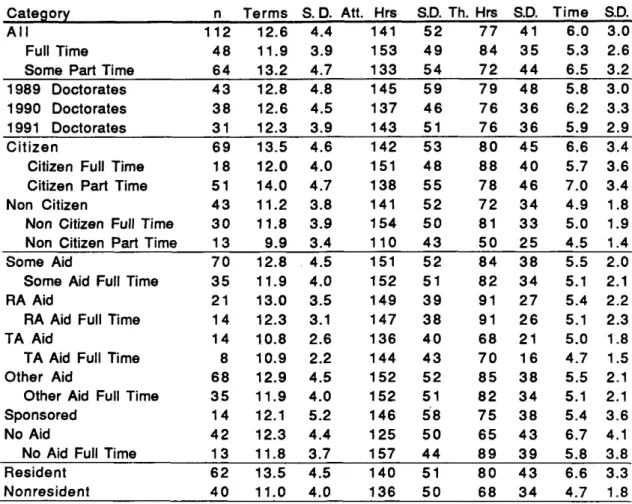
TABLE A-4: M a ste rs A verages by C ateg o ries... 63
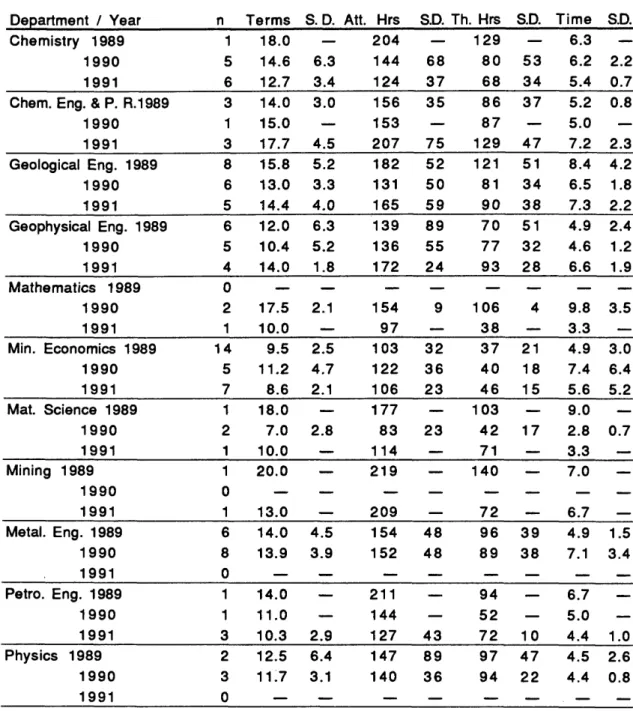
TABLE A-5: M a ste rs A verages by D e p a rtm e n t by Y e a r ... 64
TABLE A-6: D octorate A verages by C a te g o rie s...65
TABLE A-7: D octorate A verages by D e p a rtm e n t by Y e a r ...66
TABLE B -l: R egression E q u a tio n for Ph.D . A ttem p ted H o u rs ... 71
TABLE B-2: M a ste rs - T otal N u m b er of T e rm s... 72
TABLE B-3: M a s te rs - T o tal T im e in Y e a rs... 74
TABLE B-4: M a s te rs - T o tal A tte m p te d H o u rs ... 76
TABLE B-5: D octorate - T otal N u m b er of T e r m s ... 78
TABLE B-6: D octorate - T otal Tim e in Y e a rs...79
TABLE B-7: D octorate - T otal A ttem p ted H o u rs...80
ACKNOW LEDGEM ENTS
The a u th o r w ishes to th a n k th e CSM Office of G ra d u ate S tu d ies for su p p o rtin g th is research . The re a l le a rn in g for a degree ta k e s place beyond th e classroom in a c tu a l “h a n d s on” projects. T he project provided a n
o p p o rtu n ity to help solve a real world problem a n d also a n o p p o rtu n ity to realize th e b rig h t spots a n d p itfalls of a c tu a l problem s.
Two people, D r. R u th M a u re r a n d D r. G ene Woolsey, provided v a lu ab le in sig h ts a n d guidance w ith th e challenges of th is project. Special th a n k s go to D r. M a u re r for all o f h e r assista n ce th ro u g h o u t th is project. The a u th o r also w ishes to acknow ledge th e m an y o th er people asso ciated w ith th is project who provided h elp a n d inform ation.
Also th a n k s to those g ra d u a te stu d e n ts who sh a re d th e m o tiv atio n to go beyond j u s t g e ttin g th e correct a n sw e r an d d esired to know w hy
CHAPTER 1 IN TR O D U C TIO N
T he 1990 -1 9 9 2 CSM B u lletin sta te s th e following regulations:
E ach sem ester, p erso n s w ishing to enroll as p a rt-tim e
stu d e n ts m u st supply th e G ra d u ate School w ith a le tte r from th e ir em ployer or supervisor s ta tin g t h a t th e y w ork a t le a s t 32 h o u rs a week. (CSM B ulletin 1990, 35: 51).
A full-tim e stu d e n t is req u ire d to re g is te r for 15 sem ester h o u rs each sem ester. How ever, i t is n o t recom m ended th a t firs t se m este r stu d e n ts, or stu d e n ts w ith a ssista n ts h ip s , re g iste r for 15 h o u rs of coursew ork. The difference betw een course h o u rs a n d 15 h o u rs is m ad e u p by re g iste rin g for th e sis hours. A p a rt-tim e stu d e n t is req u ired to re g is te r for a
m in im u m of th re e se m este r h o u rs p e r se m e ste r b eg in n in g w ith th e d a te of e n tran ce to th e G ra d u ate School an d
co n tin u in g w ith o u t in te rru p tio n u n til g rad u a tio n . (CSM B ulletin 1990, 35: 52).
In e arly F e b ru a ry of 1991, D r. A rt K idnay, D ean of th e CSM G ra d u ate School req u e ste d help w ith a project: "A lternate en ro llm e n t options are so u g h t w hich w ould allow fairn e ss to all g ra d u a te s tu d e n ts a n d one t h a t w ill n o t h in d e r th e school's economic stability." A com m ittee w as form ed to a d d re ss th is issu e. In considering economics th e n u m b e r o f h o u rs is very im p o rta n t because th e S ta te of Colorado b ases its fu n d in g on th e n u m b e r of h o u rs reg iste red . As a b asis for th e project a lis t of q u estio n s w as g e n erate d a b o u t th e c u rre n t situ atio n . Issu es m en tio n ed in clu d ed how m an y h o u rs a re a c tu a lly com pleted for a degree, how stu d e n ts a re funded, etc. I t w as decided t h a t a stu d y w as needed on th e backgrounds of c u rre n t g ra d u a te s to
g a in back g ro u n d in fo rm atio n on th is issu e. T he stu d y w ould m ea su re a tte m p te d h o u rs, th e sis h o u rs, te rm s, a n d th e calen d a r tim e s tu d e n ts ta k e for a degree. T he n u m b er of a tte m p te d h o u rs is th e n u m b e r of h o u rs
re g iste re d for a t th e beg in n in g of a sem ester; th is is th e n u m b e r upon w hich th e s ta te b ases its funding. T erm s could be e ith e r p a r t tim e or full tim e term s. T he tim e for a degree w ould be m easu red as th e tim e from th e s t a r t of th e first g ra d u a te course to th e end of th e se m este r in w hich th e degree w as aw arded. According to th e G ra d u ate School no such stu d y h a d b e en done; n e ith e r h a d th e Colorado Com m ission on H ig h e r E d u catio n c alcu late d such d a ta .
T he d a ta to perform such a stu d y w ere available on two d ifferen t co m p u ter system s a t CSM. T he project se t out to g a th e r th e d a ta , assem ble th e d a ta in a d a ta b ase for sta tistic s, a n d th e n se t u p a sim u latio n m odel of th e process.
L ittle in fo rm atio n on factors affecting th e tim e ta k e n for a degree h a s b een p u b lish ed a n d m o st stu d ies a re specific to a p a rtic u la r school. One re c e n t stu d y w as found w hich u se s in fo rm atio n from a la rg e n a tio n a l d a ta b a se . M ost of th e stu d ies u se a sta n d a rd reg ressio n e q u atio n to
d e te rm in e sig n ifican t v ariab les for th e tim e ta k e n for a degree. R ealizing th e sh o rta g e of articles, th e following a n n o ta te d bib lio g rap h y co n tain s referen ces of p e rtin e n t articles.
1. T u ck m an , H ow ard, S u sa n Coyle, a n d Y upin B ae. 1990. O n Tim e to th e D octorate. A stu d y of th e In creased Tim e to C om plete D octorates in
Science a n d E n g in e erin g . W ash in g to n D. C.: N a tio n a l A cadem y P re s s .
T his stu d y w as th e m ost com plete a n d m o st re c e n t available. The com pletion tim e to th e doctorate is calculated w ith d a ta from 1967 to 1986, u sin g a n ag g reg ate tim e-series d atab ase. The d a ta u sed w ere from th e D octorate Records File an d th e S urvey of D octoral R ecipients from th e Office of Scientific a n d E n g in eerin g P erso n n el of th e N a tio n al R esearch Council. T he stu d y co n cen trates on five m ain a re a s to o b tain v ariab les for reg ressio n eq u atio n s. T hese a re a s a re fam ily back g ro u n d c h arac teristics, s tu d e n t a ttrib u te s , tu itio n a n d financial aid, in stitu tio n a l e n v iro n m en t a n d policies, a n d m a rk e t forces (Tuckm an, Coyle, a n d B ae 1990, 2). Forty-one v ariab les w ere g e n e ra te d from th e s e areas.
T his stu d y defined th e to ta l tim e to th e doctorate as th e tim e from th e com pletion of th e u n d e rg ra d u a te degree to th e com pletion of th e doctorate. T his tim e is th e n fu rth e r b roken down in to reg iste red tim e to degree, tim e p rio r to g ra d u a te school en try , a n d tim e n o t enrolled in g ra d u a te school. R eg ressio n m odels w ere created for each of th ese four tim e v a ria b le s a n d th e F te s t a n d a d ju ste d R sq u ared w ere u sed to d eterm in e th e level of significance. Zero o rd er correlations w ere also te s te d a t th e 1% a n d 5% levels. A possible problem w ith th is an aly sis is tim e series problem s.
T h is stu d y trie d to find a reaso n for a n in crease in th e to ta l tim e to
com pletion of th e doctorate. Given th e larg e n u m b er o f v ariab les, relativ ely good co rrelatio n s (R sq u a red > 80%) w ere found in some fields. No
co n sisten t factor w as found to explain th e in crease in tim e to th e Ph.D . A stu d y of th is m ag n itu d e shows t h a t th e Ph.D . process is a very
u n co n tro llab le a n d ran d o m process a n d can n o t sy stem atically be explained w ith reg ressio n eq u atio n s.
2. B essen t, E. W ailand, a n d A u th ella M. B essent. 1980. S tu d e n t Flow in a U n iv ersity D ep artm en t: R esu lts of a M arkov A nalysis. In te rfa c e s. 10 (2): 52 - 59.
T his is a n in te re s tin g ap p licatio n of M arkov ch ain s to doctoral
production. T he stu d y w as conducted a t th e D e p a rtm e n t of E d u catio n al A d m in istra tio n a t th e U n iv ersity of Texas a t A ustin. M arkov m odeling w as u se d to d eterm in e th e tim e to degree by m ea su rin g th e tim e sp e n t in
tra n s itio n s ta te s in th e process. T h eir goal w as to p red ict th e n u m b e r of qualified professors needed to supervise d isse rtatio n s. T he sta te s
d e te rm in e d in th e process w ere enrolled, w ith d raw n , ad v an ced to
candidacy, n o t advanced, a n d g rad u a ted . D a ta from 1969 to 1978 w ere used to calcu late th e tra n s itio n m a trix a n d th e associated probabilities. The stu d y did n o t specify th e accuracy of th e predictions a s com pared w ith th e a c tu a l d a ta . I t w as realized t h a t th e b e st w ay to control th e process w as th ro u g h reg u la tio n of adm issions, since i t is possible b u t difficult to control th e s tu d e n ts a lre a d y in th e process. A "brake" can be applied to slow th e stu d e n ts , b u t th e y c an ’t re a lly be accelerated th ro u g h th e process. I t w as found t h a t s tu d e n ts sp e n t a n average of five sem esters before d isse rta tio n
w ork s ta rte d a n d th e n sp e n t a n average of seven sem esters on th e ir d is se rta tio n .
G iven enough d a ta an d n u m b e r cru n ch in g efforts, sim ila r stu d ie s could be conducted a t an y d e p a rtm e n t of an y u n iv ersity . T he stu d e n t's progress is tra c k e d for each sem ester. I t w ould be difficult to conduct such a stu d y b ecause accu rate records a re n eed ed for each te rm a n d d a te of ad m issio n to th e d isse rta tio n for each stu d e n t.
3. Abedi, J a m a l a n d E llen B enkin. 1987. T he Effects of S tu d e n ts' Academic, F in a n cial, a n d D em ographic V ariab les on T im e to th e D octorate.
R esearch in H ig h er E d u catio n . 27 (1): 3 -1 4 .
T his stu d y u sed d a ta from th e D octoral Records File from th e N atio n al R esearch Council ex tracted for UCLA for th e y ears of 1976 to 1985 (4,255 s tu d e n ts w ith com plete d ata). A stepw ise m u ltip le reg ressio n w as u sed to d e te rm in e sig n ifican t v a riab les in d e te rm in in g th e m ea n tim e to degree a n d to ta l reg iste re d tim e. T he v a ria b le s w ere from dem ographic, fin an cial, a n d academ ic categories. T w enty-nine m a in v a ria b le s a n d forty-nine
in te ra c tio n v ariab les w ere identified for use. F ratio s a n d th e ir level of significance w ere u se d to d eterm in e th e e n te rin g v a riab les in th e eq u atio n a n d th e R a n d R sq u a red w ere also m easu red . T he m ost im p o rta n t effect on th e tim e to th e degree w as th e source of support, th e n postdoctoral p lan s, th e n u m b e r of d ep en d en ts, sex, a n d field of study. B u t th e overall eq u atio n s
yielded only a n R sq u ared of 28.7% for th e to ta l tim e to degree, a n d R sq u a red of 16.6% in reg istered tim e to degree.
T hese low levels of R sq u a red h a rd ly seem sig n ifican t for explaining th e v arian ce in th e tim e to degree. M ost of th e v arian ce is left u n ex p lain ed a n d once ag ain p o in ts to th e g re a t ran d o m n ess in th is process. T his stu d y did u se few er v ariab les th a n th e stu d y by T uckm an, Coyle, a n d B ae an d th a t m ay ex p lain th e low er levels of significance.
4. G irves, J e a n E., a n d V irg in ia W em m erus. 1988. D eveloping M odels of G ra d u ate S tu d e n t D egree Process. Jo u rn a l of H ig h e r E d u c a tio n . 59 (2): 163 -189.
T his article is v ery sim ila r to others: a regression eq u atio n is u se d to explain how different v ariab les affect th e tim e to th e doctorate. T his stu d y u sed two stag es of variables: th e first stag e consisted of d e p a rtm e n t
c h a ra c te ristic s, s tu d e n t c h arac teristics, fin an cial su p p o rt, a n d s tu d e n t p ercep tio n s of th e ir re la tio n sh ip s w ith faculty. T he second stag e consisted of g ra d u a te g rad es, invo lv em en t in one's p rogram , sa tisfac tio n w ith
d e p a rtm e n t, a n d alien atio n . T his stu d y did tr y to q u an tify p ercep tio n s of th e d e p a rtm e n t m ore th a n oth ers. T he F te s t w as u sed to te s t for significant differences a t th e 1% a n d 5% levels. A to tal o f 324 M a ste rs an d 162 P h.D .s w ere u se d as d a ta from F a ll of 1977 a t Ohio S ta te U niversity.
The v ariab les accounted for 30% of th e v arian ce in th e tim e to degree for a m a ste rs a n d 29% for th e Ph.D . Once ag ain th is stu d y seem s to explain little of th e to ta l v arian ce in th is process.
5. Bowen, W illiam G., G ra h am Lord, an d Ju lie A n n Sosa. 1991.
M easu rin g tim e to th e D octorate: R e in te rp re ta tio n of th e evidence. Proceedings of th e N ational Academ y of Sciences. 88 (February): 713 - 717.
T his critic cites possible m islead in g d a ta u sed for stu d ies in
d e term in in g tim e to e a rn a doctorate. M ost stu d ies a re organized by th e y e a r in w hich g ra d u a te s received th e ir degrees a n d tra c e th e ir h isto ry backw ards. T his type of an aly sis assu m es t h a t th e po p u latio n h a s been stab le over th e years. Bowen show s t h a t th is h a s in fla te d th e m ea su re of th e m ed ian tim e to degree an d th e in crease in tim e to degree. T he in flatio n is due to th e decline over tim e in th e n u m b er of d octorates produced p e r year. I t is preferab le to group stu d e n ts by th e y e ar t h a t th e y s ta rte d th e ir degree, b u t th is lea d s to th e difficulty of d eterm in in g th e com pletion of th e degree, since some stu d e n ts ta k e lo n g er th a n te n y e ars to com plete th e degree. T rack in g a group of stu d e n ts from s ta r t to fin ish becom es a problem since a v ery larg e period o f tim e w ould be n ecessary to count
everyone t h a t h a s received a degree. Policies an d o th e r factors change over tim e a n d te n y e a r old d a ta describe little ab o u t th e c u rre n t stu d e n t
population. I t is suggested to create a cutoff po in t a t 1 0 ,1 2 , or 16 y e ars for th is process.
As valid a s th is article m ay be, all of th e stu d ies found u se d a ta w ith th e b ack w ard perspective. F o r CSM, such d a ta w ould only be av ailab le on p a p e r records a n d w ould ta k e m an y h u m a n h o u rs to code for co m p u ter use. Also, i t w as d esired to o b tain a m ore c u rre n t profile o f g ra d u a te stu d e n ts .
A reg ressio n w as perform ed on th e CSM Ph.D . d a ta u sin g 15 v ariab les d escrib in g m ajor, residency, full tim e p ercen tag e, sp o n so rsh ip , fin an cial a id te rm s, a n d citizenship. P re d ictin g th e a tte m p te d h o u rs w ith th ese v a riab les yielded a n R sq u ared of only 40.8%, explaining little of th e to ta l v arian ce. T his re su lt, w hich h a s a h ig h e r R sq u a red v alu e th a n two of th e p u b lish ed a rticle s m entioned, illu s tra te s th e ran d o m n ess in th e h o u rs ta k e n for a Ph.D .
T he m eth o d u sed for th re e of th e se stu d ies w as th e reg ressio n eq u atio n tech n iq u e a n d one a rticle u se d M arkov chains. W hile in te re s tin g , th e y a re n o t v ery re le v a n t to th e situ a tio n a t CSM. The goal of th is project w as to d e te rm in e c h arac teristics of p a s t g ra d u a te s , discover i f differences existed b etw een groups, a n d create a sim u latio n m odel of th e process. T he process of e a rn in g a g ra d u a te degree is q u ite ran d o m an d th e ty p e of d a ta
CHA PTER 2 M ETHODOLOGY
2.1 In tro d u ctio n to M ethodology
Once th e n ecessary records of CSM g ra d u a te s w ere g a th e red , th e m eth o d of an aly sis needed to be d eterm in ed . F o r each group of stu d e n ts, th e common sta tistic s of average a n d s ta n d a rd d ev iatio n a re calculated. P ro ced u res m u s t be d eterm in ed to te s t for differences b etw een groups. T h en a sim u la tio n m odel is c reated u sin g d a ta from th e groups. T his c h a p te r will illu s tra te th e sta tistic a l te s ts a n d sim u latio n concepts used.
F o r each group of stu d e n ts th e to ta l n u m b er of term s, to ta l a tte m p te d h o u rs, th e s is h o u rs, a n d tim e ta k e n for a degree w ere m easu red .
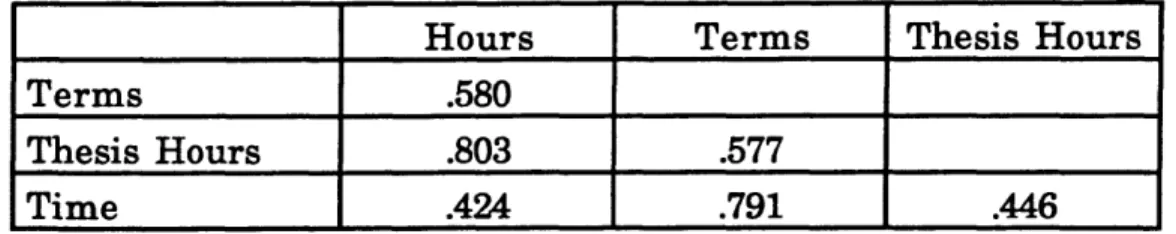
In h e re n tly th e s e four n u m b ers a re re la te d to each other. F o r exam ple, th e n u m b e r of h o u rs ta k e n depends on th e n u m b er of term s. S tatistically , th e re la tio n sh ip betw een two v a riab les is m ea su re d by a co rrelatio n coefficient (F reu n d a n d W alpole 1990, 232 & 474). W hen th e coefficient is zero, th e two v a ria b le s a re in d ep e n d en t of each other; t h a t is, one doesn’t affect th e other. W hen th e coefficient is +1 or —1, th e re is a perfect lin e a r rela tio n sh ip
betw een th e tw o variab les. Given th e hig h correlation coefficients in T ables 1 a n d 2, i f a c h aracteristic, such a s residency, is s u b s ta n tia lly d ifferen t in one of th e a re a s of term s, h o u rs, a n d tim e, i t is likely i t is also su b sta n tia lly d ifferen t in a n o th e r a re a.
T able 1: M a ste rs D egree C o rrelatio n s
H o u rs T e rm s T h esis H o u rs
T e rm s .580
T h esis H o u rs .803 .577
T im e .424 .791 .446
Table 2: D octorate D egree C orrelations
H o u rs T e rm s T h esis H o u rs
T e rm s .790
T h esis H o u rs .906 .756
T im e .360 .565 .272
I t is observed t h a t for bo th degrees th e h ig h est correlation is b etw een to ta l h o u rs a n d th e s is h o u rs.
2.2 S ta tistic s M ethodology
To com pare d ifferen t groups of s tu d e n ts th e d a ta b a se o f s tu d e n t records w as used. C h a rac te ristic s o f a group w ere specified a n d th e av erag e an d s ta n d a rd deviation w ere calculated (Ryan, Jo in er, an d R y an 1985, 186 - 190; F re u n d an d W alpole 1990, 418 - 427).
T he a v erag e or m ea n (p) o f n v a lu e s (Xx, X2, ..., Xn) w as calcu lated by th e eq u atio n
n
Average = X = —
(2.1)
n
T he s ta n d a rd deviation, a m easu re of th e sp read of th e d a ta , w as calculated u sin g th e eq u atio n
T he v a ria n ce , g 2, is th e sq u are of th e sta n d a rd deviation. By C hebyshev's T heorem , given th e m ea n a n d s ta n d a rd deviation for a ran d o m v a ria b le X ,
deviations of th e m ea n (F reu n d an d W alpole 1990,150 - 152). T he average w as th e m a in sta tistic u se d to com pare groups of stu d e n ts. T he th re e y ears o f g ra d u a te s w ere defined to be th e full population for th e statistics.
Once th e av erag es a re calcu lated th e re a re n u m ero u s w ays to d e te rm in e differences b etw een th e groups. O ne m ethod w ould be to calcu late th e sim ple difference of th e averages. F o r exam ple, from T able B-2, c h em istry m ajo rs ta k e 2.79 m ore te rm s th a n all o th e r m a s te rs m ajors. Som e c riterio n could be estab lish ed to denote su b s ta n tia l differences. F or exam ple, i t could be decided th a n a difference g re a te r th a n one te rm could be called su b sta n tia l. T he sim ple differences a re found in th e ta b le s of A ppendix B.
f t / f t
(2.2)
3
S ta tistic a l te s ts w ere u sed as a n o th e r m ethod of estab lish in g
differences. T he sta tistic a l te s ts a re b ased on n o rm al d istrib u tio n theory. T h is th eo ry a ssu m es t h a t e ith e r th e sam ples come from n o rm al
p opulations or t h a t th e y a re larg e enough to ju stify u se of th e p ro p erties of n o rm al populations (F reu n d a n d W alpole 1990, 415). T he d a ta from th e CSM g ra d u a te s do n o t com pletely m ee t th ese conditions. T he th re e y ears of g ra d u a te s hav e b een defined a s th e whole p o pulation a n d th e d istrib u tio n s a re n o t exactly n o rm al (see A ppendix A, F ig u res A -l - A-6.) Also th e groups u se d in th e te sts , for exam ple, re sid e n ts a n d n o n resid en ts a re n o t sam ples of th e population, th ey a re th e population divided in to two groups by
resid en cy type. F u ll d etails of th e sta tistic a l te s ts a re found in A ppendix B. H ence sta tistic a l te s ts w ere u se d to te s t for sig n ifican t differences b u t n o t all a ssu m p tio n s of th e te s ts w ere n ecessarily valid. I t w as decided t h a t sta tistic a l te s ts w ould be a n o th e r m ethod t h a t could be u se d to d ifferen tiate b etw een groups; th is te s t also took in to account th e size a n d v arian ces of th e tw o groups. T h ere is no exact m ethod to d eterm in e w h e th e r tw o groups are d ifferen t since th e m eth o d depends upon th e criterio n estab lish ed .
To te s t for equal m ean s of two in d ep e n d en t p opulations, i t m u s t first be e stab lish ed t h a t th e v arian ces a re equal or n o t equal. To te s t th e
v a ria n ce s, a h y p o th esis H0f is e stab lish ed t h a t th e v a rian ces a re equal. The a lte rn a tiv e , Hn is t h a t th ey are n o t equal. T his is a tw o-sided test.
G iven: th e v a rian ce of a p opulation of size n}
Test: H 0: g ) = g \
H j . Gj * g \
T he v aria n ce of each population is calculated, g e n e ra tin g s] , a n d s\ where
Sj is defined a s th e la rg e r of a n d s2.
A n / v a l u e is com puted u sin g th e ratio
/ =
4
s2 (2.3)
A level of significance of th e te s t, a , is d eterm ined. F o r th is d a ta , a = .02 w as chosen. T he level of significance is th e p ro b ab ility of concluding H0 is false w hen i t is actu ally tru e.
I f
f * f a
(2.4)
w h ere ^ is th e level of significance of th e / d istrib u tio n tab le, a n d n} - 1 an d
n2 - 1 a re th e degrees of freedom , th e n H0 is rejected a n d th e v aria n ce s a re
n o t equal.
I f th e v arian ces a re equal th ey a re pooled in te s tin g th e m ean s. I f th e v aria n ce s a re n o t equal th e n th e v arian ces a re n o t pooled in te s tin g th e m ean s. To te s t th e eq u ality of th e m ea n s w ith eq u al v arian ces a t te s t is used. T he h y p o th eses are:
Test: H0:\ij - f i 2 = 0
H j : i i j - L L 2 * 0
S2 = S]
(n] ^ Sz ^2 ^
p rij + n2- 2
A t v alu e is calcu lated u sin g th e eq u atio n
(2.5) t = (2.6) I f —2 (2.7) w h ere ^ i s th e level of significance of th e t d istrib u tio n tab le, an d n} +n2- 2 is th e degrees of freedom , th e n H0 is rejected an d th e m ea n s a re n o t equal.
I f th e v arian ces a re n o t equal, a z valu e is com puted u sin g th e ratio
a n d th e m ean s a re n o t equal.
A level of significance of th e te s t of th e m ean s is calcu lated in a p v alu e. A la rg e p v alu e su p p o rts H0 s w hile a sm all v alu e of p su p p o rts T he p v a lu e is com pared w ith a n a level, for th is d a ta a = .06 w as used. T he te s t is setu p as follows:
(2.8) I f
a
(2.9)
T est: p > a su p p o rts H0
p < a su p p o rts H1
T he sta tistic s program , M initab, w as u sed to com pute all of th ese te sts. The re s u lts of th ese te s ts a re found in A ppendix B.
U sin g sta tistic a l te s ts th e re a re ch arac teristics w hich cause two or m ore of th e a re a s of term s, tim e, an d h o u rs to be longer or sh o rte r th a n th e re s t. F o r th e M a ste rs degree, ch em istry m ajors a n d chem ical a n d
p etro leu m refin in g en g in eerin g m ajo rs took longer th a n th e re st. T he follow ing g ro u p s - e n v iro n m en ta l science m ajo rs, m a th m ajo rs, m in e ra l econom ics m ajors, full tim e stu d e n ts , E xecutive P ro g ra m s tu d e n ts , an d A rm y officers - took less th a n o th ers in two or m ore of th e a re a s m entioned. F o r doctoral stu d e n ts, those t h a t w ere chem ical a n d p etro leu m refin in g e n g in e erin g m ajo rs, or geological e n g in e erin g m ajo rs, or re s id e n ts, or citizens took longer in a t le a s t two of th e a re a s of term s, tim e, an d hours. M in eral economics m ajo rs took less th a n everyone else in tw o areas. F u r th e r stu d ies could be done to ex p lain w hy th ese groups h a d d ifferen t r e s u lts from th e rest.
2.3 S im u latio n M ethodology
B a n k s & C arso n define sim u latio n a s "the im ita tio n of th e o p eratio n of a re a l w orld process or system over tim e." (B anks a n d C arso n 1984, 2) S im u latio n is becom ing a v ery im p o rta n t tool of o p eratio n s re se a rc h becau se i t is a w ay to m odel rea l w orld system s. A ctual d a ta a re u se d to
b u ild a m odel of a system , th e n item s a re ru n th ro u g h th e m odel u sin g ran d o m n u m b ers to ap p ro x im ate th e ran d o m n ess of th e system .
N u m ero u s ru n s of th e sam e conditions a re done a n d th e overall average gives th e approxim ate o u tp u t of t h a t specific system . C hanges can be m ade to th e system an d th e new o u tp u t com pared to th e old o u tp u t to see how th e changes affect th e o u tp u t.
S im u latio n allows for th e prediction of re s u lts o f a system , even w hen th e system h a s n o t been physically b u ilt. F o r exam ple, how m an y fuel p u m p s should a new gas sta tio n in sta ll to re s u lt in sh o rt w a itin g lines? Also sim u latio n allow s th e u s e r to a lte r a rea l w orld m odel w here i t m ay n o t be p ractical to ex p erim en t w ith th e re a l situ atio n . F o r exam ple,
c h an g in g grocery checkout service to a single lin e from m u ltip le lin es m ay r e s u lt in a lin e t h a t sn ak es th ro u g h h a lf of th e store. A sim ple exam ple w ill illu s tra te sim u latio n step s given by B anks a n d C arso n (1984, 11 - 15). C o n sid er a scenario in w hich cu sto m ers a rriv e a t a service w indow w ith in te ra rriv a l tim es d istrib u te d n o rm ally w ith a n av erag e of 2 m in u te s an d a s ta n d a rd deviation of 1 m in u te. T he service tim es a re d istrib u te d
ex p o n en tially w ith a n average of 1.5 m in u tes. I f th e cu sto m ers hav e to w ait th e y form a single file line a n d once th e custom ers h av e b een serviced th e y leave. T h is situ a tio n will be u sed to exem plify th e step s in a sim u latio n .
P ro b lem F o rm u latio n - T he people d ealin g w ith th e problem a n d th e people an aly zin g th e problem need to agree on a sta te m e n t of th e problem . T he p roblem s ta te m e n t m ay change over tim e though. F o r th e exam ple, th e
ow ner of th e service window w a n ts to find o u t how m an y people a re served p e r ho u r.
S e ttin g of Objectives a n d O verall project p la n - I f sim u latio n is th e correct m eth o d to approach th e problem , a n outline of th e project n eed s to be developed. Q uestions t h a t th e project needs to an sw er should be
form ulated. I t is decided t h a t sim u latio n can be u sed for th e exam ple, b u t th e ow ner also w a n ts to know w h a t h a p p en s i f th e service tim e is
d e c re a se d .
Model B uilding - T he rea l system need s to be stu d ied so t h a t a sim ple m odel of i t can be constructed. More d etail can be added la te r. T h ere a re m an y d ifferen t m odels t h a t could describe one system . T he m odel w ill also help to organize d a ta collection. T he sim ple m odel of th e service window is a
cu sto m er e n te rin g th e system , w a itin g in a lin e if necessary , o b tain in g service, a n d th e n leav in g th e system .
D a ta C ollection - U sin g th e m odel as a guide, d a ta a re collected. T he m odel b u ild in g a n d d a ta collection m ay occur sim ultaneously. I t m ay be realized t h a t som e d a ta a re n o t available a n d th e m odel th erefo re needs
refo rm u latio n , or i t m ay be d esired to refine th e m odel in w hich case m ore d a ta a re necessary. U sually, d a ta collection account for a larg e p a r t of th e tim e n eed ed for th e project. F o r th e exam ple, th e a n a ly st su g g ests t h a t d a ta
should be collected on th e tim e t h a t a custom er arriv es, th e tim e t h a t service s ta rts , a n d th e tim e t h a t th e service is com pleted.
C oding - W ith m an y sim u latio n packages on th e m a rk e t, little a c tu a l coding is necessary . Some packages, su ch as S lam sy stem , u se icons to create a netw ork, m ak in g th e m odel very easy to se t u p in th e program . T he a n a ly st codes th e sim ple m odel of th e service window.
V erification - T he com puter p ro g ram need s to be checked t h a t i t is ru n n in g correctly. O ne needs to check t h a t problem s, su ch as ite m s d isa p p ea rin g from th e system , do n o t occur. The a n a ly st checks th e m odel a n d m ak es su re t h a t custom ers do n o t v a n ish from th e system .
V alid atio n - One needs to com pare th e re a l system to th e m odel to m ake su re t h a t th e m odel re p re se n ts th e re a l system to some d esired degree of accuracy. T h is sta g e m ay req u ire changes in th e m odel a n d m ore
verificatio n a n d v alid atio n . The a n a ly s t ru n s 200 cu sto m ers th ro u g h th e sy stem a n d checks to m ak e su re t h a t th e d istrib u tio n s of th e a c tu a l cu sto m ers do m a tc h th e specified d istrib u tio n s.
E x p erim e n tal D esign - T he m odel m ay be changed to re p re s e n t a d ifferen t v ersio n of th e a c tu a l situ atio n . T h en th e n u m b er of ru n s for each situ a tio n n eed s to be d eterm in ed . T he a n a ly st creates a sim ila r m odel to th e original m odel, b u t th e service tim e is d ecreased to a n average o f one m in u te
ex p o n en tially d istrib u ted . B oth m odels a re ru n a n d th e n u m b e r of ru n s are c alcu lated u sin g sta tistic a l tests.
P ro d u ctio n R u n s an d A nalysis - R im s need to be done a n d th e ir o u tp u t analyzed to te s t th e system . O u tp u t from different situ atio n s can be
com pared. T he a n a ly st th e n com pares th e two d ifferen t m odels to see how th e service tim e affects th e n u m b e r of custom ers served p e r ho u r.
N u m b er o f R uns - I t needs to be decided i f th e accuracy o f th e o u tp u t is good enough. I f th e o u tp u t is n o t accu rate enough, m ore ru n s n eed to be m ade. In c re a sin g th e n u m b er of r u n s will in crease th e accuracy of th e o u tp u t. In th e exam ple th e a n a ly st decides t h a t m ore accuracy is n eed ed because th e ow ner w a n ts a sm aller ran g e of th e o u tp u t resu lt. T he o u tp u t of a
sim u la tio n w ill be a n u m b e r a n d a confidence in te rv a l; th e confidence in te rv a l m ea n s t h a t some specified percen tag e of th e tim e th e a c tu a l re s u lt w ill be in th e confidence in terv al.
D o cu m en t p ro g ram a n d re p o rt re s u lts - T he o p eratio n of th e p ro g ram sh o u ld be docum ented for v ario u s rea so n s such as: o th e r u se rs, fu tu re use, a n d changes in th e program . T he re s u lts for th e d ifferen t situ a tio n s n eed to be docum ented to d eterm in e th e re s u lt of changes in th e m odel. T he a n a ly s t fully docum ents w h a t w as done for fu rth e r use.
Im p le m e n tatio n - D epending on th e success of th e w ork, th e m odel m ay be im plem ented. I t is v ita l th a t th e people who defined th e problem a n d th e problem solvers have com m unicated th ro u g h th e p h a se s of th e project. The ow ners of th e service window m u st decide i f th e y do w a n t to im p lem en t a fa s te r se rv er to in crease th e n u m b e r of custom ers served p e r hour.
The o u tp u t from a sim u latio n will be e stim a te s of v ario u s p a ra m e te rs of th e system . N um erous in d ep e n d en t ru n s of a sim u latio n will give a ran g e of e stim ate s for each p a ra m eter. To o b tain a g en eral id ea of th e ran g e of a p a ra m e te r a confidence in te rv a l is calculated. T he level of accuracy can be specified for th e confidence in te rv al; (1 - a ) is th e
p ro b ab ility t h a t th e a ctu al value of th e p a ra m e te r will be in th e confidence in te rv a l. A typical valu e for a is 0.05. T he n u m b er of u n its of accuracy, e, m u s t also be determ ined. F o r exam ple, i f i t is d esired to find th e average n u m b e r of h o u rs ta k e n by m a ste rs s tu d e n ts p lu s or m in u s one h o u r, th e n e = 1 for th is case. W hen a a n d e a re d eterm in ed th e n u m b er of ru n s
n ecessary to m ee t th ese criterio n can be calculated (B anks a n d C arso n 1984, 427). T he n u m b e r of ru n s to ta l is b ased on a n in itia l sam ple of ru n s. T he follow ing ste p s illu s tra te th e calcu latio n for th e n u m b e r of ru n s.
D e term in in g th e N u m b er o f R uns in a S im u latio n a n d th e Confidence In te rv a l
1. M ake R0, u su a lly betw een five a n d ten , in d ep e n d en t rep licatio n s o f th e sim u la tio n , w h ere X is th e v alu e being sim ulated.
2. Decide on a for th e confidence in te rv al, an d e, th e ± n u m b e r of u n its of a cc u ra c y .
3. C om pute th e sam ple v ariance, w ith X from eq. (2.1)
f j
• R 0 1 ) r=l (2.10)
4. T he in itia l e stim ate for th e n u m b er of ru n s, R , is calcu lated by
c2Sl w h e re c = R> (2.11) -i
is from a cum ulative n o rm al d istrib u tio n (B anks an d C arso n 1984, 494 - 495).
5. Collect R - R 0 m ore rep licatio n s of th e sim ulation.
6. T he confidence in te rv a l for X , given th e p o pulation sta n d a rd deviation S from eq. (2.2), is calcu lated w ith
t a $ x - ^ L t« s — (~.R~n < X < X + -*---(2.12)
w h e re t is th e v alu e from a S tu d en t's-f d istrib u tio n w ith R — l d eg rees
(j.X-l) b
of freedom a n d ^ level of significance (B anks an d C arso n 1984, 496). T he m ethodology explained in th is c h a p te r form ed th e th eo re tic al b a se of know ledge for th e an aly sis u se d in th is project.
CHA PTER 3
SIM ULATION ANALYSIS OF CSM GRADUATE D E G R E E S 3.1 Problem D efinition a n d D a ta G a th erin g
A t th e e arly stag es of th is project a lis t of questions w as created to g e n e ra te a s ta rtin g p o in t for th e w ork. Included in th is lis t w ere such q u estio n s as:
1. How m an y h o u rs does th e typical m a ste rs or Ph.D . stu d e n t com plete for a degree?
2. How m an y e x tra class h o u rs a re ta k e n beyond th e req u irem en ts? 3. Is th e re a relatio n sh ip b etw een th e n u m b er of h o u rs com pleted for
a degree an d th e type of su p p o rt th e stu d e n t receives?
L ittle in fo rm atio n w as know n ab o u t th e answ ers to th ese questions. H ence i t w as decided t h a t in form ation w as needed ab o u t re c e n t g ra d u a te s to a n sw e r th e se ty p es of questions. T his d a ta w ould th e n show i f th e re w ere sig n ifican t differences b etw een groups of stu d e n ts. T h en th e d a ta could be u se d to c re ate a sim u latio n m odel o f g ra d u a te s tu d e n ts going th ro u g h CSM.
T he 3 y ears of M a ste r of Science, Professional, a n d D octorate degrees g ra n te d by CSM b etw een F all 1988 a n d S p rin g 1991 w ere chosen a s th e b ack g ro u n d d a ta . Records from 392 M a ste rs degrees, 112 D octorate degrees, a n d 18 P ro fessio n al degrees w ere used. D u rin g th is tim e th e p u b lish ed re q u ire m e n ts rem a in e d fairly co n stan t. Also, each s tu d e n t w ould h av e a record in th e d etailed S tu d e n t In fo rm atio n S ystem (SIS.) D a ta from th e F all 1988 to S p rin g 1991 w ere ex tracted from th e SIS. T his in fo rm atio n contains
specific in fo rm atio n such as n u m b e r of fin an cial aid te rm s, citizenship, residency, sponsorship, etc. M r. J im A llen, of In fo rm atio n Services a t CSM, produced all of th e ex tracted d a ta files from th e SIS. D a ta before th e d a te of F all 1988 w ere ex tracted from ta p e s off th e old W ang system an d co n tain only class a n d th e sis h o u rs, an d type an d n u m b e r o f term s. The d a ta u sed contain only th e stu d e n ts t h a t received a degree in th e given tim e fram e. In fo rm atio n on th e n u m b er of stu d e n ts t h a t s ta rte d g ra d u a te
stu d ies b u t did n o t finish w as not available. T his is due to th e problem th a t som e stu d e n ts ta k e a long period of tim e, some lo n g er th a n 10 y e ars to fin ish a degree.
T hese tw o sources of d a ta w ere compiled in to a larg e Excel d atab ase. T he h o u rs a n d te rm s w ere added to g eth er for th e two d ifferen t sources. Som e files co n tain ed m issin g in fo rm atio n ; w hen possible th is w as corrected w ith in fo rm atio n from tra n s c rip ts a n d g ra d u a tio n
a n n o u n ce m e n ts from th e R e g istra r's Office. W om en who h a d m a rrie d d u rin g th e ir g ra d u a te c aree r w ere som etim es lis te d u n d e r tw o d ifferen t n a m e s in th e system s; th is w as corrected. T he few s tu d e n ts who h a d
received b o th a m a ste rs a n d a Ph.D . in th e 3 y e ar tim e sp a n w ere e n te red as a Ph.D . s tu d e n t in th e d atab ase. T he s ta r t of a degree w as defined as th e se m este r of th e first g ra d u a te course ta k e n a t CSM. T he en d of a degree w as defined as th e se m este r o f g rad u atio n . T he d a ta w ere counted th is w ay to achieve a perspective on th e le n g th of tim e ta k e n for a degree. T ra n sfe r courses could n o t be counted to w ard s th e to ta l h o u rs a n d deficiency courses w ere counted to w ard s th e to ta l h o u rs. D octoral stu d e n ts m ay or m ay n o t
h av e h a d a M a ste rs degree upon e n te rin g a Ph.D . p ro g ram a t CSM. T here a re probably some inaccuracies in th e d a ta , b u t th is w as deem ed to be th e b e st d a ta available a n d th e y w ere in a usable form for an aly sis.
T he in fo rm atio n of each s tu d e n t co n tain s a n y g ra d u a te courses ta k e n u p to a n d in cluding th e sem ester in w hich th e degree w as obtained. T he d a ta b a se in clu d es th e following in fo rm atio n for each stu d e n t.
M ajor D e p a rtm e n t D egree
D ate of D egree
L en g th of C a le n d ar Tim e for D egree (based on d a te of first g ra d u a te course to th e d a te of th e g ra d u a tio n for th e degree)
I f M asters: le ft w ith degree or continued for a Ph.D . E xecutive P ro g ra m
A rm y O fficer N on T hesis D egree
R e sid en t S ta tu s (based on s ta tu s d u rin g g rad u a tio n sem ester) F u ll T im e T erm s
P a r t T im e T erm s
F u ll Tim e % (P ercentage of te rm s t h a t w ere full tim e) T otal N u m b er of T erm s
T o tal A ttem p ted H o u rs T o tal T h esis H o u rs S po n so rsh ip S ta tu s
F in a n cial Aid T erm s (T erm s in th e SIS d u rin g w hich F. A. obtained) RA (received an y re se a rc h a s s is ta n t aid)
TA (received a n y tea ch in g a s s is ta n t aid)
O th e r (received an y o th e r aid - lo an s or g ran ts) C itizenship S ta tu s
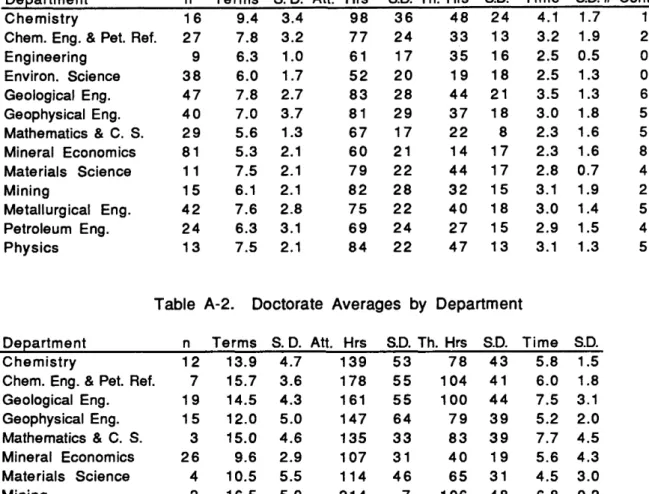
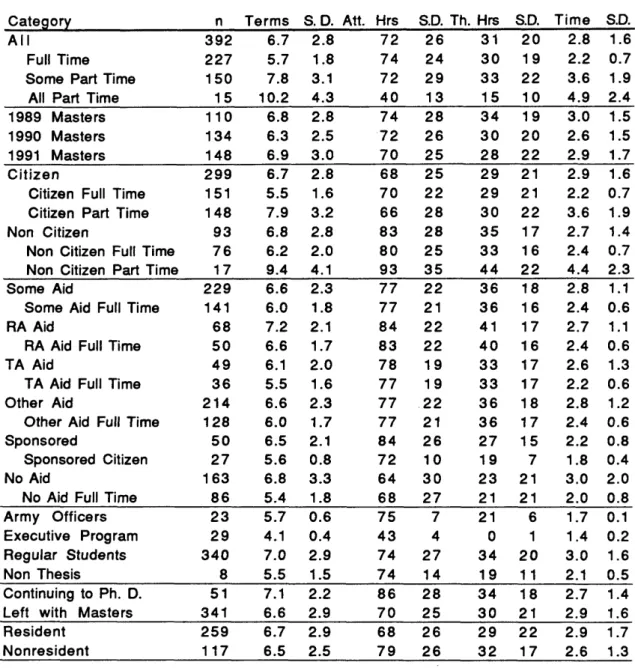
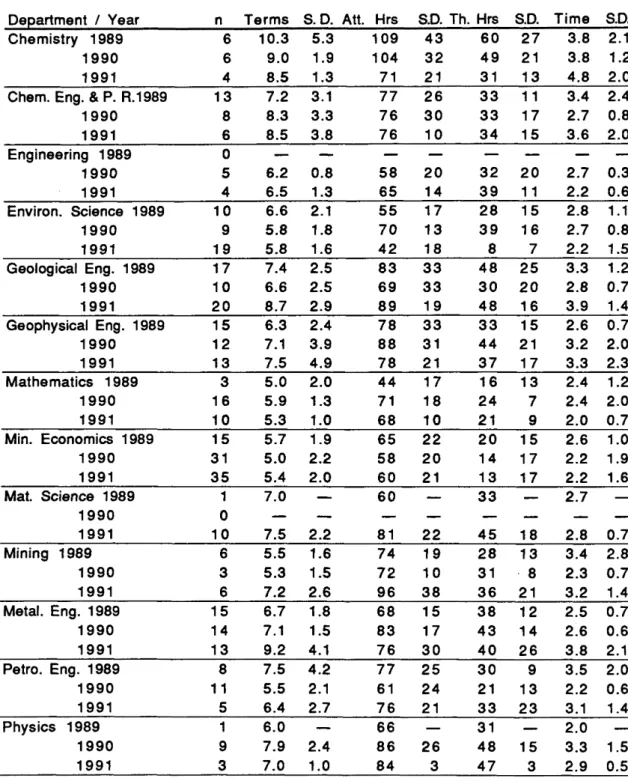
U sing th is d a ta b ase, av erag es a n d sta n d a rd dev iatio n s w ere obtained on th e n u m b er of term s, tim e, a tte m p te d h o u rs, a n d th e sis h o u rs for a degree. T hese av erag es w ere b ro k en down for a n u m b e r of differen t
c h a ra c te ristic s, such as citizens receiving fin an cial aid, d e p a rtm e n ts, etc. F ig u re s illu s tra te th e differences betw een groups. T hese d a ta w ere
p re se n te d to th e CSM G ra d u ate Council on O ctober 2 ,1 9 9 1 . (See A ppendix A for ta b le s a n d figures).
3.2 S im u latio n
F o r m ore d etailed sta tistic s, th e d a ta w ere n u m erically coded for use in M initab. F o r exam ple, i f a s tu d e n t w as a resid en t, a one w as assig n ed to t h a t cell, i f th e stu d e n t w as n o t a resid en t, a zero w as assigned.
C alcu latio n s w ere done th a t com pared one p a rtic u la r group o f s tu d e n ts to everyone else to see if t h a t p a rtic u la r group differed from th e rest. F o r exam ple, how long did i t ta k e ch em istry m ajors to g et a M a ste rs as
com pared to everyone else? C h em istry m ajors took 9.38 te rm s a s com pared to a ll o th e r m ajors w hich took 6.59 term s. U sin g th e sim ple difference of th e m ea n s, ch em istry m ajors took 2.79 m ore te rm s th a n all o th e r m ajors.
(See A ppendix B for d ata). I t ap p ea re d t h a t some ch arac teristics h a d la rg e r affects on one or m ore of th e 3 a re a s te s te d (num ber of te rm s, tim e, a n d a tte m p te d hours).
T he following calculations for th e m a s te rs ch em istry m ajo rs will illu s tra te th e sta tistic a l te s tin g process.
In itia l S ta tistic s
C h e m istry m ajo rs n = 16 A verage te rm s = 9.38 S ta n d a rd deviation = 3.40. All o th e r m ajo rs n = 376 A verage te rm s = 6.49 S ta n d a rd deviation = 2.69.
Test o f variances: H0: (3.40)2 = (2.69)2
HI:(3.40)2 * (2.69)2
U sin g eq. (2.3)
(2.69)
F ro m tab les f (MJ5J75) = 2.09
U sin g eq. (2.4) / = 1.60 <2.09 , th erefo re th e v arian ces can be considered to be sta tistic a lly equal.
U sin g th e pooled m ean s t e s t :
Test o f means: H0:9.38 - 6.59 = 0
H1: 9 .3 8 - 6 .5 9 * 0
U sin g eq. (2.5)
, _ (3.40)215 + (2.69f375
U sin g eq. (2.6)
9-3» ~ 6-59 =4.02 Z 7 2 \ l 6 + ~376
U sin g eq. (2.7), t = 4.02> ti025 390) = 1.96, a n d H0 is rejected; th e m ean s a re not sta tistic a lly equal.
T he F te s t colum n on T ables B2 - B7 h a s a * if th e v arian ces w ere n o t eq u al a n d hence n o t pooled in th e m ean s te st. The p v alu e colum n h a s a * if th e th e m ea n s w ere sta tistic a lly different, a n d th e sta tistic a l difference colum n h a s a > or < to illu s tra te th e direction of th e sta tistic a l difference.
A fter a discussion w ith D r. K idnay ab o u t possible sim u la tio n m odels i t w as decided to sim u late th e n u m b e r o f h o u rs w ith re g a rd to fu ll/p a rt tim e s ta tu s a n d support. Two d ifferen t sim u latio n s w ere designed. One
sim u la tio n m odels s tu d e n ts th ro u g h th e sy stem b a sed on degree a n d fu ll/p a rt tim e sta tu s . T he o th e r sim u latio n m odels s tu d e n ts th ro u g h th e sy stem b a se d on degree, w h e th e r or n o t supported, a n d fu ll/p a rt tim e s ta tu s . S u p p o rt could be from sponsorship, re se a rc h a s s is ta n t aid, or te a c h in g a s s is ta n t aid.
F ro m th e d a ta th e p ercen tag es on each of th e p a th s of th e sim u latio n w ere calculated. T h en u sin g M in itab th e d istrib u tio n of h o u rs for each d esired group w as calculated. I t w as decided to group th e h o u rs in u n its of n in e, th is is th e la rg e s t n u m b e r of h o u rs t h a t can be ta k e n a s a p a r t tim e s tu d e n t. G iven th e d istrib u tio n , th e cum ulative p ro b ab ility d istrib u tio n w as
calculated (F reu n d an d W alpole 1990, 82 - 83). The m id p o in t of each group of h o u rs w as u sed in th e sim ulation.
F ig u res 1 a n d 2 illu s tra te th e m odels of th e sim u latio n s. In th e sim u la tio n th e re a re p o in ts w here a choice m u s t be m ad e re g a rd in g w hich p a th to tak e; ran d o m n u m b ers a re u sed to m ake th is choice. F o r each 100 s ta rtin g stu d e n ts th ere will be 78 M asters an d 22 Ph.D .s. F o r exam ple, to choose w hich degree th e ran d o m n u m b ers w ould be assig n ed a s follows:
i f random n u m b er equals 0 to .78 go to M asters p a th i f random n u m b er eq u als .79 to 1 go to Ph.D . p a th
The execution of sim u latio n #2 u sin g th e ran d o m n u m b ers (.74, .32, .35, .87) w ould be as follows.
1. M asters or Ph.D .? - since .74 < .78 go to M a ste rs p a th
2. E xecutive or re g u la r program ? - since .32 > .07 go to re g u la r p ro g ram p a th
3. Supported? - since .35 < .38 go to supported p a th
4. T h en u sin g th e m a ste rs su p p o rted d istrib u tio n from T able 4, th e ran d o m n u m b er .87 falls betw een .862 a n d .899, hence th e n u m b er of h o u rs is 112.5.
O ne o b serv atio n h a s b een g en erated ; a m a s te rs re g u la r p ro g ram su p p o rted s tu d e n t who took 112.5 hours.
To illu s tra te a s tu d e n t b ein g sim u lated th ro u g h F ig u re 1, th e decision m u s t firs t be m ade w h e th e r a M a ste rs or Ph.D . w ill be p u rsu ed ; th is is decided by th e firs t ran d o m n u m b er. I f a M a ste rs is p u rsu e d , th e n e x t choice will be to enroll in th e E xecutive P ro g ram or not. I f a stu d e n t
p u rsu e s a re g u la r m aste rs, th e n i t m u st be decided w h e th e r to be a p a r t tim e or a full tim e stu d e n t. I f a Ph.D . is p u rsu e d only th e decision w h e th e r to be p a r t tim e or full tim e m u st be m ade. T h en a t th e end o f each p a th th e stu d e n t receives a n a ssig n m en t of th e h o u rs ta k e n for th e degree. F ig u re 2 h a s sim ila r p a th s, b u t i t also ta k e s in to account if a stu d e n t is su p p o rted or not. T he p ercen tag es for th e sim u latio n s w ere calcu lated from th e a ctu al d a ta . T hese p ercen tag es do n o t n ecessarily re p re s e n t th e p ercen tag es of incom ing gro u p s o f stu d e n ts.
■O o in O in Q O Q -u _ Cl Ll_ Cl c l CL CO CO z in TO in Q O Q CL Cl O ' m ow CL CL CL CL CO in to in < _ X 04 CO CL O'04 Q CL l_) o> <1> cr o> x O ' ro in CD Z K> O' in in CD CD CD "O *-» Q 04 CL 04 F ig u re 2. S im u latio n of S u p p o rt a n d H o u rs
T able 3. D istrib u tio n s for S im u latio n #1
Hour Master PT Master FT Doctor PT Doctor FT
Ranqe Midpoint # CDF # CDF # CDF # CDF [ 0 , 9 ) 4.5 [ 9 , 1 8 ) 13.5 1 .006 [ 1 8 , 2 7 ) 22.5 5 .037 [ 2 7 , 3 6 ) 31.5 13 .117 [ 3 6 , 4 5 ) 40.5 15 .209 2 .010 1 .016 [ 4 5 , 5 4 ) 49.5 16 .307 4 .030 2 .047 [ 5 4 , 6 3 ) 58.5 21 .436 12 .090 [ 6 3 , 7 2 ) 67.5 20 .558 21 .195 1 .021 [ 7 2 , 8 1 ) 76.5 21 .687 48 .435 9 .188 [ 8 1 , 9 0 ) 85.5 23 .828 32 .595 5 .266 2 .063 [ 9 0 , 9 9 ) 94.5 7 .871 33 .760 4 .328 2 .104 [ 9 9 , 1 0 8 ) 1 0 3 . 5 6 .908 19 .855 4 .391 2 .146 [ 1 0 8 , 1 1 7 ) 1 1 2 . 5 2 .920 8 .895 5 .469 3 .208 [1 1 7 , 1 2 6 ) 1 2 1 . 5 6 .957 8 .935 3 .516 4 .292 [ 1 2 6 , 1 3 5 ) 1 3 0 . 5 1 .963 7 .970 3 .563 6 .417 [ 1 3 5 , 1 4 4 ) 1 3 9 . 5 1 .969 3 .985 3 .609 5 .521 [ 1 4 4 , 1 5 3 ) 1 4 8 . 5 2 .982 4 .672 4 .604 [ 1 5 3 , 1 6 2 ) 1 5 7 . 5 2 .994 1 .990 2 .703 [ 1 6 2 , 1 7 1 ) 1 6 6 . 5 1 .995 1 .719 4 .688 [ 171 , 1 8 0 ) 1 7 5 . 5 1 1 . 000 1 1 . 000 2 .750 3 .750 [ 1 8 0 , 1 8 9 ) 1 8 4 . 5 6 .844 1 .771 [ 1 8 9 , 1 9 8 ) 1 9 3 . 5 1 .792 [1 9 8 , 2 0 7 ) 2 0 2 . 5 4 .906 2 .833 [ 2 0 7 , 2 1 6 ) 2 1 1 . 5 1 .922 3 .896 [ 2 1 6 , 2 2 5 ) 2 2 0 . 5 2 .953 1 .917 [ 2 2 5 , 2 3 4 ) 2 2 9 . 5 1 .969 [ 2 3 4 , 2 4 3 ) 2 3 8 . 5 1 .938 [ 2 4 3 , 2 5 2 ) 2 4 7 . 5 2 .979 [ 2 5 2 , 2 6 1 ) 2 5 6 . 5 1 .984 [ 261 , 2 7 0 ) 2 6 5 . 5 1 1 . 00 0 [ 2 7 0 , 2 7 9 ) 2 7 4 . 5 [ 2 7 9 , 2 8 8 ) 2 8 3 . 5 [ 2 8 8 , 2 9 7 ) 2 9 2 . 5 [ 2 9 7 , 3 0 6 ) 3 0 1 . 5 1 1 . 000 Total 1 63 2 0 0 6 4 4 8
T able 4. D istrib u tio n s for S im u latio n #2 - M a ste rs
Master Master No Supp. Master No Supp.
Hour Supported Full Time Part Time
Ranae Midpoint # CDF # CDF # CDF [ 0 , 9 ) 4.5 [ 9 , 1 8 ) 13.5 1 .008 [ 1 8 , 2 7 ) 22.5 5 .045 [ 2 7 , 3 6 ) 31.5 2 .022 13 .143 [ 3 6 , 4 5 ) 40.5 2 .014 2 .043 15 .256 [ 4 5 , 5 4 ) 49.5 5 .051 9 .141 14 .361 [ 5 4 , 6 3 ) 58.5 10 .123 1 3 .283 19 .504 [ 6 3 , 7 2 ) 67.5 26 .312 2 5 .554 17 .632 [ 7 2 , 8 1 ) 76.5 29 .522 1 1 .674 13 .729 [ 8 1 , 9 0 ) 85.5 29 .732 1 0 .783 17 .857 [ 9 0 , 9 9 ) 94.5 10 .804 1 0 .891 6 .902 [ 9 9 , 1 0 8 ) 1 0 3 . 5 8 .862 2 .913 4 .932 [ 1 0 8 , 1 1 7 ) 1 1 2. 5 5 .899 3 .946 2 .947 [ 1 1 7 , 1 2 6 ) 1 2 1 . 5 7 .949 4 .989 2 .962 [ 1 2 6 , 1 3 5 ) 1 3 0 . 5 4 .978 [ 1 3 5 , 1 4 4 ) 1 3 9 . 5 1 .970 [ 1 4 4 , 1 5 3 ) 1 4 8 . 5 1 .986 1 1 . 0 0 0 1 .977 [ 1 5 3 , 1 6 2 ) 1 5 7 . 5 1 .993 2 .992 [ 1 6 2 , 1 7 1 ) 1 6 6 . 5 1 1 . 0 0 0 r 1 71 , 1 8 0 ) 1 7 5 . 5 1 1 . 0 0 0 Total 1 3 8 9 2 1 3 3
T able 5. D istrib u tio n s for S im u latio n #2 - D octors
Doctor Supported Doctor No Supp. Doctor No Supp.
Hour Full Time Part Time
Range Midpoint # CDF # CDF # CDF [ 0 , 9 ) 4.5 [ 9 , 1 8 ) 13.5 [ 1 8 , 2 7 ) 22.5 [ 2 7 , 3 6 ) 31.5 .021 [ 3 6 , 4 5 ) 40.5 1 [ 4 5 , 5 4 ) 49.5 2 .063 [ 5 4 , 6 3 ) 58.5 [ 6 3 , 7 2 ) 67.5 1 .05 [ 7 2 , 8 1 ) 76.5 1 .023 8 .229 [ 8 1 , 9 0 ) 85.5 3 .091 4 .313 [ 9 0 , 9 9 ) 94.5 1 .114 2 .15 3 .375 [ 9 9 , 1 0 8 ) 1 0 3 . 5 2 .159 2 .25 2 .417 [ 1 0 8 , 1 1 7 ) 1 1 2 . 5 5 .273 3 .479 [ 1 1 7 , 1 2 6 ) 1 2 1 . 5 4 .364 1 .30 2 .521 [ 1 2 6 , 1 3 5 ) 1 3 0 . 5 6 .500 2 .40 1 .542 [ 1 3 5 , 1 4 4 ) 1 3 9 . 5 3 .568 2 .50 3 .604 [ 1 4 4 , 1 5 3 ) 1 4 8 . 5 2 .614 3 .65 3 .667 [ 1 5 3 , 1 6 2 ) 1 5 7 . 5 1 .636 1 .688 [ 1 6 2 , 1 7 1 ) 1 6 6 . 5 2 .682 2 .75 1 .708 [ 1 7 1 , 1 8 0 ) 1 7 5 . 5 3 .750 2 .750 [ 1 8 0 , 1 8 9 ) 1 8 4 . 5 4 .841 3 .813 [ 1 8 9 , 1 9 8 ) 1 9 3 . 5 1 .864 [ 1 9 8 , 2 0 7 ) 2 0 2 . 5 2 .909 4 .896 [ 2 0 7 , 2 1 6 ) 2 1 1 . 5 2 .954 2 .85 [ 2 1 6 , 2 2 5 ) 2 2 0 . 5 1 .90 2 .938 [ 2 2 5 , 2 3 4 ) 2 2 9 . 5 1 .958 [ 2 3 4 , 2 4 3 ) 2 3 8 . 5 1 .95 [ 2 4 3 , 2 5 2 ) 2 4 7 . 5 1 .977 1 1. 0 0 [ 2 5 2 , 2 6 1 ) 2 5 6 . 5 1 .979 [ 2 6 1 , 2 7 0 ) 2 6 5 . 5 1 1 . 0 0 0 [ 2 7 0 , 2 7 9 ) 2 7 4 . 5 [ 2 7 9 , 2 8 8 ) 2 8 3 . 5 [ 2 8 8 , 2 9 7 ) 2 9 2 . 5 [ 2 9 7 . 3 0 6 ) 3 0 1 . 5 1 1 . 0 0 0 Total 4 4 2 0 4 8
The cum ulative probability d istrib u tio n s a n d m idpoints w ere u sed as th e d istrib u tio n s in th e sim u latio n s u sin g S lam system . T he sim u latio n p ro g ram g e n e ra te s observations from th e d istrib u tio n s. A ran d o m n u m b e r b etw een zero an d one is g en erated , th e n e x t la rg e s t cum ulative d istrib u tio n v alu e is found a n d th e corresponding m id p o in t is u se d as th e observation. As a n exam ple u sin g th e m a s te r p a r t tim e d istrib u tio n from T able 3, th e ran d o m n u m b er .102 falls betw een .037 an d .117, so th e v alu e o f th e
observ atio n w ould be 31.5 h ours. In th e sim u latio n , "students" a re c reated a n d "run" th ro u g h th e system of probabilistic b ra n c h e s a n d d istrib u tio n s for h o u rs. T he stu d e n ts w ere b atch ed in to groups of 78 m a s te rs an d 22 d octorates to collect a n average for t h a t group; th e n u m b e r in each group re p re se n ts th e a c tu a l p ercen tag e break d o w n of degree types. T h en i t m u st be d e te rm in e d how m an y ru n s should be perform ed.
A sam ple ru n of te n rep licatio n s w as done of sim u latio n #1. F o r th e M a ste rs degree th e to ta l n u m b e r of ru n s n ecessary w ere calcu lated as follows. G iven R0 = 10. U sin g eq. (2.1) ^ _ (67.2 + 77.1 + 70.5 + 75.5 + 69.9 + 69 + 73.4 + 75.8 + 70.8 + 76.6) A ---—--- — 72.58 10 U sin g eq. (2.10)
sHrab)!<
*'_72-5S)’
U sin g a = .05
s ; = 12.51 2 a ~ z .05_ — Z.025
2 2
F ro m sta tistic a l tab les
C = [0 (1 -0 2 5 )]'' = [<S>(.975)]~‘ = 1.96
A nd u sin g eq. (2.11)
l 2
H ence R > 49 will give th e d esired level of accuracy for th e m a s te rs stu d e n ts .
T able 6. S um m ary of C alcu latio n of N u m b er of R uns I te m M a ste r D octorate a = level of significance .05 .05 e = accuracy 1 2 R im 1 67.2 127 R im 2 77.1 158 R u n 3 70.5 150 R u n 4 75.5 150 R u n 5 69.9 143 R u n 6 69.0 169 R u n 7 73.4 152 R u n 8 75.8 147 R u n 9 70.8 136 R u n 10 76.6 141 X 72.6 147.3 °0 12.5 135.6 R > 49 130
So a t le a s t 130 ru n s w ere n ecessary to satisfy th e level of significance an d accuracy for bo th th e M a ste rs a n d D octorates. A r u n consists of a group of 78 M a ste rs an d a group of 22 Ph.D .s. E ach sim u latio n rep licatio n contains ap p ro x im ately 7 rim s.
The sim u latio n s w ere r u n for 20 replications, g e n e ra tin g a to ta l of ap p roxim ately 132 m a ste rs a n d 127 Ph.D . for each case. T he o u tp u t of th e sim u la tio n gives th e average a n d s ta n d a rd deviation for all of th e m a ste rs groups a n d Ph.D . groups. T h en a confidence in te rv a l is calcu lated u sin g eq. (2.12) w ith a = .05, th is m ean s t h a t 95% of th e tim e th e actu al average w ill be in th e confidence in te rv a l. V ariatio n s from th e in itia l sim u latio n w ere done a s follows:
1. D ecrease p a r t tim e h o u rs by 10% 2. D ecrease p a r t tim e h o u rs by 20%
3. In crease th e percen tag e to E xecutive P ro g ram to 10% 4. D rop percen tag e of m a s te rs full tim e to 50% (from 55%) 5. Drop percentage of Ph.D . full tim e to 38% (from 43%)
T able 7. R esu lts of S im u latio n #1
Case Mas. Av q. SD Mas. Conf. Int. Ph.D. Av q SD Ph.D. Conf. Int.
Basecase 69.0 ± 21.7 F65.3, 72.71 132 ± 42.6 F124.5. 139.51 1 66.1 ± 21.7 F62.4, 69.81 126 ± 42.0 F118.6, 133.41 2 63.0 ± 21.4 r59.3, 66.71 118 ± 42.6 F110.5, 125.51 3 68.4 ± 22.3 F64.6. 72.21 133 ± 43.5 F125.4. 140.61 4 68.1 ± 21.7 F64.4. 71.81 136 ± 44.0 ri28.3. 143.71 5 68.5 ± 21.7 F64.8, 72.21 133 ± 44.1 F125.3. 140.71
V a ria tio n s from S im u latio n #2 w ere done as follows: 1. D ecrease non-suppported p a r t tim e h o u rs by 20% 2. D ecrease n on-suppported full tim e h o u rs by 20%
3. D ecrease n o n -su p p o rted p a r t tim e h o u rs by 20% an d decrease n o n su p p o rted full tim e h o u rs by 15%
4. All h o u rs drop by 10% except E xecutive P ro g ram h o u rs 5. In crease th e percen tag e to E xecutive P ro g ram to 10% 6. In crease th e percen tag e to E xecutive P ro g ra m to 15%
T able 8. R esu lts of S im u latio n #2
Case Mas. Avq. SD Mas. Conf. Int. Ph.D. Av q SD Ph.D. Conf. Int.
Basecase 68.4 ± 21.3 [64.7f 72.11 134 ± 44.5 [126.3, 141.71 1 63.9 ± 21.7 160.1. 67.71 122 ± 43.1 [114.5, 129.51 2 64.6 ± 20.6 [61.0, 68.21 129 ± 42.8 [121.6, 136.41 3 58.8 ± 20.6 T55.2. 62.41 114 ± 41.5 [106.8, 121.21 4 62.1 ± 18.7 [58.9, 65.31 120 ± 40.6 [112.9, 127.11 5 67.6 ± 21.7 [63.8, 71.41 136 ± 45.1 [128.2, 143.81 6 65.2 ± 20.8 161.6. 68.81 135 ± 45.5 [127.2, 142.81
T he re s u lts o f th e confidence in te rv a ls a re th e n g rap h e d to show th e rela tio n sh ip s betw een th e in te rv als. The an aly sis process of CSM g ra d u a te s h a s ta k e n th e original d a ta a n d com puted sta tistic s for
CHA PTER 4
RESULTS/CONCLUSIONS
T he d a ta g a th e red for th is project gives a very d etailed h isto ry of 3 y ears of g ra d u a te degrees g ra n te d a t CSM. Before th is project, sta tistic s such as th e n u m b e r of h o u rs th e average m a s te rs can d id ate com pletes w ere only guesses. T he d a ta p re se n te d h e re a re b ro k en dow n in to m an y categories su ch as d e p a rtm e n t, y ear, residency, etc. T he re s u lts o f th e d a ta h av e su rp rise d m an y people. No one h a d th o u g h t t h a t th e av erag e m a ste rs ta k e s 72 hours. These d a ta also show th a t th e re s u lts from y e a r to y e a r are q u ite consistent.
T h ere a re th re e differen t ty p es of m a s te rs p ro g ram s, E xecutive P ro g ram , m ilita ry officers p ro g ram , a n d th e re g u la r p ro g ram . T he E xecutive P ro g ra m stu d e n ts in th is stu d y w ere enrolled th ro u g h th e
M in eral Econom ics D e p a rtm e n t in a 42 h o u r, fo u r te rm , n o n th esis m a ste rs degree p ro g ram . T he p ro g ram is aim ed a t w orking pro fessio n als who w ish to fu rth e r th e ir education. T he courses a re ta u g h t one d ay a w eek. T h ere is a fla t tu itio n fee charged for th is program ; re sid e n ts a n d n o n resid en ts p ay th e sam e am o u n t. In F a ll 1991 th e E n v iro n m en tal Sciences D e p a rtm e n t ad d ed a n E xecutive P rogram .
T he second special p ro g ram is th e m ilita ry officer p ro g ram . U. S. A rm y officers hav e been se n t on a two y e a r a ssig n m en t to CSM to e a rn a m a s te rs degree in o p eratio n s re se a rc h e ith e r th ro u g h th e M a th em atics or M in eral Econom ics D e p artm en ts. T he officers ta k e from fo u r to six te rm s
a n d a re req u ire d to reg is te r as full tim e stu d e n ts. T he officers m u s t fin ish th e ir degree in th e given tim e period. S tu d e n ts n o t in e ith e r of th e two above m en tio n ed p ro g ram s a re in th e re g u la r program . T h a t is, th e y a re n o t in a n y p ro g ram w ith fixed tim e lim its to o b tain th e ir degree. T he E xecutive P ro g ra m a n d th e m ilita ry officer p ro g ram h a d significantly d ifferen t r e s u lts for term s, tim e, a n d h o u rs from th e re g u la r program .
4.1 C om m ents on th e D atab ase R esu lts
D istrib u tio n s for term s, h o u rs, a n d tim e a re q u ite w idely sp re ad out w ith a n u m b er of stu d e n ts a t th e h ig h ends of th e d istrib u tio n s. A verages also v a ry q u ite a b it by d e p artm e n t. F o r th e m aste rs, m in e ra l economics m ajo rs, m a th e m a tic s m ajo rs, a n d en v iro n m en ta l science m ajo rs a re on th e low side of each of th e a re a s, w hile ch em istry is th e h ig h e st in each of th e a re a s . F o r th e doctorate, m in e ra l economics a n d m a te ria ls science a re on th e low est end, w hile th e re is no d e p a rtm e n t w hich is co n sisten tly a t th e h ig h end o f all of th e a re as.
As expected, as th e p ercen tag e of p a r t tim e te rm s in creases, th e n u m b e r of te rm s a n d th e tim e ta k e n in crease, w hile th e h o u rs decrease. N oncitizens took a few m ore h o u rs for th e m aste rs, b u t took few er y e ars for a Ph.D . M a ste rs stu d e n ts t h a t w ere re sid e n ts took a few m ore h o u rs th a n n o n resid en ts. D octorate stu d e n ts t h a t w ere resid en ts took few er te rm s a n d sig n ifican tly less tim e th a n n o n resid en ts. T he ty p e of a id did m ak e some difference, TA’s g en erally fin ish ed low er in all th re e a re as. T hose w ith o u t aid did ta k e few er h o u rs, b u t m ore tim e.