301
Moustafa A. Fadel1
ABSTRACT
Optimal management of irrigation systems and their efficient use of energy is a major global concern where energy resources are jeopardized. Effective solar irradiance in the United Arab Emirates is available most of the year which makes it easy to project PV (Photo Voltaic) system output and the produced flow and pressure produced by a PV-powered DC pump. A PV- irrigation system was developed in the experimental farm of the College of Food and Agriculture, United Arab Emirates University.
In this paper an adaptive scheduling scheme is developed to provide an adaptive control of a photovoltaic powered irrigation system according to the availability of solar energy as well as the field conditions of the irrigated zones.
Simulation of the PV irrigation system including PV module, pump and irrigation network is carried out using Matlab ™ to predict power output using historical data, and water application rates accordingly. An executive irrigation schedule is also developed utilizing direct weather data from weather station to implement unexpected variation in weather conditions and field water requirements as well.
INTRODUCTION AND BACKGROUND
According to UN World Water Development Report in 2008, it is estimated that two out of every three people will live in water-stressed areas by the year 2025. In Africa alone, it is estimated that 25 countries will be experiencing water stress (below 1,700 m3 per capita per year) by 2025. Today, 450 million people in 29 countries suffer from water shortages.
Oi (2005) reported that water resources are essential for satisfying human needs, protecting health, and ensuring food and energy production, and the restoration of ecosystems, as well as for social and economic development and for sustainable development . There is a great and urgent need to supply environmentally sound
technology for the provision of drinking water. Remote water pumping systems are a key component in meeting this need. It will also be the first stage of the purification and desalination plants to produce potable water.
Designing a PV- irrigation system capable of irrigating all zones of a field at the same time according to the maximum energy output would increase PV module, pumping and pipeline costs significantly. There are usually restrictions on available energy, so more PV modules would be dedicated to produce enough energy. In this research a control
1 Associate Professor, Department of Aridland Agriculture, College of Food and Agriculture, United Arab
algorithm will be developed in order to sequence irrigation according to energy availability.
Hamrouni et al (2008) quoted Kim (2007) that the efficiency of the PV pumping system depends on several climatic factors such as solar radiation , ambient temperature and the state of the solar panel ( ageing, cleanliness, etc..) .
Ghoneim (2006) reported that the use of photovoltaic power for water pumping is
appropriate, as there is often a natural relationship between the availability of solar power and the water requirement. Water requirement increases during hot weather periods when the solar radiation intensity is high and the output of the solar array is at its maximum. On the other hand, the water requirement decreases when the weather is cool and the sunlight is less intense
Hamrouni et al (2008) modeled a PV pumping system, and concluded that these performances are maximal in the midday, but are reduced when the meteorological parameters are not optimum. In the last part of the paper, we have present several results of an experimental PV pumping system for a normal day. For normal functioning mode, all figures show a good agreement between the experimental and the simulated system. Sheriff et al (2003) developed and validated a PV toolbox for the Matlab®/Simulink® environment.
Atlas and Sharaf (2007) developed a simple on-line fuzzy logic-based dynamic search, detection and tracking controller to ensure maximum power point (MPP) operation under variations in solar insulation, ambient temperature and electric load variations. They reported that PV arrays are built up with series/parallel-connected combinations of solar cells. A solar cell is usually represented as
Ic
R
V
c AkTe I II I s p c ph c−
=
ln(
+ 0−)
(1)where e is electron charge (1.602X10¹⁹ C), k the Boltzmann constant (1.38X10²³ J/K), IC
the cell output current (A), IPh the photocurrent which is a function of irradiation level and junction temperature I0 the reverse saturation current of diode (0.0002 A), RS the
series resistance of cell (0.001Ω), TC the reference cell operating temperature (20 oC), VC
the cell output voltage (V).
Faranda and Leva (2008) stated that a Maximum Power Point Tracking (MPPT) technique is needed to draw peak power from the solar array to maximize the produced energy. And Bouzidi et al (2009) presented a methodology to analyze the performance of photovoltaic system of pumping. Based on information from Arab et al (2004) ; Arab et al ( 1999); Arab et al (2005) and Hamidat (1999) , the sizing of PV array in terms of hydraulic power and solar irradiation is given by:
s pv T r G Q h g
P
=
ρ× ××η××η×η (2)Where P is the electric power of the PV array (Wc), GT the global irradiation on the PV
array plane (kWh/m2),
η
r the array efficiency at reference temperature,η
pv the PVarray efficiency under operations conditions, ηs the sub system efficiency, Q the flow
rate (m3/h), h the total pumping head (m), ρ the water density and g is the acceleration
due to gravity, where
r r c m pv f
α
T Tη
η
= [1− ( − )]× (3) ) 20 ( 800 − + =T NOCT T GT a c (4)Where f is the matching factor (==+0.90) , α the cell temperature coefficient 0.2 to m
0.6%/oC (0.004 to 0.005% / oC for Si), Tr the reference temperature, Tc the daily average
cell temperature and Ta is the hourly ambient temperature oC.
MATERIALS AND METHODS Solar Pumping System
The PV system consists of ten multi-crystalline silicon photovoltaic NE-80E2E Sharp modules with maximum power voltage (Vpm) 17.1V and 80W maximum power at a
module temperature of 25oC. Since the number of sunny days in the United Arab
Emirates exceeds 350 days per year and for environmental reasons, the system was not equipped with batteries. The system is used to irrigate a shade house in the College of Food and Agriculture, UAE University. PV unite is located 24.356967 Latitude and 55.80842 Longitude.
The Grundfos SQF 2.5-2 pump is designed especially for renewable energy sources, such as the sun and the wind energy. It is a submersible pump driven by a MFS3 motor with maximum power input of 900W. The speed range for the motor is 500-3000 rpm depending on the power input and the load and motor maximum current is 7 A. The pump delivers its maximum performance when one of the mentioned limitations is reached.
The pump is protected against over and under voltage overload and over-temperature and equipped with Maximum Power Point Tracking (MPPT). The built in electronic circuit enables the pump to keep its duty point continuously optimized according to the input power available.
Irrigation System
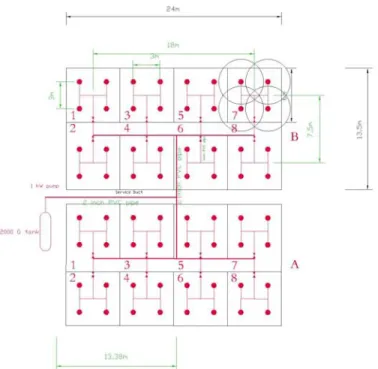
The expandable irrigation system is designed to irrigate two 24 x 13.5 m shade houses with 32 Hunter A10’ rain shower sprinklers. The required pressure ranges between 15-70 PSI, with a precipitation rate approximately 1.5" (38 mm) per hour.
The pump is submersed in a 2000 gallon water tank and 8 solenoid valves divide the each shade-house area into 8 zones. (Fig. 2)
Water requirements of each zone is about 126 liters per day and the total water
requirements of the whole shade house is 528 liters per day. On the other hand the head needed to operate the rain shower sprinkler should not be less than 20PSI (including the head losses through pipeline from pump to the f sprinkler) and optimum performance at 25 PSI and 1.56 GPM. The plan is to extend the shade house by adding more similar units and manipulate management to reach to the maximum solar-irrigation system.
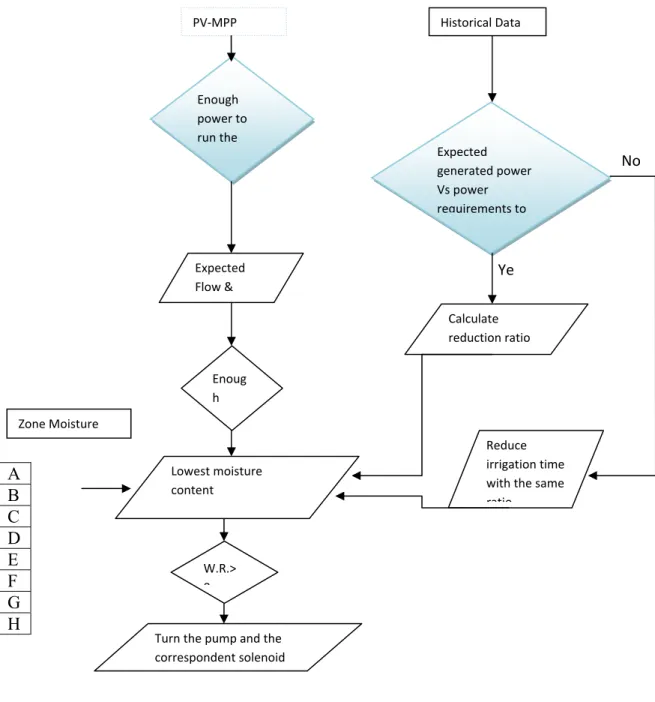
Adaptive Scheduling Algorithm
Each 36 m2 zone water requirement was calculated as 126 liter/day/zone where four
sprayers are spraying with the variable rate according to the solar pump performance which depends on photovoltaic output. According to the theoretical sprinkler
performance chart, sprinkler discharge is 5.15 LPM to 11.05 LPM when water pressure ranged ranges from 20 to 40 Psi.
Using this relation, the controller calculates operating time according to the expected pump output and then adjusts time according to the actual output.
Historical information
Figure 4. Control flow chart A B C D E F G H No Ye Zone Moisture Historical Data Expected generated power Vs power requirements to Calculate reduction ratio Reduce irrigation time with the same ratio Enough power to run the Expected Flow & Enoug h Lowest moisture content W.R.> 0
Turn the pump and the correspondent solenoid
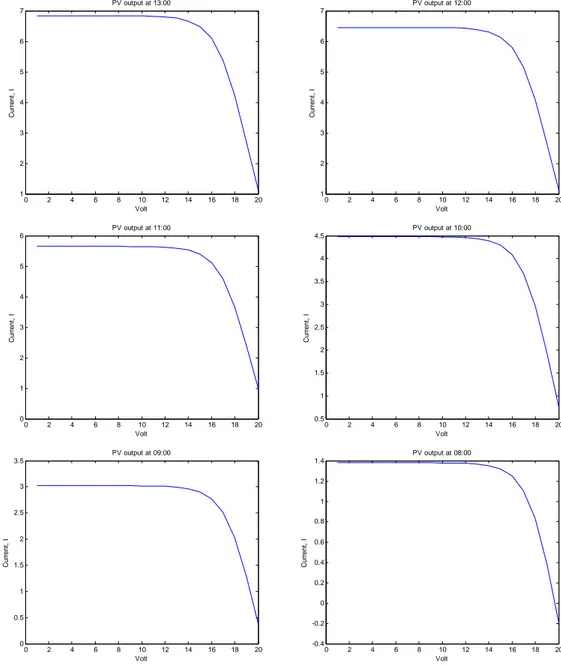
RESULTS AND DISCUSSIONS Simulation Results 0 2 4 6 8 10 12 14 16 18 20 -0.5 0 0.5 1 1.5 2 2.5 3 PV output at 18:00 Volt C u rr ent , I 0 2 4 6 8 10 12 14 16 18 20 0 0.5 1 1.5 2 2.5 3 3.5 4 4.5 PV output at 17:00 Volt Curren t, I 0 2 4 6 8 10 12 14 16 18 20 0.5 1 1.5 2 2.5 3 3.5 4 4.5 5 5.5 PV output at 16:00 Volt Curren t, I 0 2 4 6 8 10 12 14 16 18 20 0 1 2 3 4 5 6 7 PV output at 15:00 Volt C u rr e n t, I 0 2 4 6 8 10 12 14 16 18 20 0 1 2 3 4 5 6 7 PV output at 14:00 Volt Curren t, I 0 2 4 6 8 10 12 14 16 18 20 -0.8 -0.6 -0.4 -0.2 0 0.2 0.4 0.6 0.8 1 PV output at 19:00 Volt Current, I
0 2 4 6 8 10 12 14 16 18 20 1 2 3 4 5 6 7 PV output at 13:00 Volt Curren t, I 0 2 4 6 8 10 12 14 16 18 20 1 2 3 4 5 6 7 PV output at 12:00 Volt Curren t, I 0 2 4 6 8 10 12 14 16 18 20 0 1 2 3 4 5 6 PV output at 11:00 Volt Curren t, I 0 2 4 6 8 10 12 14 16 18 20 0.5 1 1.5 2 2.5 3 3.5 4 4.5 PV output at 10:00 Volt Curren t, I 0 2 4 6 8 10 12 14 16 18 20 0 0.5 1 1.5 2 2.5 3 3.5 PV output at 09:00 Volt C u rr ent , I 0 2 4 6 8 10 12 14 16 18 20 -0.4 -0.2 0 0.2 0.4 0.6 0.8 1 1.2 1.4 PV output at 08:00 Volt C u rr ent , I
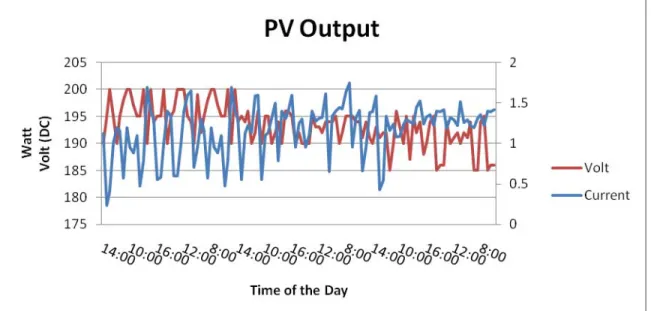
Figure 6. PV output in May 2009
Figure 8. Hourly distribution of PV output
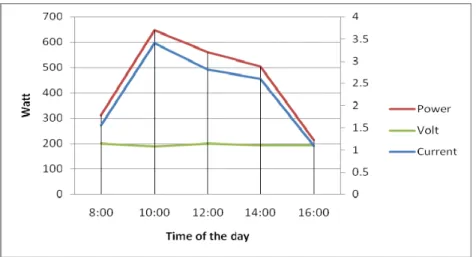
According to Figure 5&6, PV output reaches its maximum value around 10:00 am while the temperature is not high enough to reduce its efficiency. It seems that PV output should have been recorded before 8:00 am which exceeded the power generated at 16:00 and makes it helpful to start irrigating as early as 6:00 am using the available Wattage output.
Trying to keep pump performance efficiency more than 50%, the performance curve was used to generate a lookup table for each range of PV power output as shown in table 1 and 2. Table 1 shows the water requirements of each zone as a result of the difference between the daily water requirements and soil moisture content at specific time. The first three columns contain the available power from the simulation, expected water flow rate and the corresponding pressure from pump performance curve. This table is used to generate Table 2 where irrigated zone are sequenced according to its needed amount and the available water flow and pressure.
CONCLUSION
Photovoltaic utilization in agriculture should be studied to help farmers around the world to run agricultural businesses sustainably and effectively. Design of the irrigation system is a major factor to minimize the required pumping power and to improve its
controllability. The developed control algorithm can help designers to minimize photovoltaic system sizing and hence maximize the feasibility of employing solar systems in irrigation networks.
Maximum actual power output did not exceed 45% of the nominal power output which may be a result of high ambient temperature increase. The developed algorithm
scheduled the irrigation of the eight zones of each section (A & B), which minimized the total energy required for irrigation where it was 906 W theoretically and 1037 W
Table 1. Flow Vs Pressure lookup table Zo n e A1 A2 A3 A4 A5 A6 A7 A8 Time Pow er, W* Flow rate, 3 m /hr Head , PSI WR WR WR WR WR WR WR WR 8:00 224 - - 126.0 124.0 109.0 118.0 105.0 124.0 110.0 9:00 480 1.6 92 128.5 126.5 111.2 125.4 107.1 126.5 112.2 10:00 720 1.8 103 131.1 129.0 113.4 132.8 109.2 129.0 114.4 11:00 754 1.8 105 133.7 138.6 115.7 135.2 111.4 131.6 116.7 12:00 812 1.8 112 136.4 144.2 118.0 137.7 113.7 134.2 119.1 13:00 863 1.9 118 139.1 146.9 120.3 140.3 115.9 136.9 121.4 14:00 852 1.9 118 141.9 149.6 122.8 145.9 118.2 139.6 123.9 15:00 795 1.85 115 144.7 152.4 125.2 155.5 120.6 142.4 126.4 16:00 790 1.85 115 147.6 155.3 127.7 158.3 123.0 145.3 128.9 17:00 656 1.7 100 150.6 168.2 130.3 161.0 125.5 148.2 131.5 18:00 400 - - 153.6 171.2 132.9 163.8 128.0 151.2 134.1 19:00 136 - - 156.7 184.2 135.5 166.7 130.6 154.2 136.8
*According to May 2008 data WR: water requirem
Table 2. Theoretical irrigation schedule Time Pow er, W Flow rate, m 3 /hr Head , PSI Irrigated Z o ne 8:00 224 - - 9:00 480 1.6 92 10:00 720 1.8 103 11:00 754 1.8 105
Table 3. Practical irrigation schedule
Time Pow er, W Flow rate, m 3 /hr Head, PSI Irrigated Z o ne 8:00 164 - - 10:00 390 1.0 71 12:00 456 1.6 131 14:00 425.6 1.2 57 16:00 89.7 - - A2 (5min ) A6 (5.5min ) B3 (7min ) B6 (10min ) B1 (5min ) A4 (5min ) A8 (4.5min B2 (3min ) B4 (11min ) A7 (4min ) A3 (5.5min ) A5 (4.5mi B5 (6min ) B7 (4min ) B8 (5min ) B4 (15.5min A3 (6.5min ) A8 (7.5min ) B8 (11.5min ) B1 (19min ) A1 (8.7min ) A2 (8.5min ) A6 (8.5min ) B3 (9.5min ) B6 (12min ) A5 (6.5min A4 (5.6min ) A7 (5.5min ) A8 (5.5min ) B5 (8.5min ) B2 (10min )
REFERENCES
Altas H. I. and A.M. Sharaf 2008 “A novel maximum power fuzzy logic controller for photovoltaic solar energy systems” Renewable Energy 33 (2008) 388–399
Arab H. , Benghanem M. and Gharbi A. 2005 “ Dimensionnement de systemed de pompage photovoltaique . Revue des Energies Renouvelables “ 8: 19-26.
Arab H. , Chenlo F. and Benghanem M. 2004 “ Loss-of-load probability of photovoltaic pumping systems. Solar Energy 2004; 76: 713-23.
Arab H. , Chenlo F., Mukadam K. and Balenzategui JL. 1999 “Performance of PV water pumping systems “ Renewable Energy 1999; 18:191-204
Bouzidi B. , M. Haddadi and O. Belmokhtar 2009 “ Assessment of a photovoltaic pumping system in the areas of Algerian Sahara” Renewable & Sustainable Energy Reviews 13 (2009) 879-886
Faranda R. and S. Leva 2008 “ A comparative study of MPPT techniques for PV
systems” Proceedings of the 7th WSEAS International Conference on Application of
Electrical Engineering, Trondheim, Norway.
Ghoneim A.2006 ‘Design Optimization of Photovoltaic Powered Water Pumping
Systems’, Energy Conversion and Management, Vol. 47, N°11-12, pp. 1449-1463, 2006. Hamidat A. 1999 “Simulation of the performance and cost calculations of the surface pump “ Renewable Energy 1999; 18:383-92.
Hamrouni N., M. Jraidi and A. Cherif 2008 “Solar Radiation and Ambient Temperature Effects on the Performance of a PV Pumping System” Revue des Energies Renouvelables
Vol. 11 No1(2008)95-106
Il-Song Kim, ‘Robust Maximum Power Point Tracker Using Sliding Mode Controller for Three-Phase Grid-Connected Photovoltaic System’, Solar Energy, Vol. 81, N°3, pp. 405 – 414, 2007.
Oi Akihiro 2005 “Design and Simulation of Photovoltaic Water Pumping System” MSc. Thesis Presented to Faculty of California Polytechnic State University, San Luis Obispo Sheriff F., D. Turcotte and M. Ross 2003 “PV Toolbox: A Comprehensive Set of PV System Components for the Matlab®/Simulink® Environment” SESCI (Solar Energy Society of Canada Inc) 2003 Conference.
UNEP 2008 “Vital Water Graphics” August 2008