THESIS ACUTE AND CHRONIC COBALT TOXICITY IN DUGESIA DOROTOCEPHALA Submitted by Andrea Sternenberger Department of Environmental and Radiological Health Sciences In partial fulfillment of the requirements For the Degree of Master of Science Colorado State University Fort Collins, Colorado Fall 2011 Master’s Committee: Advisor: Howard Ramsdell Marie Legare Steven Strauss
ABSTRACT ACUTE AND CHRONIC COBALT TOXICITY IN DUGESIA DOROTOCEPHALA Limited data are available regarding cobalt toxicity for water quality criteria and risk assessment evaluation for freshwater organisms. These experiments were performed to establish median lethal concentrations from short term studies and to identify the most sensitive sublethal effect in a long term study in a flatworm species, Dugesia dorotocephala. Another study was conducted to elucidate the relationship between calcium, magnesium and cobalt toxicity in D. dorotocephala. During 4 and 7 day studies, median lethal concentrations of cobalt increased with total hardness indicating a protective effect. Calcium was shown to be more protective than magnesium in the presence of cobalt. A 60 day study showed fissioning rate, a process essential for maintenance of the D. dorotocephala population, to be the most sensitive endpoint. A lowest observable adverse effect concentration (LOAEC) of 1 mg Co/L (nominal) was incorporated into the calculation of an acute to chronic ratio (ACR), an important metric for risk analysis accounting for sublethal effects that may occur by mechanisms different from lethal ones. A NOAEC (no observable adverse effect concentration) was not determined because significant effects were observed at the lowest cobalt concentrations tested (<1 mg Co/L). Without an exact NOAEC, the ACR values established in this study represent the upper and lower bounds of the acute to chronic ratio for cobalt in D. dorotocephala.
ACKNOWLEDGMENTS I would like to acknowledge Dr. Howard Ramsdell, Olivia Arnold, the Center for Environmental Medicine, Dr. Rami Naddy, Bryan Brattin, Dr. Thomas Keefe, Dr. David Pillard, David Menzies and Nancy Tranzow for all of their support, patience, guidance and resources without which this work would not be possible. I would also like to recognize Emily Sadler and Dr. James ZumBrunnen and the Colorado State University’s Department of Statistics for their statistical wisdom.
TABLE OF CONTENTS ABSTRACT………..………..……….Page ii ACKNOWLEDGMENTS………..…Page iii I. INTRODUCTION………..………..…Page 1 II. LITERATURE REVIEW.………..……….…Pages 2–16 III. MATERIALS AND METHODS….………..……….Pages 17–24 IV. RESULTS………..……..………Pages 25–69 V. DISCUSSION……….……….Pages 70–76 VI. REFERENCES.………..………..………...Pages 77–83
I. INTRODUCTION The toxicity of cobalt to freshwater organisms is relatively poorly known. Cobalt, the 33rd most abundant element in the Earth’s crust (ATSDR 2004), has natural and anthropogenic sources of exposure to the environment. The ecological risk assessment and development of water‐quality criteria for cobalt are currently hampered by insufficient knowledge about the toxicity of cobalt to freshwater organisms (DeSchamphelaere et al. 2008). Dugesia dorotocephala, a freshwater, asexual flatworm, is an important species to aquatic ecology (Kenk 1980). They model vulnerable systems of higher animals and may have the potential to become a sentinel species for toxicity in the environment. This work was conducted to establish acute LC50 cobalt values in D. dorotocephala at varying levels of hardness, to establish valid sublethal endpoints in chronic studies and to evaluate the role of calcium in cobalt toxicity.
II. LITERATURE REVIEW l. Cobalt Cobalt is a naturally occurring element that appears in the periodic table between iron and nickel. Pure cobalt is a silver gray, insoluble solid with one stable isotope, 59Co (Greenwood and Earnshaw 1997). Cobalt commonly occurs in three valence states: elemental cobalt, +2 and +3 (Greenwood and Earnshaw 1997, Kim 2006). Cobalt (II) is stable in aqueous solutions and is the major form of cobalt found in simple salts (Greenwood and Earnshaw 1997). Cobalt (III) is a strong oxidizing agent and is unstable in aqueous solutions (Greenwood and Earnshaw 1997). Cobalt (III) has biochemical importance forming a coordination complex with four pyrrole rings to result in an essential mammalian vitamin, vitamin B12 (Lehninger et al. 2005). See Table 2.1 for the properties of elemental cobalt.
Table 2.1. Properties of cobalt and a common cobalt compound
Cobalt Cobalt (II) Chloride Hexahydrate
CAS 7440–48–4 7791–13–1
Synonyms Cobalt–59, cobalt metal cobaltous chloride Cobalt dichloride,
Molecular Formula Co CoCl2∙6H2O
Atomic/Molecular Weight (g/mol) 58.93 237.93
Color, Physical State Silvery gray, solid Rose red, solid crystals
Melting Point (oC) 1,495 87
Boiling Point (oC) 2,870 1,049
Vapor Pressure 1 mm Hg at 1,910 oC 40 mm Hg at 770 oC
Density (g/cm3) 8.9 at 20 oC 1.92 at 20 oC
Water Solubility Insoluble 76.7 g/100 mL at 0 oC
Of the 26 known radioactive isotopes of cobalt, 57Co and 60Co are the two most important. The most commonly used source of gamma radiation is 60Co (Mahara and Kudo 1981). Radioactive cobalt can be released to the environment as a result of nuclear research and development, nuclear accidents, operation of nuclear power plants, and radioactive waste dumping in the sea or in radioactive waste landfills (Mahara and Kudo 1981). On the Environmental Protection Agency’s National Priority List, which identifies the most seriously contaminated hazardous waste sites in the nation, 60Co is present at 13 of the 1,636 sites (ATSDR 2004). Sources: As the 33rd most abundant metal in the Earth’s crust at a concentration of 25 mg/kg, cobalt is found naturally in the soil, seawater, surface and ground water (Smith and Carson 1981, p. 21). Cobalt occurs at an average concentration of 45–48 mg Co/kg in basaltic rocks, 4–
147 mg Co/kg in schists, 19–20 mg Co/kg in clays and 1.2 mg Co/kg in sandstone and limestone (Smith and Carson 1981, p. 21). Presumably, cobalt substitutes for Fe(II) and Mg(II) ions in many minerals which results in mining in an attempt to concentrate the cobalt content (Smith and Carson 1981, p. 22). Cobalt is associated with arsenic, antimony, lead, nickel, silver, iron, zinc and copper ores and as arsenides, sulfides and oxides in mineral form (Kim 2006, Smith and Carson 1981, p. 22). Natural atmospheric deposition from windblown soil, seawater spray, volcanic eruptions, and forest fires contribute to the atmospheric cobalt emissions in the environment at an estimated 6,100 tonnes per year (Nriagu 1989). Elevated levels in soils and water are observed as a result of anthropogenic activities such as mining, applying phosphate fertilizers, disposing of cobalt‐containing wastes and atmospheric deposition from activities such as the burning of fossil fuels and smelting and refining of metals (Smith and Carson 1981, p. 422). Anthropogenic sources of cobalt include fossil fuel and waste combustion, vehicular and aircraft exhausts, processing of cobalt and cobalt containing alloys, copper and nickel smelting and refining, and the manufacture and use of cobalt chemicals and fertilizers derived from phosphate rocks (Smith and Carson 1981, p. 407). Use: The United States is the world’s largest cobalt consumer (USGS 2010). Cobalt’s metallurgical application in materials such as superalloys is commonly used by the military (USGS 2010). Cobalt is easily magnetized and can retain its magnetism under a wide range of environmental conditions (Young 1948). Cobalt is therefore also useful in magnetic alloys which resist corrosion and wear (ATSDR 2004). It is used to increase strength for cutting tools, to add
as catalysts in chemical reactions such as desulfurization processes used by the oil/gas industry (ATSDR 2004). A growing use of cobalt is in Ni‐Cd batteries and lithium ion cells (ATSDR 2004) which are used in cell phones, computers and hybrid vehicles. Gamma rays from 60Co are used to treat cancer, to sterilize instruments and food‐borne pathogens and to extend the shelf‐life of food by delaying ripening (ATSDR 2004). The gamma rays can also destroy harmful organisms in sludge, water and wood (ATSDR 2004). Exposure: Exposure to cobalt occurs through four media: water, soil, food and air (Kim 2006). Atmospheric cobalt is associated with particulate matter at levels below one ng Co/m3 at unpolluted sites and in open‐ocean environments (Smith and Carson 1981, p. 32, Kim 2006). In source areas, cobalt concentrations may exceed 10 ng Co/m3 but the highest recorded atmospheric level, 48 ng Co/m3 was recorded near a nickel refinery in England (Smith and Carson 1981, p. 32). Water In ambient, uncontaminated environments, the cobalt concentrations are generally below 5 µg Co/L (Nagpal 2004). Surface and groundwater cobalt concentrations of <1 µg Co/L are found in pristine areas and can be up to 10 µg/L in urban areas (Smith and Carson 1981, p. 428). Concentrations may be higher in mining and agricultural areas. Levels in an Arizona creek near a copper mine and smelter were recorded at 4500 µg Co/L and 6500 µg Co/L was found in a Missouri river which receives mining and milling effluent (Smith and Carson 1981, p. 428). Mean seawater concentrations of 0.078 and 0.39 µg Co/L were observed in the Caribbean Sea and Indian Ocean respectively
Co/L in drinking waters but up to 107 µg Co/L have been reported (Smith and Carson 1981, p. 425). Rainwater samples were found to have levels ranging from 0.045 µg Co/L to 2.9 µg Co/L (Smith and Carson 1981, p. 428). Soil Found in greater abundance than cadmium, molybdenum and lead, the average U.S. soil sample contains 7.2 mg Co/kg (Kim 2006). Soils containing 0.5–3 mg Co/kg are considered deficient for the required intake by ruminants (Kim 2006). Airports, ore smelting facilities, ore deposits, mines, highway traffic or other industrial sites may contain elevated soil concentrations up to 12,700 mg Co/kg (Abraham and Hunt 1995, Smith and Carson 1981, p. 26). Unpolluted freshwater sediments generally contain less than 20 mg Co/kg, similar to cobalt‐sufficient soil, but polluted lake and river sediments can contain up to 133 mg Co/kg (Smith and Carson 1981, p. 28, 38). Cobalt sorbs to particles and may settle into the sediment or may be sorbed directly by the sediment (ATSDR 2004). It may precipitate from overlying water as carbonates and hydroxides or with mineral oxides (ATSDR 2004). Cobalt may also sorb to humic acid substances in water (ATSDR 2004). Cobalt can also be transported in the dissolved form or as suspended sediment by rivers to lakes and the sea or by ocean currents (ATSDR 2004, Smith and Carson 1981, p. 34). Environmental factors such as pH, redox potential (Eh) and the presence of chelating agents will affect the fate and transport of cobalt: At a lower pH, more cobalt will be present in soluble forms and it will have greater mobility
(Smith and Carson 1981, p. 33, 532, 582, ATSDR 2004). Cobalt adsorbs strongly and rapidly to soil and sediment, in which it is retained by metal oxides, minerals and natural organic matter (ATSDR 2004). Plants As a result of the presence of cobalt in the soil and sediment, it has been detected in living plants as well at a mean level of 0.48 µg Co/g (Bowen 1966). Grasses normally contain 0.20–0.35 µg Co/g but in deficient soil, concentrations average 0.02–0.06 µg Co/g (Hamilton 1994). The copper flower plant (Haumaniastrum robertii), can actually hyperaccumulate cobalt at a mean level of 4,304 mg Co/kg dry weight (Brooks 1977). Cobalt has been shown to affect the growth and metabolism of plants depending on several factors including complexation with other minerals and physical conditions such as pH, temperature and salinity (Palit et al. 1994). Toxic effects on plants include inhibited active transport of ions, photosynthetic inefficiency, change in morphology, impaired DNA replication and RNA synthesis, and alteration of the sex of plants (Palit et al. 1994). Stimulated algae growth has been seen at low concentrations of Co+2 suggesting that cobalt chloride may be used effectively as a trace metal (Ahluwalia and Kaur 1988). Food Food represents the largest potential source of cobalt exposure for humans (Kim 2006). The Centers for Disease Control and Prevention recommends a daily intake of 0.1 µg Co/day (ATSDR 2004). Grains and cereals have the highest cobalt content followed by potatoes, fish, sugar and coffee (Smith and Carson 1981, p. 60). The estimated intake
studies reported a wide range of concentrations in these foods. Several studies have identified cobalt in unfiltered coffee effusions at an average level of 0.93 mg Co/kg dry coffee in one study (Smith and Carson 1981, p. 60). Cooking and canning may cause a loss of cobalt from the fresh food (Smith and Carson 1981, p. 60). Up to 10% of cobalt can be lost by roasting and grilling, 90% by stewing and boiling and 70% by canning (Smith and Carson 1981, p. 60). The foam‐stabilizing additives for beer production contain cobalt at a maximum authorized concentration of 1 mg Co/L due to the fatal cases of cardiomyopathies as a result of the synergistic action between alcohol and cobalt at higher concentrations (Smith and Carson 1981, p. 61, 69). Air Cobalt, as particulate in the air, will return to land or surface water as wet or dry deposition depending on size, density and meteorological conditions (ATSDR 2004). Particles greater than 2 µm in diameter may deposit within 10 km from the point of emission but finer particles may travel further (ATSDR 2004). Concentration Factors: Aquatic concentration factors describe the level of cobalt in an organism compared to that in water. Marine zooplankton have concentration factors (CFs) ranging from 1,000 to 10,000 (Smith and Carson 1981, p. 58, 802). Rooted freshwater plants have CFs less than 10 which suggest the absorption occurs through the roots in the cobalt‐enriched sediment (Smith and Carson 1981, p. 59, 802). Freshwater algae, with CFs from 400 to nearly 2 million, reflect the effect of their large surface–to–volume ratio on accumulation (Smith and Carson 1981, p. 58, 802). Insects and insect larvae show very high CFs, up to 100,000, possibly due to adsorption on
1981, p. 58, 802). Freshwater fish and fish muscle CFs range from 10 to 1,000 (Smith and Carson 1981, p. 58, 802). Overall, the higher an organism is in the food chain, the lower the CF (Smith and Carson 1981, p. 803). Some variables that influence concentration factors include the high surface‐to‐volume ratio of plankton species which favors adsorption, absorption via ingestion of food particles by invertebrates and absorption via the gills in aquatic vertebrates (Smith and Carson 1981, p. 58). Essential Nutrient: Cobalt forms a unique carbon–metal bond in vitamin B12, an essential nutritional molecule. This vitamin is not synthesized by plants or animals but rather by a few microorganisms. This vitamin is essential to convert methylmalonyl coenzyme A to succinyl coenzyme A, an intermediate of the citric acid cycle, and the formation of s‐adenosylmethionine, an essential cofactor for methylation reactions. The most common congeners of vitamin B12 (cobalamin) have three portions to the molecular structure (Hillman 1996). The first two portions are the corrin ring system of coenzyme B12 which coordinates to cobalt and a dimethylbenzimidazole ribonucleotide. One of four groups complete the molecule and form the corresponding congener: cyanide, hydroxyl, methyl or 5‐deoxyadenosyl (Hillman 1996). Cobalt +1 complexes with 5’‐deoxyadenosine through a weak covalent bond. This bond is
easily broken with exposure to visible light and produces a radical and Co+2. Cobalt +3, when
complexed with a hydroxyl group in the sixth coordination position instead of
5‐deoxyadenosine, can be reduced by a reductase enzyme and NADH to cobalt +2 and further to
deoxyadenosine and methyl forms. However, the cyano and hydroxyl forms are the more commonly encountered forms which are converted to the active forms (Hillman 1996, Lehninger 2005, Stryer 1988). Ruminants are completely dependent on the microflora within the rumen for vitamin B12 synthesis and require more cobalt from the diet than nonruminants. Ruminants use vitamin B12 to convert propionate, their primary energy source to glucose. The estimated cobalt requirement is 0.07–0.10 mg/kg diet. The estimated intake of cobalt for nonruminants such as pigs and chicks is only 0.01–0.02 mg/kg diet because nonruminants require preformed vitamin B12 to meet their metabolic needs (Swenson 1977, Van Soest 1994). Cobalt deficiencies have been associated with several diseases. An autoimmune disease in humans, pernicious anemia, produces insufficient amounts of a factor required for vitamin B12 absorption (Lehninger 2005). Several wasting diseases, including bush sickness, salt sickness, Grand Traverse disease, Mairoa dopiness and Morton Mains disease, have been reported globally as a result of cobalt insufficiencies in cattle and sheep (Young 1948). Cobalt deficient herbage occurs as a result of cobalt deficient soil which can be corrected by applying cobalt‐infused fertilizer or concentrated salt licks (Smith and Carson 1981, p. 25, Young 1948). When iron is present, cobalt and iron mutually antagonize the absorption of each other due to the greater affinity cobalt has in the transport system of the intestine (Thomson et al. 1971).
Toxicology: Cobalt toxicosis is not likely to occur in nonruminants unless environmental contamination of feed or water occurs (National Research Council 2005). Cobalt toxicosis in animals is very rare because concentrations of cobalt normally present in animal diets are much lower than those needed to cause toxicosis (National Research Council 2005). However, errors in mineral supplement formulation in ruminants, for example, could result in cobalt toxicosis (National Research Council 2005). The LD50 in rats for CoCl2∙6H20 is 42.4 mg Co/kg (ATSDR 2004).
When fed an iron‐sufficient diet, 50 mg Co/kg diet did not affect weight gain but 100 mg Co/kg diet did (Huck 1975). Myocardial damage in adult rats (Morvai et al. 1993), testicular degeneration in male rats and mice (Corrier et al. 1985), impaired fetal development in mice and rats (Szakmary et al. 2001) and increased mortality in pregnant rabbits have all been reported (Szakmary et al. 2001). One suggested mechanism involves oxidative damage to the purine and pyrimidine bases of DNA caused by cobalt (II) exposure (Kasprzak et al. 1994). Vitamin E and selenium offered protection against cobalt‐induced cardiomyopathy (Van Vleet et al. 1977). Cobalt toxicity has been noted in humans. Cardiac damage in beer drinkers progressed from dyspnea and hypotension to death in more than 40% of the cases. Irregular histologic findings were noted not only in the heart but also in the thyroid (Smith and Carson 1981, p. 69). Cobalt toxicity was observed as a result of treatments for anemia in humans prior to 1970 which included a daily dose of cobalt up to 200 mg Co/day. This practice was suspended due to the onset of goiters and classical hypothyroidism signs that developed as early as six weeks after cobalt therapy began. Iodine uptake was suppressed by 20 to over 90%. Other
symptoms including nausea, neurogenic deafness, anorexia, dermatologic conditions and tinnitus were also documented in humans receiving cobalt anti‐anemia therapy (Smith and Carson 1981, p. 69). Hypoxia inducible factor (HIF), a transcription factor, leads to angiogenesis and stimulation of erythropoietin. Under normoxic conditions, hydroxylase enzymes add a hydroxyl group to the alpha subunit of HIF on a conserved proline residue. When hydroxylated, the von Hippel‐Lindau (VHL) protein binds to the alpha subunit which initiates proteasomal degradation. When the alpha subunit is not hydroxylated, as in hypoxic conditions, dimerization of the other subunit, HIF beta, occurs and translocates to the nucleus where transcription of angiogenic, anaerobic glycolytic and erythropoietic proteins begins (Klaassen 2008, p.91). Cobalt has been shown to inhibit VHL by blocking the VHL binding site on the alpha subunit or by replacing iron in the hydroxylase enzyme thus inactivating the enzyme (Yuan et al. 2003, Epstein et al. 2001). In addition, the antioxidant ascorbate is essential to stabilizing the iron+2 in hydroxylase. It has been demonstrated that when cells are exposed to cobalt, less ascorbate is absorbed. This deficiency likely favors iron oxidation leading to inactivation of the enzyme (Salnikow et al. 2004). Cobalt has been shown to cause toxic effects in primary murine glial cells including mitochondrial damage. This lead to the release of apoptogenic factors leading to apoptosis of the cell. Cobalt, similar to hypoxia, also stimulated the expression of HIF‐1α regulated genes (Nip3 and iNOS) and depleted ATP production. Thus, metabolic and neurotoxic effects have been documented at concentrations of 0.2–0.8 mM cobalt +2 (Karovic et al. 2007). Neurotoxic effects, specifically memory deficits, were also observed in ex‐factory workers who were
Cobalt toxicity has been evaluated in aquatic organisms including microalgae, protozoa, invertebrates, fish and amphibians. The Onchorynchus mykiss (rainbow trout) LC50 was lower compared to other freshwater fish such as Pimephales promelas (fathead minnow). A flatworm species in the same genus as the species used in the studies for this thesis, Dugesia tigrina, had a 96‐hour LC50 between the rainbow trout and fathead minnow (Table 2.2). Table 2.2 Median lethal concentrations (LC50 values) for cobalt in other species
Common Name Species LC50 (mg Co/L)
Hardness
(mg CaCO3/L) Reference
Fathead Minnow P.promelas 21.8 130 Ewell et al. 1986
Worm D.tigrina 11.3 130 Ewell et al. 1986
Rainbow Trout O.mykiss 1.4 25 Marr et al. 1998
The LC50 values were based on a testing time of 96 hours. Hardness was determined in the dilution water. The contribution of cobalt to the total hardness was not accounted for when the exposure solutions were prepared. Cobalt is either dissolved as cobalt carbonate or as cobalt (II) ions under most environmental conditions (Tipping et al. 1998). However, bioavailability appears to depend on the water chemistry and the concentration of calcium ions (Diamond et al. 1992). Therefore, when the hardness was varied, the 24‐hour LC50 for Ceriodaphnia dubia increased from 2.4 to 5.3 mg Co/L as the hardness increased (Diamond et al. 1992). Using a gill‐cobalt binding model, calcium competition and dissolved organic matter complexation were the most important factors preventing cobalt from binding at the gills in a series of natural water tests in O. mykiss. Calcium at 17 µM allowed cobalt to bind but inhibited binding at 90 µM (Richards and Playle 1998). The data based on binding affinities indicate that cobalt binds to gill sites more weakly (log K =5.1) than other metals such as cadmium (log K=8.6), lead (log K=6.0) and zinc (log K=5.3‐ 5.5) (Niyogi and Wood 2004).
ll. Planaria Figure 1. Dugesia dorotocephala. Dugesia dorotocephala, freshwater planaria, are bilaterally symmetrical metazoans of the phylum Platyhelminthes (Figure 1). These invertebrates are unsegmented, acoelomate, and possess well‐defined anteroposterior and dorsoventral axes (Adell et al. 2010). Along the AP axis, the anterior cephalic region containing the brain and a pair of eyespots, a central region with a pharynx and a ventral mouth opening, and a posterior tail region can be distinguished (Adell et al. 2010) (Figure 1). They are best known for their ability to regenerate complete animals from fragments of their own bodies in seven days, a generally short time frame (Adell et al. 2010). The inclusion of planaria in a screening scheme would provide improved sensitivity in detecting toxicity because planaria generally respond to lower levels of contamination than do other species (Kapu and Schaeffer 1991). They can also be included in a higher tier because they may exhibit complex responses including inhibition and stimulation of reproduction, teratogenesis and tumorigenesis (Best and Morita 1982). Freshwater planaria are important components of the aquatic ecology of relatively unpolluted streams. They were incorporated in the biological assessments for water quality in Europe. The sensitivity varies between species of planaria from very sensitive to mild sensitivity
to pollution in waters but generally are intolerant of heavy metal salts (Kenk 1980). They model many of the toxicologically vulnerable systems of higher animals and may represent an economical organism for toxicity screenings and bioassays (Best 1981, Best and Morita 1982). This species occurs in nature as both sexual and asexual forms. The transformation of asexual worms into sexual ones has been observed under conditions that simulate the drying up of a pond (H.S. Ramsdell, unpublished observations). Morita and Best describe a distinct circadian rhythm of fissioning under the influence of normal photoperiods in asexual D. dorotocephala. This process, essential for maintaining and increasing their population, is difficult to observe because fissioning occurs at night and is completed in three to four minutes. Initially, a body constriction appears at the site where fissioning will occur; the rostral portion of the body contracts and then pulls away from the caudal portion which adheres to the surface of the container. The constricted region becomes narrower as it stretches. This process continues until the stretched area ruptures. Finally, the rupture closes up when the circular body wall muscles contract. After fissioning is completed, regeneration takes place to yield two complete, but smaller, planaria (Morita and Best 1993). These observations suggest that fissioning primarily involves neuromuscular events which are regulated by neurotransmitters or neuromodulators within the central nervous system (Morita and Best 1993, Best et al. 1969). Fissioning was a process previously believed to occur as a result of mucus or some other substance being released into the water from the planarian. Instead, a system of population feedback control has actually been identified. In the presence of other planaria, the brain exerts an influence (probably neurohormonal) to suppress fissioning which decreases with axial distance from the brain. The suppression is contingent on population density and thus is a part
of a feedback system for adjusting the rate of reproduction to population density. A reduced population density would lead to increased rates of fissioning whereas higher population densities suppress fissioning (Best et al. 1969). llI. Studies Reported In This Thesis The ecological risk assessment and development of water‐quality criteria for cobalt are still currently hampered by insufficient knowledge about the toxicity of cobalt to freshwater organisms (DeSchamphelaere et al. 2008). Therefore, this work was conducted to establish acute LC50 cobalt values in D. dorotocephala at varying levels of hardness, to establish valid sublethal endpoints in chronic studies and to evaluate the role of calcium in cobalt toxicity.
III. MATERIAL AND METHODS I. Culture Maintenance Asexual Dugesia dorotocephala were maintained in large white enameled dishpans that contained moderately hard reconstituted culture water. Eighteen liters of culture water were prepared at a time in a carboy using ultraviolet‐treated water from Horsetooth Reservoir in Fort Collins, CO. To adjust hardness from the soft Horsetooth Reservoir water to moderate hardness, calcium sulfate (Mallinckrodt Analytical Reagent), magnesium sulfate heptahydrate (EM Science), potassium chloride (Fisher Scientific) and sodium bicarbonate (Fisher Scientific) were added. Aeration was applied for 12–24 hours to allow for complete dissolution of the salts, thorough oxygenation and equilibration of the solution with atmospheric carbon dioxide. After three uses of a given carboy or a six month period had passed, the carboy was disinfected by allowing a 5% bleach solution to sit in the carboy for thirty to forty minutes followed by extensive rinsing with Horsetooth Reservoir water followed by Type 1 water (ASTM 1999). Planaria were collected from a tributary of the Cache La Poudre River in Bellvue, CO and acclimated over a two‐week period by transitioning their water to the laboratory culture water. The planaria were transferred to culture pans and only handled with a small wet paintbrush to minimize stress and potential injury. All of the culture pans were covered with pieces of light‐ weight plastic fitted with holes to allow for air exchange and to prevent debris falling into the pans.
Once acclimated to the water, the planaria were divided by size in different culture pans to discourage cannibalism and promote growth. They were fed organic beef liver 1–2 times a week. The pan water was changed between four and 24 hours after feeding. The planaria were placed in new culture pans with the aid of a piece of plastic screen approximately every four to six weeks or earlier if algae had overgrown in the pans. The photoperiod, 16:8 hours light:dark, was maintained with an automatic timer. II. Experimental Methods All experiments were conducted in glass crystallizing dishes with a diameter of 105 mm containing 50 mL of the desired exposure solution. The replicates were randomly stacked with their respective concentrations after each water change to minimize the effect of variation in light intensity from the overhead light. An empty crystallizing dish was placed on top of each stack for protection and to limit dehydration. Glassware used in a study was detergent‐washed, rinsed five times with tap water, three times with ultra‐pure water followed by an acid rinse of 10% hydrochloric acid. Three final rinses with Type 1 water prepared the glassware for the study (ASTM 1996). Cobalt concentrations were prepared from a stock solution (either 625 or 400 mg Co/L) made with Type 1 water using CoCl2∙6H2O (Mallinckrodt Analytical Reagent). The highest concentration for each study was prepared using the stock solution and a match water. The match water was formulated using calcium sulfate and magnesium sulfate to achieve the required hardness values while accounting for the hardness contribution of cobalt. Dilution water, prepared to match the desired overall hardness for each study, was used for the serial dilutions to the lower concentrations. Match and dilution waters were prepared separately for
every study. In an experiment where total hardness was maintained but cation concentrations varied, separate dilution and match waters for each test were prepared in individual containers. In this manner, test solutions were formulated such that hardness was held constant while cobalt concentrations varied. An initial seven‐day mortality study was conducted without hardness matching. Planaria, 10–15 mm in length, to be used for a study were segregated into a separate pan four or seven days prior to the start of the study in the appropriate dilution water in the hardness to be used during the study. Feeding occurred three days prior to the start of the study. Observations were recorded prior to a water change if one was scheduled to occur that day, typically within three hours of the time of day when the study began. Observations took place under a magnifying light and a dissecting microscope using a paintbrush to manipulate the planaria if necessary. Morphology, behavior, and any abnormalities were recorded. In studies when behavioral assessments were performed, tactile response, righting reflex and swimming speed were evaluated. Tactile response was measured by recording the time elapsed for a planarian to regain forward motility after being subjected to a touch stimulus. The planarian was observed for up to 60 seconds. If there was no movement by this time, the result was scored as “60 seconds.” The righting reflex was evaluated by measurement of the time to regain normal forward motility after the body was inverted using a small paintbrush. As with the tactile response, failure of the planarian to achieve forward motility within one minute was scored as “60 seconds.” Swimming speed was measured by counting the number of lines on a two centimeter by two centimeter grid crossed during a two‐minute time interval. The same
planarian, one per replicate and randomly chosen by the observer, was used for the three assessments. Without a convenient method for identifying individual planaria, behavioral assessments at other time points may not have been done using the same planarian. After observations, feedings would take place if required by the study design. A small piece of raw beef liver was placed in each dish. The remaining food was removed four to six hours later and the exposure solution renewed. Exposure solutions prepared within thirty minutes of use were added from a graduated cylinder as soon as the old water was removed. Vacuum filtration and a micropipette tip were used to remove the old water from each dish. Water chemistry parameters were measured on the newly prepared dilutions and on a composite sample of old exposure solutions removed from dishes during exposure solution renewal, using meters generally calibrated on a daily basis. Temperature, conductivity, pH and dissolved oxygen were recorded for both new and composited old samples but ammonia was only analyzed in the composited old water samples. Subsamples of the new and/or old solutions were preserved at each water change with 1% trace metals grade nitric acid (Fisher Scientific). After every water change, the dishes were restacked randomly within each concentration and placed under the light source with a 16:8 light:dark photoperiod. The following table (3.1) presents the methods used to determine the specific parameter.
Table 3.1. Water Chemistry Methods
pH SM 4500‐H+ B (Standard Method, 1996)
Dissolved Oxygen SM 4500‐O G (Standard Method, 1993)
Ammonia ASTM D1426‐98A, SM 4500‐NH3 D
(ASTM, 1998 and Standard Method, 1997a)
Conductivity EPA 120.1 (EPA, 1982)
Alkalinity SM 2320 B (Standard Method, 1997b)
Hardness SM 2340 C (Standard Method, 1997c)
Temperature ASTM E729‐96 (ASTM, 1996)
III. Short Term Studies Mortality studies were performed with 96 and 168 hours of exposure. A standard test period for many aquatic species is 96 hours (ASTM 1996). Previous toxicity testing using D. dorotocephala in this laboratory has demonstrated a pronounced increase in mortality in periods between 96 and 168 hours (H.S. Ramsdell, unpublished observations). Samples of the new exposure solution dilutions were collected and preserved once at the beginning of each study. Samples of the composited old waters were collected and preserved after each water change. When fissioning occurred during an acute study, it was recorded but no segregation of fragments was performed. Prior to the renewal of exposure solutions, mortality and morphology were recorded. Exposure solutions were renewed on the third and fifth days of seven day studies. Exposure solutions were renewed daily in four day studies. Three behavioral assessments were conducted on the final day of each test.
IV. Long Term Study A sixty day study was conducted to determine a nonlethal endpoint sensitive to cobalt exposure. Three endpoints were assessed: behavioral responses, fissioning and regeneration rates. Behavioral assessments were made every two weeks. Daily checks for fissioning events were performed and if an event had occurred, the head and the tail fragment were segregated in separate dishes. Segregated fragments were evaluated daily to see if regeneration was complete. If so, each fragment returned to the exposure dish from which the fragments had been removed. The daily checks were all made between 0700 and 1100. Mortality and morphology were recorded twice weekly prior to the renewal of the exposure solutions for the planaria in the crystallizing dishes and those that were segregated as well. Feeding occurred once a week after observations followed by the test renewal four to six hours later. Samples of the new exposure solution dilutions were collected and preserved once a week and composited old exposure solutions samples were prepared twice a week for later ICP‐AES analysis. V. Cation Studies An initial range finding study took place with just one replicate to determine the impact of calcium and magnesium concentrations on cobalt mortality. In a subsequent experiment, at a fixed concentration of 10 mg Co/L and an overall target hardness of 100 mg CaCO3/L, the calcium and magnesium ratios were varied for a seven day mortality study. Observations took place daily after the initial 48 hours and behavioral assessments occurred at test termination. Samples of the new exposure solutions were preserved once at the beginning of the study.
Composited old samples were collected when test solutions were renewed which occurred on the third and fifth day of the seven day study. VI. Analytical Chemistry Samples preserved with 1% nitric acid were analyzed using inductively coupled plasma‐atomic emission spectrometry (ICP‐AES) (Table 3.2). Blank samples and two standard concentrations per element (calcium, cobalt and magnesium) were evaluated during every analysis. Table 3.2.The settings used for the ICP‐AES ICP‐AES PerkinElmer Optima 7300 DV Forward Power 1.3 kW Plasma flow rate 15 L/min Auxiliary flow rate 0.2 L/min Nebulizer flow rate 0.8 L/min Sample flow rate 0.75 mL/min Nebulizer Meinhard concentric Spray chamber Precision cyclonic with baffle Internal Standard 10 µg/mL Yb at 0.25mL/min VII. Statistics The LC50 values from the short term studies were determined using the trimmed Spearman‐Karber Method and Probit analysis using US EPA Toxicity Data Analysis Software Version 1.5 (1994). The Probit method is used if there are two or more non‐control concentrations that have partial mortalities. The Spearman‐Karber method is used when one partial mortality exists among non‐control concentrations or when the Probit method is inappropriate due to the chi‐square value calculated by the software.
Long term data including mortality, fissioning, behavioral and regeneration, were analyzed. Proportion data were transformed using the arcsine square root for statistical tests. One way and two way ANOVAs, paired T tests and Tukey’s Method were calculated or
IV. RESULTS The results of five experiments explored the various endpoints related to cobalt toxicity. Three short term studies identified mortality‐related values as the main effect. They were conducted in two time frames: 7 days (Studies #1 and 2) and 4 days (Study #3). Study #1 had varying levels of total hardness. Studies #2 and 3 had fixed total hardness levels. Data from three behavioral assessments was evaluated also in Studies #2 and 3. One long term study, #4, identified relevant sublethal endpoints including fissioning and regeneration rates and behavioral assessments. Survival of intact worms, those that did not fission, and of the fragments, head or tail, were also evaluated. Finally, Study #5 showed the mortality that was observed when cobalt and total hardness were held at a fixed concentration but the ions comprising total hardness, calcium and magnesium, varied. 4.1 Study #1 A 7 day mortality study using D. dorotocephala was performed. The initial 96 hours of exposure resulted in no mortality but 80% mortality was observed in the highest cobalt concentration by the seventh day. No mortality occurred in the dilution water, the concentration that contained no cobalt, throughout the study. Mortality was significantly increased at concentrations of 50 mg Co/L and above (Tukey, p<0.0009) (Figure 4.1.a.). A 7 day median lethal concentration (LC50) of 50 mg Co/L was calculated for Study #1 (Trimmed Spearman‐Karber).
Based on the nominal concentrations and titration of the dilution water, the calculated total hardness range was 217‐ 323 mg CaCO3/L. The CoCl2 stock solution (made up in Type 1
water) was added to achieve the desired Co concentration. Due to the contribution of Co+2 to hardness, each level of Co exposure solution had a different total hardness (Table 4.1.a). As noted below, this could be expected to result in calculation of a higher LC50 value as a consequence of the protective effect of higher hardness. Figure 4.1.a. Mortality after the initial 96 hours and at 168 hours in Study #1 Symbols indicate the mean value of 4 replicates, each consisting of five planaria per dish. Exposure solutions were renewed on days 3 and 5. Observations were made daily after the first two days. Planaria were not fed during the study. An arcsine square root transformation was applied to the data for statistical analysis. The error bars that are displayed represent one standard deviation. The concentrations of cobalt are nominal values. a Significantly different from control, p < 0.0009 (Tukey) b Significantly different from 12, 25 and 37 mg Co/L, nominal, p <0.0009 (Tukey) 0% 25% 50% 75% 100% 0 10 20 30 40 50 60 70 Per cen t Mort ality (%) Concentra2on (mg Co/L) 96 hours 168 hours a,b a,b
Table 4.1.a. Mortality and Calculated Total Hardness, Study #1 Co (mg/L) Calculated Total Hardness (mg CaCO3/L) Percent Mortality at 96 hours Percent Mortality at 168 hours (± S.D.)a 0 217 0% 0% (± 0) 12.5 238 0% 5% (± 0.1) 25 259 0% 0% (± 0) 37.5 281 0% 10% (± 0.1) 50 302 0% 50% (± 0.2) b,c 62.5 323 0% 80% (± 0.2) b,c Calculated LC50
(95% CI d)= 50 mg Co/L (45, 56) N/A N/A
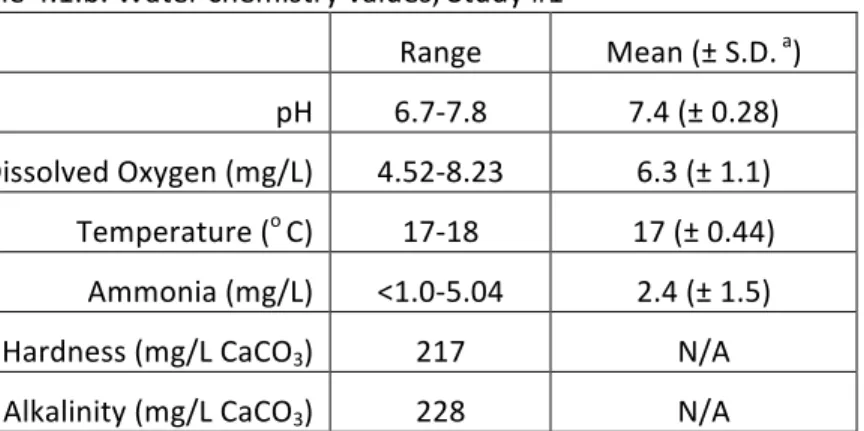
The dilution water was titrated for hardness determination once at test termination. The total hardness values for the cobalt concentrations were calculated based on the total hardness of the dilution water and the contribution from cobalt at each concentration. Percent mortality is based on a mean value of four replicates. An arcsine square root transformation was applied to the data for statistical analysis. The concentrations of cobalt are nominal values. a One standard deviation b Significantly different from the control, p<0.0009 (Tukey) c Significantly different from 12, 25 and 37 mg Co/L, nominal, p <0.0009 (Tukey) d Confidence Interval The ranges reported in Table 4.1.b. were compiled from the data of both new and old exposure solutions. The reported hardness and alkalinity concentrations were determined from titrations performed with dilution water only. The highest ammonia value, 5.04 mg/L, was noted in the composited old exposure solution of the control on the third day. On that same day, the highest dissolved oxygen and pH values of all the composited samples were also recorded in the control as well.
Table 4.1.b. Water chemistry values, Study #1
Range Mean (± S.D. a)
pH 6.7‐7.8 7.4 (± 0.28) Dissolved Oxygen (mg/L) 4.52‐8.23 6.3 (± 1.1) Temperature (o C) 17‐18 17 (± 0.44) Ammonia (mg/L) <1.0‐5.04 2.4 (± 1.5) Hardness (mg/L CaCO3) 217 N/A Alkalinity (mg/L CaCO3) 228 N/A Water chemistry values were measured in new and old exposure solutions. Mean values were computed on days 3, 5 and 7. Dissolved oxygen, pH, ammonia and temperature were recorded in the old solutions on days 3, 5 and 7. Only pH and dissolved oxygen were measured on the new solutions on day 3. Dissolved oxygen and temperature was measured on day 5. The dilution water was titrated once at test termination. The total hardness values for the cobalt concentrations were calculated based on the total hardness of the dilution water and the contribution from cobalt at each concentration. a Standard deviation
4.2 Study #2 In order to account for the influence of hardness on Co toxicity to planaria, a 7 day mortality study using D. dorotocephala was performed at three different total hardness levels. Calculated total hardness, including the contribution of Co+2, was held constant by preparing working Co+2 stock solutions in a hardness “match” water formulated with calcium and magnesium salts such that the total hardness would be at the desired level. Dilution of the hardness‐matched working stock solutions with reconstituted water with the same hardness value thus resulted in each exposure concentration having the same total hardness. Analysis of exposure solutions for Ca, Mg and Co by ICP‐AES was used to verify actual total hardness values. Mortality and median lethal concentrations (LC50) were calculated. Three different behavioral responses were also recorded. After the initial 96 hours, the highest cobalt concentration at each level of hardness resulted in approximately 50% mortality (Figure 4.2.a.). For planaria that underwent fissioning during the study, mortality was assessed based on survival of only the head fragments. Complete mortality occurred in the higher Co exposure groups by 168 hours at all three levels of hardness (Figure 4.2.b.). Hardness alone did not significantly contribute to the mortality either at 96 or 168 hours (Two‐way ANOVA, p>0.05). When the effect of the cobalt concentration was accounted for in the statistical analysis of each level of hardness, the interaction of these two factors significantly contributed to the observed mortality at 96 and 168 hours (Two‐way ANOVA, p<0.0001).
Figure 4.2.a. Mortality at 96 hours, Study #2 Observations were made daily after the initial 48 hours. Symbols represent a mean value of 4 replicates (five planaria per dish). Concentrations of calcium, magnesium and cobalt were analyzed by ICP‐AES for total hardness calculations. Planaria were fed once prior to the start of the study while they were segregated in their appropriate dilution water. An arcsine square root transformation was applied to the data for statistical analysis. The error bars that are displayed represent one standard deviation. The concentrations of cobalt are nominal values. a Significantly different from the control, p<0.0001 (Tukey) b Significantly different from all lower concentrations, p <0.002 (Tukey) c Significantly different from 12 and 18 mg Co/L, p<0.002 (Tukey) 0% 25% 50% 75% 100% 0 10 20 30 40 50 60 70 80 Per cen t Mort ality (%) Concentra2on (mg Co/L) Moderately Hard Hard Very Hard a,b a,c a,b a,b
Figure 4.2.b. Mortality at test termination (168 hours), Study #2 Observations were made daily after the initial 48 hours. Symbols represent a mean value of 4 replicates (five planaria per dish). Concentrations of calcium, magnesium and cobalt were analyzed by ICP‐AES for total hardness calculations. Planaria were fed once prior to the start of the study while they were segregated in their appropriate dilution water. An arcsine square root transformation was applied to the data for statistical analysis. The error bars that are displayed represent one standard deviation. The concentrations of cobalt are nominal values. a Significantly different from the control, p<0.001 (Tukey) b Significantly different from the lower concentrations, p <0.01 (Tukey) c Significantly different from 12 and 18 mg Co/L, p <0.0001 (Tukey) d Significantly different from 27 and 38 mg Co/L, p <0.01 (Tukey) The temporal effect at a total hardness of 180 mg CaCO3/L is shown in Figure 4.2.c. By 120 hours (five days), all planaria were dead at the highest concentration, 30 mg Co/L. At 24 mg Co/L, complete mortality required 168 hours (seven days). Time was significant (Two‐way ANOVA, p=0.008) but when cobalt concentrations were also taken into account, the interaction of time and cobalt levels had a higher level of significance with respect to mortality (Two‐way 0% 25% 50% 75% 100% 0 10 20 30 40 50 60 70 80 Per cen t Mort ality (%) Concentra2on (mg Co/L) Moderately Hard Hard Very Hard a a,b a a a,b a,d a,b a,c
Figure 4.2.c. Mortality by day at varying cobalt concentrations for hard water exposure solutions, Study #2 Observations were made daily after the initial 48 hours. Symbols represent a mean value of 4 replicates (five planaria per dish). Concentrations of calcium, magnesium and cobalt were analyzed by ICP‐AES for total hardness calculations. Planaria were fed once prior to the start of the study while they were segregated in their appropriate dilution water. An arcsine square root transformation was applied to the data for statistical analysis. Error bars that representing one standard deviation are smaller than the plot symbols. The concentrations of cobalt are nominal values. a Significantly different from the control, p<0.0001 (Tukey) b Significantly different from the lower concentrations, p <0.01 (Tukey) At the moderate level of hardness, the LC50 was 12 mg Co/L (Spearman‐Karber Method) based on the original data (no transformation). As hardness increased, the LC50 values also increased to 18 and 32 mg Co/L in hard and very hard water respectively (Spearman‐Karber and Probit, respectively) (Figure 4.2.d.). All of these concentrations were significantly different from each other because the Least Significant Difference intervals do not overlap (Table 4.2.a.) 0 25 50 75 100 1 2 3 4 5 6 7 Per cen t Mort ality (%) Day Control 12 mg Co/L 18 mg Co/L 24 mg Co/L 30 mg Co/L a a,b b
Figure 4.2.d. Cobalt toxicity (LC50) to Planaria at Different Water Hardness Levels, Study #2 Median lethal concentrations were calculated using Spearman‐Karber and Probit methods. Error bars that are displayed represent the 95% confidence intervals. a Significantly different from the other treatment groups based on LSD Intervals. Table 4.2.a. Median lethal concentrations for three nominal hardness levels, Study #2 LC50 (mg Co/L) 95% Confidence Intervals LSDa Intervals
Moderately Hard 100 mg CaCO3/L 12 (10, 14) (11, 13) Hard 180 mg CaCO3/L 18 (17, 20) (17, 19) Very Hard 320 mg CaCO3/L 32 (26, 37) (28, 36) Each level of hardness had 4 replicates, each consisting of 5 planaria per dish. Exposure solutions were changed on days 3 and 5. The planaria were not fed during this study. aLeast Significant Difference 0 5 10 15 20 25 30 35 40 45 0 50 100 150 200 250 300 350 LC 50 (mg Co/L) Water Hardness (mg CaCO3/L, nominal) a a a
Three behavioral assessments, tactile response, righting reflex response and swimming speed, were measured at test termination (168 hours) at all levels of hardness tested. One planarian was randomly selected from each surviving replicate. As the concentration of cobalt increased and more adverse effects were observed (ruffled edges, lesions, mortality etc), fewer planaria were available for these assessments. Toxicity decreased when the swimming speed was higher but increased when the time for the tactile or righting reflex responses took longer. Moderately Hard The tactile response at 3 and 12 mg Co/L were significantly different compared to the control (Tukey, p<0.05) (Figure 4.2.e.). The righting reflex response was significantly delayed at 12 mg Co/L relative to the control (Tukey, p<0.0001). Both tactile and righting reflex responses were significantly longer at 12 mg Co/L compared to 3 and 6 mg Co/L (Tukey, p<0.0001). Swimming speed was significantly reduced in a concentration‐related fashion in all of the exposure solutions with available subjects (3, 6 and 12 mg Co/L) (Tukey, p<0.0001). Hard The two timed behavioral responses were significantly affected at 12 and 18 mg Co/L relative to the control (Tukey, p<0.0008) (Figure 4.2.f.). Similar results were observed in the swimming speed as well at the same concentrations.
Very Hard The tactile and righting reflex responses were significantly different from the control (Tukey, p<0.02) (Figure 4.2.g.). The swimming speed was significantly reduced relative to the control at 27, 38 and 53 mg Co/L (Tukey, p<0.0005) due to the immobility of the planaria. Figure 4.2.e. Three behavioral assessments performed in Study #2 at nominal total hardness of 100 mg CaCO3/L (moderately hard) Symbols represent a mean value based on four replicates for all three assessments. These assessments were performed at test termination. For either of the two timed responses, values are not shown if forward mobility was not regained within the one‐minute observation time. The error bars that are displayed represent one standard deviation. The concentrations of cobalt are nominal values. a Significantly different from the control, p<0.05 (Tukey) b Significantly different from 3 and 6 mg Co/L, p <0.0001 (Tukey) 0 2 4 6 8 10 12 14 0 5 10 15 20 25 30 35 0 2 4 6 8 10 12 14 16 18 20 Number of Lines Cr ossed Time (sec) Concentra2on (mg Co/L) Tacvle Response Righvng Reflex Swim Speed a,b a a a
Figure 4.2.f. Three behavioral assessments performed in Study #2 at nominal total hardness of 180 mg CaCO3/L (hard) Symbols represent a mean value based on four replicates for the control for all three assessments, one replicate for 12 mg Co/L for all three assessments and four for 18 mg Co/L for swim speed. These assessments were performed at test termination. For either of the two timed responses, values are not shown if forward mobility was not regained within the one‐ minute observation time. The error bars that are displayed represent one standard deviation. The concentrations of cobalt are nominal values. a Significantly different from the control, p<0.002 (Tukey) 0 2 4 6 8 10 12 0 5 10 15 20 25 30 0 2 4 6 8 10 12 14 16 18 20 Number of Lines Cr ossed Time (sec) Concentra2on (mg Co/L) Tacvle Righvng Reflex Swim Speed a a a a
Figure 4.2.g. Three behavioral assessments performed in Study #2 at nominal total hardness of 320 mg CaCO3/L (very hard) Symbols represent a mean value based on four replicates for all three assessments but only one replicate for 53.6 mg Co/L. These assessments were performed at test termination. For either of the two timed responses, values are not shown if forward mobility was not regained within the one‐minute observation time. The error bars that are displayed represent one standard deviation. The concentrations of cobalt are nominal values. a Significantly different from the control, p<0.03 (Tukey) Swimming Speed: The swimming speed was analyzed for all three hardness levels because this assessment had the greatest response in all the concentrations. Hardness alone did not significantly reduce the swimming speed but Co concentration and hardness together explained the decreased response (Two‐way ANOVA, p<0.001) (Figure 4.2.h.). Every concentration of cobalt experienced a significant reduction from the control and the planarian at 12 mg 0 2 4 6 8 10 12 14 0 5 10 15 20 25 0 10 20 30 40 50 60 70 80 Number of Lines Cr ossed Time (sec) Concentra2on (mg Co/L) Tacvle Righvng Reflex Swim Speed a a
Figure 4.2.h. Swimming speed in all three levels of hardness, Study #2 Symbols represent a mean value based on four replicates but only one replicate for 53 mg Co/L. These assessments were performed at test termination. The error bars that are displayed represent one standard deviation. The concentrations of cobalt are nominal values. a Significantly different from the control, p<0.004 (Tukey) b Significantly different from 3 and 6 mg Co/L, p <0.0001 (Tukey) 0 2 4 6 8 10 12 14 0 10 20 30 40 50 60 70 80 Number of Lines Cr ossed Concentra2on (mg Co/L) Moderately Hard Hard Very Hard a a a,b a
a a a
Water chemistry values for this study are listed in Table 4.2.b. Initial titrations of the dilution and match waters were within 10% of the nominal concentrations. The measured hardness range was within 11% of the mean value. The pH, conductivity, and alkalinity increased as hardness increased. Table 4.2.b. Water chemistry values, Study #2
Moderately Hard (± S.D.Mean a) Hard (± S.D.Mean a) Very Hard (± S.D.Mean a)
pH 7.9–8.1 b (± 0.05) 8.0 8.1–8.4 (± 0.08) 8.3 8.1–8.6 (± 0.1) 8.4 Dissolved Oxygen (mg/L) 6.9–7.4 (± 0.1) 7.2 7.0–7.3 (± 0.09) 7.2 7.0–7.4 (± 0.09) 7.2 Temperature (oC) 18–19 (± 0.4) 18.2 18–19 (± 0.4) 18.1 18–20 (± 0.4) 18.8 Conductivity (µS) 331–360 (± 7.6) 342 561–591 (± 8.2) 574 811–995 (± 46) 910 Ammonia (mg/L) <1.0–1.28 (± 0.09) 1.0 <1.0–1.10 (± 0.03) <1.0–1.06 1.0 (± 0.02) 1.0 Hardness (mg/L CaCO3) 99–108 102 (± 1.3) 170–187 (± 3.3) 175 218–276 (± 12) 245 Alkalinity
(mg/L CaCO3) 64 N/A 113 N/A 222 N/A
Water chemistry values were measured in new and old exposure solutions collected when the exposure solutions were changed on days 3, 5 and 7 (test termination). The dilution water was titrated once at test termination. Concentrations of calcium, magnesium and cobalt were analyzed by ICP‐AES for total hardness calculations. Planaria were not fed during the study. a Standard deviation b Range of observed values.
The 7 day median lethal concentration of 50 mg Co/L calculated for Study #1 was significantly different from the LC50 values determined in Study #2 (Table 4.2.c.). The Least Significant Difference intervals did not overlap with any of those observed in Study #2. Table 4.2.c. Median lethal concentrations from Study #1 and #2
LC50 (mg Co/L) 95% Confidence Intervals LSDa Intervals
Study #1 50 (44, 56) (46, 54) Study #2 100 mg CaCO3/L 12 (10, 14) (11, 13) Study #2 180 mg CaCO3/L 18 (17, 20) (17, 19) Study #2 320 mg CaCO3/L 32 (26, 37) (28, 36) Median lethal concentrations were calculated using Spearman‐Karber and Probit analysis. The LSD intervals were calculated based on the 95% confidence intervals. aLeast Significant Difference
4.3 Study #3 Another mortality study was performed at the standard acute aquatic testing duration of 96 hours (ASTM 2007) using higher cobalt concentration ranges to achieve a greater level of mortality at the earlier time point. The hardness contribution of cobalt was accounted for in this study as well. Mortality and median lethal concentrations (LC50) were calculated and three behavioral responses were recorded as in Study #2. Median lethal concentrations were calculated for each total hardness level. At a moderate level of hardness, the LC50 was 28 mg Co/L (Probit). As hardness increased, the 96 hour LC50 values also increased to 48 and 70 mg Co/L in hard and very hard water, respectively (Spearman‐Karber and Probit, respectively) (Figure 4.3.a.). Two different statistical methods were used because there were two patterns of mortality. The Probit method is used if there are two or more non‐control concentrations that have partial mortalities. The Spearman‐Karber method is used when only one non‐control concentration has a partial mortality or when the Probit method is inappropriate due to the calculated chi‐square value. Based on the Least Significant Difference (LSD) intervals, these three LC50 values are all significantly different from each other (Table 4.3.a.). They are all also significantly different from their respective 168 hour LC50 values calculated in Study #2 (Figure 4.3.b.).
Figure 4.3.a. Median lethal cobalt concentrations to planaria at different water hardness levels, Study #3 Each level of hardness had 4 replicates, each consisting of 5 planaria per dish. Exposure solutions were changed daily after observations. The planaria were not fed during this study and were segregated in their corresponding dilution water 7 days prior to the start of the study. Spearman‐Karber and Probit analysis yielded these median lethal concentrations. The error bars that are displayed represent the 95% confidence intervals. a Significantly different from the other treatment groups based on LSD Intervals. R² = 0.9817 0 10 20 30 40 50 60 70 80 0 50 100 150 200 250 300 350 LC50 (mg Co/L) Water Hardness (mg CaCO3/L, nominal) a a a