This is an author produced version of a paper published in Journal of
biological inorganic chemistry : JBIC. This paper has been peer-reviewed but
does not include the final publisher proof-corrections or journal pagination.
Citation for the published paper:
Di Bari, Chiara; Mano, Nicolas; Shleev, Sergey; Pita, Marcos; De Lacey,
Antonio. (2017). Halides inhibition of multicopper oxidases studied by FTIR
spectroelectrochemistry using azide as an active infrared probe. Journal of
biological inorganic chemistry : JBIC, vol. 22, issue 8, p. null
URL: https://doi.org/10.1007/s00775-017-1494-8
Publisher: Springer
This document has been downloaded from MUEP (https://muep.mah.se) /
DIVA (https://mau.diva-portal.org).
ORIGINAL PAPER
Halides inhibition of multicopper oxidases studied by FTIR
spectroelectrochemistry using azide as an active infrared probe
Chiara Di Bari1 · Nicolas Mano2 · Sergey Shleev3 · Marcos Pita1 ·
Antonio L. De Lacey1
Received: 24 April 2017 / Accepted: 19 September 2017 / Published online: 3 October 2017 © SBIC 2017
Keywords Multicopper oxidase · Infrared · Halide
inhibition · Spectroelectrochemistry
Introduction
Multicopper oxidases (MCOs), such as laccase (Lc) or bili-rubin oxidase (BOx), are proteins typically incorporating four redox-active Cu ions, which are classified by optical and magnetic properties as either a type 1 (T1) copper ion, or a trinuclear copper cluster (TNC) formed by one type 2 (T2) copper and two type 3 (T3) copper ions. While accepting electrons one-by-one from the substrate, the T1 site gives rise to a distinct EPR signal, and electrons are subsequently transferred to the TNC, where dioxygen reduction finally takes place. An intramolecular electron pathway formed by one cysteine and two histidine residues connects the T1 site and TNC. There are also channels for O2 and H2O transport between the protein surface and the TNC. The T2 copper ion is EPR active, as opposite to the two T3 Cu ions [1, 2]. MCOs are inhibited in the presence of inorganic anions, such as cyanide, azide, halides, and hydroxyls, among oth-ers [3, 4]. Many different studies have been conducted to understand the different mechanisms behind the inhibition processes. In particular, thanks to the magnetic properties of the copper cations at the active site, numerous electron paramagnetic resonance (EPR) studies have been carried out. These studies have shown how N3− binds to the TNC,
blocking the catalytic process by the formation of a bridg-ing bond between the T2 Cu ion and one of the T3 ions. It has also been suggested that a second N3− may also bind
the TNC, leading to a di-azide bound form [5, 6]. These EPR results have been corroborated by other spectroscopy techniques, such as infrared spectroscopy (FTIR) among others, where asymmetric intra-azide stretching bands were
Abstract An infrared spectroelectrochemical study of Trametes hirsuta laccase and Magnaporthe oryzae
biliru-bin oxidase has been performed using azide, an inhibitor of multicopper oxidases, as an active infrared probe incor-porated into the T2/T3 copper cluster of the enzymes. The redox potential-controlled measurements indicate that N3−
stretching IR bands of azide ion bound to the T2/T3 cluster are only detected for the oxidized enzymes, confirming that azide only binds to Cu2+. Moreover, the process of
bind-ing/dissociation of azide ion is shown to be reversible. The interaction of halide anions, which also inhibit multicopper oxidases, with the active site of the enzymes was studied by measuring the changes in the azide FTIR bands. Enzymes inhibited by azide respond differently upon addition of flu-oride or chlflu-oride ions to the sample solution inhibited by azide. Fluoride ions compete with azide for binding at one of the T2/T3 Cu ions, whereas competition from chloride ions is much less evident.
Electronic supplementary material The online version of this article (doi:10.1007/s00775-017-1494-8) contains supplementary material, which is available to authorized users.
* Chiara Di Bari cdi.bari@csic.es * Antonio L. De Lacey alopez@icp.csic.es
1 Instituto de Catálisis y Petroleoquímica, CSIC, c/Marie Curie 2, L10, 28049 Madrid, Spain
2 Centre de Recherche Paul Pascal, Université de Bordeaux, UPR 8641, CNRS, Avenue Albert Schweitzer, 33600 Pessac, France
3 Biomedical Sciences, Faculty of Health and Society, Malmo University, 0205 06 Malmö, Sweden
1 3
observed at 2035 or 2056 cm−1 after incubation of Lc with
the inhibitor [7, 8].
The inhibition mechanism by halide anions has been intensely studied [9–12], as it is relevant for applications of MCO-based systems such as biosensors or biofuel cells operating in physiological media [13], or for bioremediation [14, 15]. Early EPR investigations showed that fluoride inter-acts mainly with the TNC, most likely by bridging the type 2 and one of the type 3 Cu2+ [16]. Moreover, N
3−/F−
competi-tion EPR experimental reports have shown that F− probably
does not bind to the T2 Cu2+ in the presence of a reduced
T3 Cu1+, suggesting that F− interacts only with an oxidized
T3 Cu2+ [1]. It is assumed that binding of the F− to the TNC
interrupts intramolecular electron transfer (IET) from the T1 site, thus abolishing completely the oxygen reduction ability of Lcs [9–12].
More controversial is the inhibition mechanism by chlo-ride. Xu proposed that halides larger than fluoride were unable to reach the TNC site due to the size of Lcs’ putative access channel for the substrate, thus explaining the decreas-ing inhibition power in the order F− > Cl− > I− [11]. Naki
et al. reported a kinetic study of Polyporus versicolor Lc showing that Cl− was a competitive inhibitor with respect
to the electron donor substrate (ferrocyanide), thus suggest-ing that the Cl− was binding to or near the T1 site [10].
Furthermore, bioelectrocatalytic studies of Lcs have shown that direct electron transfer (DET) from the electrode to the enzyme is much less affected by Cl− than the mediated
electron transfer (MET) using different substrates, whereas F− blocks both electron transfer modes [17–20]. This result
was explained by considering that Cl− binds near the
sub-strate binding site, precluding T1 reduction by the subsub-strate but not electron transfer from the electrode. Instead, F− binds
at a site of the enzyme where IET in the Lc is impeded, thus affecting both DET and MET electrocatalysis [17]. On the other hand, in the crystal structure of Melanocarpus
albomyces laccase a putative chloride is coordinated to the
T2 copper [21]. More recently, from a steady-state kinetic analysis of Trametes versicolor Lc with different substrates, a two-site model of Lc inhibition by Cl− has been proposed
instead of a single Cl− binding to each enzyme molecule
[12].
Additional spectroscopic studies are required for clari-fying the inhibition modes of MCOs by halides. FTIR is a powerful analytical tool for studying structure–function relationships in metalloenzymes [22, 23]. However, a direct FTIR study of inhibition by halides is not possible as the stretching modes of Cu-halides are not detectable. Alter-natively, the aim of this work is to verify the hypothesis of halides coordination to the MCO active site by spectroelec-trochemistry using N3− as active FTIR probe. As mentioned
before, FTIR studies of the inhibition of MCOs by N3− have
been done previously, although not under in situ redox potential control nor in the presence of halide inhibitors. Two different MCOs were employed in the present study:
Magnaporthe oryzae BOx and T. hirsuta Lc, to provide a
broader view of the different inhibition events when azide, F− or Cl− ions interact with these types of metalloenzymes.
Scheme 1 shows the proposed binding sites of these inhibi-tors to MCOs based on the literature cited above and on the results obtained in the present work.
Materials and methods
Chemicals
All chemicals used were analytical grade and were used as purchased. 2,2′-Azino-bis-(3-ethylbenzothiazoline-6-sul-fonic acid) diammonium salt (ABTS), sodium fluoride, 2,2,6,6-tetramethyl-1-piperidinyloxy (TEMPO), quinhy-drone, 2,6-dimethoxyphenol (DMP) and sodium azide were
purchased from Sigma. Sodium chloride, potassium chlo-ride, di-sodium hydrogen phosphate and sodium di-hydro-gen phosphate were purchased from Panreac. All aqueous solutions were prepared in deionized water (Milli-Q grade, Millipore).
Enzymes
Trametes hirsuta Lc from basidiomycete (strain T. hirsuta
56) was obtained from the laboratory collection of the Mos-cow State University of Engineering Ecology following the purification procedure previously reported [24].
Magnaporthe oryzae BOx from the Centre de Recherche
Paul Pascal (Université de Bordeaux) was produced and purified as reported in the literature [25].
FTIR spectroelectrochemistry
Fourier transform infrared (FTIR) spectroscopy was per-formed with a Bruker Tensor 27 spectrometer equipped with a globar IR source, a MCT detector cooled by liquid N2 and a Whatman purge gas generator for removal of CO2 and
H2O. The FTIR spectroelectrochemical cell was designed
by Moss et al. [26]. For every measurement, 1024 scans were recorded with a resolution of 2 cm−1. Background
subtraction and baseline correction of the recorded spectra were done using OPUS software from Bruker. For FTIR measurements, an aliquot of purified Lc (5.8 mg mL−1)
was concentrated to 29.0 mg mL−1 by ultrafiltration using a
Centricon-30 (Amicon), while the BOx aliquot was used as received, i.e., 68.7 mg mL−1.
Previous to the FTIR measurements, the enzymes were incubated overnight with a solution of NaN3 (1:2 enzyme:inhibitor ratio) in phosphate buffer of 20 mM, pH 6.0 at 4 °C. When required, NaF or NaCl at a final con-centration of 30 mM were added to the sample solution for 15 min at 4 °C before the FTIR measurements. 10 μL of the enzyme solution and 1 μL of a mixture of redox mediators, each 0.5 mM, were placed between the CaF2 windows of
the spectroelectrochemical cell, forming a thin layer film of 10 µm [26]. The redox mediators employed were ABTS, quinhydrone, DMP, and TEMPO with redox potentials equal to 690, 345, 640, and 735 mV vs. NHE at pH 6, respectively [27–29]. 0.2 M KCl was injected as electrolyte in the space that surrounded the CaF2 windows of the spectroelectro-chemical cell until it was filled, yielding electrical contact between the working, counter and reference electrodes. The strong capillary forces within the thin layer enzyme sample sandwiched between the CaF2 windows and the small con-tact surface with the surrounding electrolyte prevent bulk mixing; therefore, the mass transfer between the sample and the external electrolyte during the experiments is negligi-ble [26]. Different FTIR spectra were recorded in the range
of 0–650 mV vs. Ag/AgCl (3 M Cl−); the redox potential
of the cell was controlled by a BAS CV-27 potentiostat and measured with a Fluke 77 serie II multimeter. Before each spectrum acquisition, the sample was biased with the selected potential for at least 15 min to ensure that redox equilibrium was achieved. For better comparison with the literature values, all redox potentials mentioned in the text and in the figures are set vs. NHE. The temperature of the cell was maintained at 25 °C with a Julabo CC 230 thermo-stat. A spectrum of phosphate buffer sample was recorded as the background.
Peak fitting and deconvolution was carried out using the OriginPro 8.0 software with a Gaussian fit in the 2100–2000 cm−1 region. The peak wavenumber of the
deconvoluted bands were not fixed nor their width, although negative bands were precluded. The fittings converged when a χ2 tolerance value of 10−6 was reached.
Results and discussion
FTIR measurements of azido-inhibited MCOs required a careful addition of N3− since an excess of free ions in
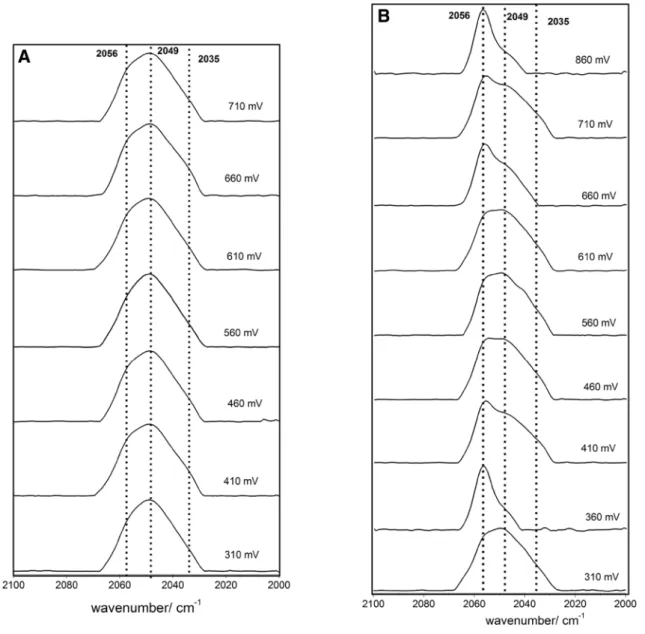
solu-tion influences the spectrum by masking the band of bound azide [7, 8]. Removal of the excess azide in solution by ultra-filtration before the FTIR measurement caused the loss of all azide bands (free or bound to MCO) and 84% recovery of the enzymatic activity (Fig. S1), confirming that azide-binding to MCOs is a reversible process. Best FTIR results were obtained with samples that had a 1:2 enzyme:azide ratio. The FTIR spectra for the MCOs after overnight azide incubation samples were investigated under redox potential control. The spectra recorded from higher to lower poten-tial for a BOx-N3 sample in the range between 2100 and
2000 cm−1 indicated the presence of at least two peaks
cen-tered at 2056 and 2049 cm−1 (Fig. 1). Previously published
FTIR reports assign these two bands to N3− bound to the
TNC in a bridging mode between two Cu ions and to free azide, respectively [7, 8]. When the enzyme was in its rest-ing state, correspondrest-ing to the open circuit potential (OCP) measurement at + 510 mV, these two bands overlap. Upon reduction, the potential to + 310 mV the band at 2056 cm−1
decreases intensity and the one at 2049 cm−1 predominates.
After reoxidizing the sample at potentials above + 600 mV, the 2049 cm−1 peak decreases in intensity, while the peak at
2056 cm−1 reappears. At + 860 mV, the band
correspond-ing to free azide has almost disappeared and the main band is the 2056 cm−1 one. At this potential, all Cu atoms of the
enzyme should be oxidized [1, 2]. The redox potential of the T1 Cu of BOxs is within the + 650 to 720 mV range [30, 31], whereas that of the T2 Cu is around 400 mV [30]. Based on the redox titrations of T3 Cu sites of different MCOs [32], it is reasonable to assume that the redox potential of
1 3
the T3 Cu site of BOx is close to 700 mV. Therefore, the FTIR spectroelectrochemical results clearly indicate that azide only binds to the oxidized Cu2+ of the TNC, in
agree-ment with previous results reported in the literature regard-ing Cu complexes with azide ligands [33, 34]. The process of binding/dissociation of N3− was reversible, although the
kinetics became more sluggish with time because when the sample was reduced again at + 410 mV the amount of bound azide detected was higher than in the initial resting state at + 510 mV.
It was observed, in this experiment and all others done, that the overall intensity of the N3− infrared bands decreased
with time and independently of the applied potential. This effect could be due to the lack of stability of the enzyme or the N3− under the experimental conditions. Therefore, all
spectra shown have been normalized so that the intensity
of the most intense peak of each spectrum is equal. As a control, FTIR spectra at different potential were recorded for a sample of 2.6 mM NaN3 in 100 mM of phosphate buffer
pH 6.0, without enzyme. The presence of a single peak at 2049 cm−1, corresponding to free N
3−, at every potential
is evident (Fig. 2). The only effect noticed was the peak intensity reduction with time, confirming the degradation of N3− under the measurement conditions. A small peak at ca.
2030 cm−1 was detected, which was also observed in some
of the spectra recorded with BOx (Fig. 1).
FTIR measurements were performed also for a Lc-N3− sample, under the same conditions. In that case, free
N3− and azide-bound signals are still appreciable, although
not as distinct as in the case of BOx due to bands broad-ening and overlapping (Supporting Information Fig. S2A). This effect suggests a higher conformational freedom of the bound azide in the case of laccases. By deconvolution of the overlapped bands using a fitting model based on a Gaussian function it was possible to determine that the 2056 cm−1
band is only detected clearly as a shoulder at + 860 mV. (Supporting Information Fig. S6). The band at 2049 cm−1 Fig. 1 FTIR spectra of BOx-N3 sample recorded at different redox
potentials vs. NHE. The intensity of each spectrum has been normal-ized
Fig. 2 FTIR spectra of NaN3 sample recorded at different redox potentials vs. NHE. The intensity of each spectrum has been normal-ized
was predominant over the entire potential range, suggesting that the affinity of N3− for the TNC of Lc is lower than for
the BOx one. On the one hand, although Lc has a higher T1 Cu (+ 780 mV) redox potential than BOx, the redox poten-tial of the T2 Cu is around + 400 mV for both enzyme [30, 35]. Thus, one cannot attribute the lower azide affinity to a difference in the redox potentials of the T2 Cu site of these oxidoreductases. On the other hand, because of ca., 100 mV differences between redox potentials of the T1 (and possibly T3 as well) Cu sites, the redox potential of the TNC might be higher in the case of Lc compared to BOx. Thus, the apparent lower affinity of azide for Lc could also be attrib-uted to a high redox potential of the enzyme, resulting in an incomplete protein oxidation at 860 mV.
There are three possible N3− binding geometries to
Cu–Cu structures: (i) terminal coordination [34], (ii) μ-1,3-bridge between the two Cu ions [33] or (iii) μ-1-1 bridged coordination. (i) and (ii) gave υ−
(N3)asym
frequen-cies < 2060 cm−1, whereas υ−
(N3)asym > 2060 cm−1 were
measured for (iii) [2]. Our results are in agreement with pre-vious FTIR studies [7, 8], indicating that the possible bind-ing geometries are the first two. Moreover, from EPR and UV–Vis spectral studies, it has been proposed that N3− binds
in a bridging mode between T2 Cu ion and one of the T3 Cu ions [6, 36].
The effect of NaF or NaCl addition to enzyme-N3−
sam-ples before introduction to the spectroelectrochemical cell was studied to (1) evaluate if halide ions could displace the
Fig. 3 FTIR spectra for a BOx-N3-F and b BOx-N3-Cl sample recorded at different redox potentials vs. NHE. The intensity of each spectrum has been normalized. The chronological order of spectra measurements in (b) was: 460, 610, 310, 560, 710, 410, 660, 860 and 360 mV
1 3
binding of N3− to the TNC and if so, (2) infer the binding
sites of halide inhibitors to MCOs. Figure 3a shows the spec-tra recorded at different potentials for the BOx-N3 sample
after the addition of F−. The predominant peak is centered
at 2049 cm−1, which is attributed to free azide. The spectra
were practically insensitive to the applied potential and the peak at 2056 cm−1 barely appears as a shoulder. Therefore,
in the case of F−, we can conclude that the ions bind to
the TNC or very close to it, mostly displacing the bound N3− and thus only the free azide band is clearly observed in
the recorded spectra. There are two possible explanations for this result, viz. either the F− binds to one of the TNC Cu
ions to which N3− binds or there is electrostatic repulsion
of the negatively charged N3− due to the F− bound near the
cluster. The weak intensity of the 2056 cm−1 band present in
all the spectra suggests that a minor proportion of the BOx molecules still retain the azide bound to the TNC. However, the fact that this band is insensitive to the applied potential suggests that F− is also bound to the TNC, as this
inhibi-tor blocks the intramolecular electron transport pathway of MCOs [9–12].
Interestingly, measurement of BOx-N3 sample incubated
in the presence of Cl− ions yielded FTIR results markedly
different from the F− incubation (Fig. 3b). The peak at
2056 cm−1 clearly appeared at an applied potential above
+ 660 mV; the peak at 2049 cm−1 almost disappeared at
+ 860 mV, whereas it increases at reductive potentials. The exception observed for the measurement at + 360 mV could be attributed to a decrease of the reversibility over time or to the low stability of free azide, as this was the last spectrum recorded for this experiment. Based on these results it could be concluded that F− competes with N
3− for the same
BOx-binding site, while for Cl− it is much less evident.
The same experiments in the presence of halides have been performed for the Lc-N3 samples. It could be again observed that F− ions compete with N
3− to bind to the
TNC as the only peak observed is the one of free azide at 2049 cm−1 (Supporting Information Fig. S2B). The
addi-tion of Cl− ions to Lc-N
3 sample resulted in the detection
of the 2056 cm−1 band only at + 860 and + 710 mV, which
was drastically reduced or even disappeared after applying reductive potentials (Supporting Fig. S2C).
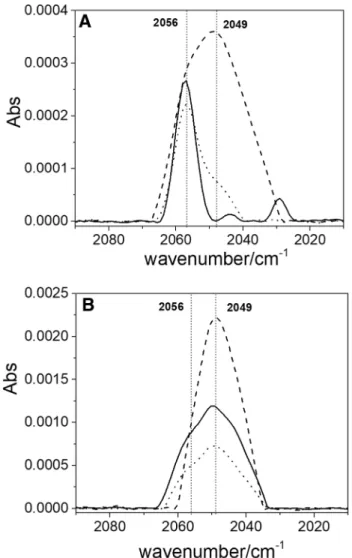
Fig. 4 FTIR spectra recorded at + 860 mV vs. NHE for a BOx and b Lc samples when incubated with only azide (solid line) or with azide–fluoride ions (dashed line) or with azide–chloride ions (dotted line)
Fig. 5 FTIR spectra for Lc-N3, Lc-N3-F and Lc-N3-Cl samples recorded at + 860 mV vs. NHE. In each spectrum the black line rep-resents the experimental data, the hatched gray lines are the
deconvo-luted bands, and the red ones are the total curve obtained by the sum of each component
To have a clearer picture of the results obtained for both enzymes with or without halides, in Fig. 4 the spec-tra recorded at oxidizing conditions for BOx (A) and Lc (B) are presented. A clear difference in each spectrum is observed depending on the presence/absence of either F− or
Cl− besides N
3−. For BOx, the peak at 2056 cm−1 of bound
azide is clearly predominant when N3− ions only are present,
but when F− ions are added only the 2049 cm−1 peak of free
azide appears. When Cl− ions were included, the
predomi-nant band is the 2056 cm−1 band, although the 2049 cm−1
can be still detected with much lower intensity. In the case of Lc, when only N3− was present or when Cl− was also
present, it is difficult to discern the presence of two distinct bands without further data elaboration.
For this reason, it was necessary to carry out deconvolu-tion using a fitting model based on a Gaussian funcdeconvolu-tion. The results obtained after deconvolution for the spectra reported in Fig. 4b are shown in Fig. 5. The deconvolution allows visualizing the peak at 2056 cm−1 for the Lc-N
3 sample and
its absence when F− was added. In the case of Lc-N 3-Cl
sample, the 2056/2049 peak intensity ratio hardly changes compared to the Lc-N3. The deconvoluted band observed at
2040 cm−1 could correspond to azide attached to the T2/T3
site with a different binding mode [8].
In all the spectra recorded, the resolution of the peaks was not optimal and for this reason deconvolution of the peaks was made for each spectrum for both enzymes (Sup-porting Information Figs. S3–S8). From this data elabora-tion, the presence of only two bands for the BOx-N3 sample could be confirmed (Supporting Information Fig. S3). A third weak band around 2035 cm−1 is also observed for the
BOx-N3-F sample (Supporting Information Fig. S4), that has also been attributed to bound azide [8]. The presence of this third peak was also observed for the Lc-N3 sample
(Supporting Information Fig. S6). The deconvolution pro-cess suggests that BOx is less inhibited by Cl− than Lc,
confirming previous work [4]. Indeed, for the BOx-N3-Cl sample (Supporting Information Fig. S5) the contribution of the band attributed to free azide (2049 cm−1) to the FTIR
spectrum is lower when compared to that for the Lc-N3-Cl sample (Supporting Information Fig. S8), suggesting that Cl− interaction is more pronounced with the TNC of Lc
than with the TNC of BOx. Therefore, a double site bind-ing process cannot be excluded in laccases [12], in which Cl− may bind in some enzyme molecules to or near the
TNC site in addition to the T1 pocket binding without dis-placing completely the bound azide (Scheme 1).
Conclusions
Different behavior is observed upon addition of fluoride or chloride ions to the sample solution for both MCOs tested
using azide as an infrared probe. Fluoride ions compete with azide for binding at one of the T2/T3 Cu ions, whereas chloride ions hardly do (Scheme 1). Our results are in agree-ment with electrocatalytical data reported in the literature [17–20]. Indeed, it has been shown that in all likelihood, F− ions interact with the TNC of MCO blocking IET from
the T1 site to the Cu cluster [9–12], which could explain why in Lc- or BOx-based biocathodes both DET and MET processes are inhibited after F− addition [17–20]. Addition
of Cl−, however, predominantly suppresses MET but not
DET, suggesting that chloride anions, being larger than fluo-ride ions, block the access of an electron donor to the T1 site, rather than binding to the TNC (Scheme 1) [9, 11, 17]. However, in the case of laccases a double site binding pro-cess cannot be excluded from the FTIR results of the present work, in which the chloride would be placed near the T2 site without displacing completely the bound azide.
Supporting information Figures S1–S8 containing
addi-tional FTIR spectra are presented as Supporting Information.
Acknowledgements This project has received funding from the European Union’s Seventh Framework Programme for research, tech-nological development and demonstration under Grant agreement BIO-ENERGY FP7-PEOPLE-2013-607793.
References
1. Quintanar L, Yoon J, Aznar CP, Palmer AE, Andersson KK, Britt RD, Solomon EI (2005) J Am Chem Soc 127:13832–13845 2. Quintanar L, Stoj C, Taylor AB, Hart PJ, Kosman DJ, Solomon
EI (2007) Acc Chem Res 40:445–452
3. Baldrian P (2006) FEMS Microbiol Rev 30:215–242 4. Mano N (2012) Appl Microbiol Biotechnol 96:301–307 5. Cole JL, Clark PA, Solomon EI (1990) J Am Chem Soc
112:9534–9548
6. Peyratout CS, Severns JC, Holm SR, McMillin DR (1994) Arch Biochem Biophys 314:405–411
7. Sakurai T, Takahasi J, Huang HW (1996) Chem Lett 25:651–652 8. Hirota S, Matsumoto H, Huang HW, Sakurai T, Kitagawa T,
Yamauchi O (1998) Biochem Biophys Res Commun 243:435–437 9. Naki A, Varfolomeev SD (1980) FEBS Lett 113:157–160 10. Naki A, Varfolomeev SD (1981) Biochemistry (Moscow)
46:1344–1350
11. Xu F (1996) Biochemistry 35:7608–7614
12. Champagne PP, Nesheim ME, Ramsay JA (2013) Appl Microbiol Biotechnol 97:6263–6269
13. Falk M, Alcalde M, Bartlett PN, De Lacey AL, Gorton L, Gutier-rez-Sanchez C, Haddad R, Kilburn J, Leech D, Ludwig R, Magner E, Mate DM, O’Conghaile P, Ortiz R, Pita M, Poller S, Ruzgas T, Salaj-Kosla U, Schuhmann W, Sebelius F, Shao M, Stoica L, Sygmund C, Tilly J, Toscano MD, Vivekananthan J, Wright E, Shleev S (2014) PLoS One 9:e109104
14. Liu Y, Dong S (2008) Electroanalysis 20:827–832
15. Enaud E, Trovaslet M, Naveau F, Decristoforo A, Bizet S, Van-hulle S, Jolivalt C (2011) Enzyme Microb Technol 49:517–525 16. Malkin R, Malmström RG, Vänngård T (1968) FEBS Lett 1:50–54
1 3
17. Vaz-Domínguez C, Campuzano S, Rüdiger O, Pita M, Gorbacheva M, Shleev S, Fernández VM, De Lacey AL (2008) Biosens Bio-electron 24:531–537
18. Beyl Y, Guschin DA, Shleev S, Schuhmann W (2011) Electro-chem Commun 13:474–476
19. Salaj-Kosla U, Pöller S, Schuhmann W, Shleev S, Magner E (2013) Bioelectrochemistry 91:15–20
20. Tominaga M, Sasaki A, Togami M (2016) Electrochemistry 84:315–318
21. Hakulinen N, Andberg M, Kallio J, Koivula A, Kruus K, Rou-vinen J (2008) J Struct Biol 162:29–39
22. Wharton CW (1986) Biochem J 233:26–36
23. Gutiérrez-Sanz O, Rüdiger O, De Lacey AL (2014) In: Fontecilla-Camps JC, Nicolet Y (eds) Metalloproteins: methods and proto-cols. Methods in Molecular Biology, 1st edn. Springer, New York 24. Shleev SV, Morozova OV, Nikitina OV, Gorshina ES, Rusinova
TV, Serezhenkov VA, Burbaev DS, Gazaryan IG, Yaropolov AI (2004) Biochimie 86:693–703
25. Durand F, Gounel S, Kjaergaard CH, Solomon EI, Mano N (2012) Appl Microbiol Biotechnol 96:1489–1498
26. Moss D, Nabedryk E, Breton J, Mantele W (1990) Eur J Biochem 187:565–572
27. Fabbrini M, Galli C, Gentili P (2002) J Mol Catal B Enzym 16:231–240
28. Jovanovic SV, Tosic M, Simic MG (1991) J Phys Chem 95:10824–10827
29. Kulys J, Vidziunaite R (2005) J Mol Catal B Enzyme 37:79–83 30. Christenson A, Shleev S, Mano N, Heller A, Gorton L (2006)
Biochim Biophys Acta 1757:1634–1641
31. Tsujimura S, Kuriyama A, Fujieda N, Kano K, Ikeda T (2005) Anal Biochem 337:325–331
32. Reinhammar B (1972) Biochim Biophys Acta 275:245–259 33. Sorrell TN, O’Connor CJ, Anderson OP, Reibenspies JH (1985)
J Am Chem Soc 107:4199–4206
34. Karlin KD, Cohen BI, Hayes JC, Farooq A, Zubieta J (1987) Inorg Chem 26:147–153
35. Shleev S, Christenson A, Serezhenkov V, Burbaev D, Yaropolov A, Gorton L, Ruzgas T (2005) Biochem J 385:745–754
36. Cole JL, Avigliano L, Morpurgo L, Solomon EI (1991) J Am Chem Soc 113:9080–9089