This is the published version of a paper published in The Lancet.
Citation for the original published paper (version of record):
Barber, R M., Fullman, N., Sorensen, R J., Bollyky, T., McKee, M. et al. (2017)
Healthcare Access and Quality Index based on mortality from causes amenable to personal
health care in 195 countries and territories, 1990–2015: a novel analysis from the Global Burden
of Disease Study 2015.
The Lancet, 390(10091): 231-266
https://doi.org/10.1016/ S0140-6736(17)30818-8
Access to the published version may require subscription.
N.B. When citing this work, cite the original published paper.
Permanent link to this version:
territories, 1990–2015: a novel analysis from the Global
Burden of Disease Study 2015
GBD 2015 Healthcare Access and Quality Collaborators*
Summary
Background
National levels of personal health-care access and quality can be approximated by measuring mortality
rates from causes that should not be fatal in the presence of effective medical care (ie, amenable mortality). Previous
analyses of mortality amenable to health care only focused on high-income countries and faced several methodological
challenges. In the present analysis, we use the highly standardised cause of death and risk factor estimates generated
through the Global Burden of Diseases, Injuries, and Risk Factors Study (GBD) to improve and expand the
quantification of personal health-care access and quality for 195 countries and territories from 1990 to 2015.
Methods
We mapped the most widely used list of causes amenable to personal health care developed by Nolte and
McKee to 32 GBD causes. We accounted for variations in cause of death certification and misclassifications
through the extensive data standardisation processes and redistribution algorithms developed for GBD. To isolate
the effects of personal health-care access and quality, we risk-standardised cause-specific mortality rates for each
geography-year by removing the joint effects of local environmental and behavioural risks, and adding back the
global levels of risk exposure as estimated for GBD 2015. We employed principal component analysis to create a
single, interpretable summary measure–the Healthcare Quality and Access (HAQ) Index–on a scale of 0 to 100.
The HAQ Index showed strong convergence validity as compared with other health-system indicators, including
health expenditure per capita (r=0·88), an index of 11 universal health coverage interventions (r=0·83), and human
resources for health per 1000 (r=0·77). We used free disposal hull analysis with bootstrapping to produce a frontier
based on the relationship between the HAQ Index and the Socio-demographic Index (SDI), a measure of overall
development consisting of income per capita, average years of education, and total fertility rates. This frontier
allowed us to better quantify the maximum levels of personal health-care access and quality achieved across the
development spectrum, and pinpoint geographies where gaps between observed and potential levels have
narrowed or widened over time.
Findings
Between 1990 and 2015, nearly all countries and territories saw their HAQ Index values improve;
nonetheless, the difference between the highest and lowest observed HAQ Index was larger in 2015 than in 1990,
ranging from 28·6 to 94·6. Of 195 geographies, 167 had statistically significant increases in HAQ Index levels
since 1990, with South Korea, Turkey, Peru, China, and the Maldives recording among the largest gains by 2015.
Performance on the HAQ Index and individual causes showed distinct patterns by region and level of development,
yet substantial heterogeneities emerged for several causes, including cancers in highest-SDI countries; chronic
kidney disease, diabetes, diarrhoeal diseases, and lower respiratory infections among middle-SDI countries; and
measles and tetanus among lowest-SDI countries. While the global HAQ Index average rose from 40·7
(95% uncertainty interval, 39·0–42·8) in 1990 to 53·7 (52·2–55·4) in 2015, far less progress occurred in narrowing
the gap between observed HAQ Index values and maximum levels achieved; at the global level, the difference
between the observed and frontier HAQ Index only decreased from 21·2 in 1990 to 20·1 in 2015. If every country
and territory had achieved the highest observed HAQ Index by their corresponding level of SDI, the global average
would have been 73·8 in 2015. Several countries, particularly in eastern and western sub-Saharan Africa, reached
HAQ Index values similar to or beyond their development levels, whereas others, namely in southern sub-Saharan
Africa, the Middle East, and south Asia, lagged behind what geographies of similar development attained between
1990 and 2015.
Interpretation
This novel extension of the GBD Study shows the untapped potential for personal health-care access and
quality improvement across the development spectrum. Amid substantive advances in personal health care at the
national level, heterogeneous patterns for individual causes in given countries or territories suggest that few places
have consistently achieved optimal health-care access and quality across health-system functions and therapeutic
areas. This is especially evident in middle-SDI countries, many of which have recently undergone or are currently
experiencing epidemiological transitions. The HAQ Index, if paired with other measures of health-system
Lancet 2017; 390: 231–66
Published Online May 18, 2017 http://dx.doi.org/10.1016/ S0140-6736(17)30818-8 See Comment page 205 *Collaborators listed at the end of the Article
Correspondence to: Prof Christopher J L Murray, Institute for Health Metrics and Evaluation, University of Washington, 2301 5th Avenue, Suite 600, Seattle, WA 98121, USA
Introduction
Quantifying how much personal health care can
improve population health and ultimately health-system
performance is a crucial undertaking, particularly
following the inclusion of universal health coverage (UHC)
in the Sustainable Development Goals (SDGs).
1Mortality
from causes considered amenable to personal health care
serve as an important proxy of health-care access and
quality (panel),
4,6–8and thus can be used to benchmark
dimensions of health-system performance and to identify
untapped potential for advancing personal health-care
access and quality.
9–12Much debate exists concerning the
relative contributions of personal health care,
population-level health initiatives, and social determinants to
population health.
13–16Studies show that access to
high-quality health care substantially improves many health
outcomes, including infectious diseases (eg, tuberculosis
and measles);
17–19maternal and neonatal disorders;
20,21Research in context
Evidence before this study
In the last several decades, various studies have used measures of
amenable mortality, or deaths that could be avoided in the
presence of high-quality personal health care, to garner signals
about health-system delivery, effectiveness, and performance.
Rutstein and colleagues developed an initial list of conditions
from which death was “unnecessary and untimely” during the
late 1970s, while Charlton and colleagues were the first to apply
this concept to population-level analyses in England and Wales.
Although variations of amenable cause lists exist today, the most
widely used cause list of 33 conditions was developed and further
honed by Nolte and McKee during the early-to-mid 2000s. Such
analyses of health-care access and quality, as approximated by
amenable mortality, have been limited to Europe, Organisation
for Economic Co-operation and Development (OECD) countries,
and country-specific assessments, including the USA, Australia,
and New Zealand. These studies acknowledge several
methodological challenges that may impede the policy utility
and applications of their results. Heterogeneity in cause of death
certification and misclassification, even for countries with
complete vital registration systems, can hinder comparability of
results over time and place. Further, researchers commonly
acknowledge that variations in measured amenable mortality
rates may be more reflective of differences in underlying risk
factor exposure rather than true differences in personal
health-care access and quality.
Added value of this study
The Global Burden of Diseases, Injuries, and Risk Factors Study
(GBD) provides an appropriate analytic framework through
which these main challenges in approximating personal
health-care access and quality can be addressed. First, the
extensive cause of death data processing and standardisation
that occur within GBD allow for the systematic identification and
redress of cause of death certification errors or misclassification.
These adjustments are conducted across all geographies and
over time, accounting for known misclassification patterns and
applying well established redistribution algorithms for causes
designated to so-called garbage codes, or causes of death that
could not or should not be classified as underlying causes of
death. Second, we draw on GBD’s comparative risk assessment
analyses to risk-standardise national cause-specific mortality
rates to global levels of risk exposure; this step helps to remove
variations in death rates due to risk exposure rather than
differences in personal health-care access and quality. Third, we
construct the Healthcare Access and Quality (HAQ) Index based
on risk-standardised cause-specific death rates to facilitate
comparisons over time and by geography. Finally, we produced a
HAQ Index frontier to enable a better understanding of the
maximum observed levels of the HAQ Index across the
development spectrum, and what untapped potential for
improving personal health-care access and quality may exist
given a country or territory’s current resources.
Implications of all the available evidence
Our results point to substantive gains for advancing personal
health-care access and quality throughout the world since 1990.
However, the gap between places with the highest and lowest
HAQ Index in 1990 increased by 2015, suggesting that
geographic inequalities in personal health-care access and quality
might be on the rise. In 2015, countries in western Europe
generally had the highest HAQ Index values while geographies in
sub-Saharan Africa and Oceania mainly saw the lowest, further
emphasising these disparities. A number of countries achieved
improvements in the HAQ Index that exceeded the average
found for their development level, identifying possible success
stories in markedly advancing personal health-care access and
quality at the national level. Based on our frontier analysis, many
countries and territories currently experience untapped potential
for improving health-care access and quality, on the basis of their
development, a finding that could be transformative for
prioritising particular health-sector reforms, pinpointing
cause-specific therapeutic areas that require more policy
attention, and monitoring overall progress toward universal
health coverage.
characteristics such as intervention coverage, could provide a robust avenue for tracking progress on universal health
coverage and identifying local priorities for strengthening personal health-care quality and access throughout the world.
Funding
Bill & Melinda Gates Foundation.
personal health care,
4,6–8can provide vital insights into
access to and quality of health care worldwide. Assessments
of both mortality and disease burden attributable to risk
factors modifiable through public health programmes and
policy (eg, tobacco taxation), combined with access to
high-quality personal health care, can provide a more complete
picture of the potential avenues for health improvement.
In the late 1970s, Rutstein and colleagues first introduced
the idea of “unnecessary, untimely deaths”, proposing a
list of causes from which death should not occur with
timely and effective medical care.
6Eventually termed
“amenable mortality”, this approach has been modified
and extended since, with researchers refining the list of
included conditions by accounting for advances in medical
care, the introduction of new interventions, and improved
knowledge of cause-specific epidemiology.
7,8,27–29Numerous
studies have subsequently assessed amenable mortality
trends over time, by sex, and across ages in different
populations;
2,10,11,30–33examples include analyses showing
variations in amenable mortality within the European
Union and Organisation for Economic Co-operation and
Development (OECD),
3,34and how much the US health
system has lagged behind other higher-income
countries.
30,31Some studies also extended the set of
amenable conditions to include those targeted by public
health pro grammes.
31The most widely cited and utilised
list of causes amenable to personal health care is that of
Nolte and McKee,
4which has been extensively used in
Europe, the USA, and other OECD countries.
9,11,30,31,35Previously, several technical challenges have emerged
concerning the quantification of mortality from
con-ditions amenable to personal health care and its use for
understanding overall health-care access and quality. First,
discrepancies in cause of death certification practices and
misclassification over time and across geographies affect
comparisons of amenable mortality.
4,36Second, observed
geographic and temporal variations in deaths from
selected amenable causes (eg, stroke and heart disease)
might be attributed partly differences in risk factor
exposure (eg, diet, high BMI, and physical activity) rather
than actual differences in access to quality personal health
care.
Public health programmes and policies might modify
these risks in well-functioning health systems, but risk
variation can still confound the measurement of personal
health-care access and quality. Third, much of this work
has occurred in higher-income settings, with few studies
applying the concept of amenable mortality as a
mechanism for assessing access and quality to personal
health care in lower-resource settings. Other critiques
involve weak correlations between observed trends and
variations in amenable mortality and indicators of
health-care provision and spending, although this result could
195 countries and territories from 1990 to 2015. Here we define key concepts frequently
used in the literature focused on assessing health-care quality and how they relate to GBD
terminology:
Avertable burden refers to disease burden that could be avoided in the presence of
high-quality personal health care in addition to disease burden that could be prevented
through effective public health (ie, non-personal) interventions.
Amenable burden entails disease burden that could be avoided in the presence of
high-quality personal health care.
2,3To be considered a cause amenable to personal health
care, effective interventions must exist for the disease.
4The most widely used and cited
list of causes amenable to health care is that of Nolte and McKee.
Preventable burden involves disease burden that could be avoided through public health
programmes or policies focused on wider determinants of health, such as behavioural and
lifestyle influences, environmental factors, and socioeconomic status.
2,3For some causes,
both personal health care and public health programmes and policies can reduce burden.
Within the GBD framework, we have two related terms: attributable and avoidable
burden.
5Attributable burden refers to the difference in disease burden observed at present and
burden that would have been observed in a population if past exposure was at the lowest
level of risk.
Avoidable burden concerns the reduction in future disease burden if observed levels of
risk factor exposure today were decreased to a counterfactual level.
For this study, we use the definition of amenable burden and focus on amenable mortality
to provide a signal on approximate average levels of national personal health-care access
and quality. Future analyses facilitated through the GBD study aim to provide more
comprehensive assessments of health systems using amenable burden and preventable
burden.
Garbage codes refer to causes certified by physicians on death certificates that cannot or
should not be considered the actual underlying causes of death. Examples include risk
factors like hypertension, non-fatal conditions like yellow nails, and causes that are on
the final steps of a disease pathway (eg, certifying cardiopulmonary arrest as the cause
when ischaemic heart disease is the true underlying cause of death). A vital strength of
the GBD Study is its careful identification of garbage codes by cause, over time, and
across locations, and subsequent redistribution to underlying causes based on the GBD
cause list.
Risk-standardisation involves removing the joint effects of environmental and
behavioural risk exposure on cause-specific mortality rates at the country or territory level
for each year of analysis, and then adding back the global average of environmental and
behavioural risk exposure for every geography-year. The goal of risk-standardisation is to
eliminate geographic or temporal differences in cause-specific mortality due to variations
in risk factors that are not immediately targeted by personal health care—and thus
provide comparable measures of outcomes amenable to personal health-care access and
quality over place and time.
Frontier analysis refers to the approach used for ascertaining the highest achieved values
on the Healthcare Access and Quality Index (HAQ Index) on the basis of development
status, as measured by the Socio-demographic Index (SDI). The HAQ Index frontier
delineates the maximum HAQ Index reached by a location as it relates to SDI; if a country
or territory falls well below the frontier value given its level SDI, this finding suggests that
greater gains in personal health-care access and quality should be possible based on the
country or territory’s place on the development spectrum.
occur if health-care quality is heterogeneous within
countries.
37–40Additionally, existing lists might exclude
causes for which health care can avert death, such as the
effects of trauma care on various injuries,
4,41,42and the ages
at which personal health care can reduce mortality, namely
beyond the age of 75.
43,44The goal of this analysis is to use estimates of mortality
amenable to personal health care from the Global Burden
of Diseases, Injuries, and Risk Factors Study 2015
(GBD 2015) to approximate access to and quality of
personal health care in 195 countries and territories from
1990 to 2015. Quantifying access to and quality of personal
health care has many policy uses, and no consistent
measures of personal health-care access and quality
currently list across the development spectrum; for
instance, the World Bank coverage index only includes
three interventions,
45and the 2010–11 International Labour
Organization’s indicator of formal health coverage covered
93 countries, with substantial data missingness for
sub-Saharan Africa.
46The highly standardised cause of death
estimates generated through GBD,
47along with risk factor
exposure,
48can address several limitations associated with
previous studies of amenable mortality. GBD provides
comprehensive, comparable estimates of cause-specific
death rates by geography, year, age, and sex through its
extensive data correction processes to account for
variations in cause of death certification.
47The
quantification of risk exposure and risk-attributable deaths
due to 79 risk factors through GBD allows us to account for
variations in risk exposure across geographies and time,
48and thus helps to isolate variations in death rates due to
personal health-care access and quality. We also examine
the relationship between our measure of health-care access
and quality, as defined by risk-standardised mortality rates
amenable to health care, across development levels, as
reflected by the Socio-demographic Index (SDI). Finally,
we produce a frontier of maximum levels of personal
health-care access and quality observed on the basis of
SDI, which allows us to quantify the potential for further
improvement in relation to development status.
Methods
Overview
We employed the most widely cited and used framework
for assessing mortality amenable to personal health
care.
4,9,11,30,31,35The Nolte and McKee cause list does not
include all possible causes for which health care can
improve survival; however, it does provide a set of
conditions for which there is a reasonable consensus that
personal health care has a major effect (table 1). Starting
with this list, our analysis followed four steps: mapping
the Nolte and McKee cause list to GBD causes;
risk-standardising mortality rates to remove variations in death
rates not easily addressed through personal health care;
computing a summary measure of personal health-care
access and quality using principal component analysis
(PCA); and assessing the highest recorded levels of
health-care access and quality across the development spectrum.
This study draws from GBD 2015 results; further detail
on GBD 2015 data and methods are available
Amenable age range (years) Communicable, maternal, neonatal, and nutritional diseases
Tuberculosis 0–74
Diarrhoea, lower respiratory, and other common infectious diseases
Diarrhoeal diseases 0–14
Lower respiratory infections 0–74 Upper respiratory infections 0–74
Diphtheria 0–74 Whooping cough 0–14 Tetanus 0–74 Measles 1–14 Maternal disorders 0–74 Neonatal disorders 0–74 Non-communicable diseases Neoplasms
Colon and rectum cancer 0–74
Non-melanoma skin cancer (squamous-cell
carcinoma) 0–74 Breast cancer 0–74 Cervical cancer 0–74 Uterine cancer 0–44 Testicular cancer 0–74 Hodgkin’s lymphoma 0–74 Leukaemia 0–44 Cardiovascular diseases
Rheumatic heart disease 0–74
Ischaemic heart disease 0–74
Cerebrovascular disease 0–74
Hypertensive heart disease 0–74
Chronic respiratory diseases 1–14 Digestive diseases
Peptic ulcer disease 0–74
Appendicitis 0–74
Inguinal, femoral, and abdominal hernia 0–74 Gallbladder and biliary diseases 0–74 Neurological disorders
Epilepsy 0–74
Diabetes, urogenital, blood, and endocrine diseases
Diabetes mellitus 0–49
Chronic kidney disease 0–74
Other non-communicable diseases
Congenital heart anomalies 0–74
Injuries
Unintentional injuries
Adverse effects of medical treatment 0–74 The age groups for which mortality is regarded as amenable to health care are listed. Causes are ordered on the basis of the GBD cause list and corresponding cause group hierarchies. GBD=Global Burden of Disease.
Table 1: Causes for which mortality is amenable to health care mapped
elsewhere.
47–50For the present analysis, a vital strength of
GBD is its careful evaluation and correction of cause of
death certification problems and misclassification at the
national level. In the GBD, we systematically identified
causes of death that could not or should not be underlying
causes of death (so-called garbage codes), and applied
established statistical algorithms to correct for and
redistribute these deaths.
51Our study complies with the Guidelines for Accurate
and Transparent Health Estimates Reporting
(GATHER);
52additional information on the data and
modelling strategies used can be found in the appendix.
Mapping the Nolte and McKee amenable cause list to the
GBD cause list
Drawing from Nolte and McKee’s list of 33 causes
amenable to personal health care,
4,9,11,30,31,35we mapped
these conditions to the GBD cause list based on
corresponding International Classification of Diseases
(ICD) codes (appendix p 18). In GBD, thyroid diseases
and benign prostatic hyperplasia are part of a larger
residual category and thus were excluded. Diphtheria and
tetanus are separate causes in GBD so we reported them
individually. Because of its extensive processes used to
consistently map and properly classify ICD causes over
time,
47,53GBD supported the assessment of 32 causes on
the Nolte and McKee cause list from 1990 to 2015.
Age-standardised risk-standardised death rates
Some variation in death rates for amenable causes are
due to differences in behavioural and environmental risk
exposure rather than differences in personal health-care
access and quality.
48,54,55Using the wide range of risk
factors assessed by GBD,
48we risk-standardised death
rates to the global level of risk exposure.
48We did not
risk-standardise for variations in metabolic risk factors directly
targeted by personal health care: systolic blood pressure,
total cholesterol, and fasting plasma glucose. For example,
stroke deaths due to high systolic blood pressure are
amenable to primary care management of hypertension.
To risk-standardise death rates, we removed the joint
effects of national behavioural and environmental risk
levels calculated in GBD, and added back the global levels
of risk exposure:
where m
jascyis the death rate from cause j in age a, sex s,
location c, and year y; mr
jascyis the risk-standardised death
rate; JPAF
jascyis the joint population attributable fraction
(PAF) for cause j, in age a, sex s, country c, and year y for
all behavioural and environmental risks included in
GBD; and JPAF
jasgyis the joint PAF for cause j, in age a,
sex s, and year y at the global level.
GBD provides joint PAF estimation for multiple risks
combined, which takes into account the mediation of
different risks through each other. Further detail on
joint PAF computation is available in the appendix
(pp 5–8).
We used the GBD world population standard to
calculate age-standardised risk-standardised death rates
from each cause regarded as amenable to health care.
47We did not risk-standardise death rates from diarrhoeal
diseases as mortality attributable to unsafe water and
sanitation was not computed for high-SDI locations;
such standardisation could lead to higher
risk-standardised death rates in those countries compared
with countries where mortality was attributed to unsafe
water and sanitation.
48With all causes for which no PAFs
are estimated in GBD, such as neonatal disorders and
testicular cancer, risk-standardised death rates equalled
observed death rates.
The effects of risk-standardisation are highlighted by
comparing the log of age-standardised mortality rates to
Health expenditure per capita GBD 2015 195 0·884 0·880 0·854 0·864
Hospital beds (per 1000) GBD 2015 195 0·700 0·683 0·625 0·650
UHC tracer index of 11 interventions GBD 2015 188 0·826 0·820 0·812 0·818
Physicians, nurses, and midwives per 1000 WHO 2010 73 0·769 0·755 0·725 0·732
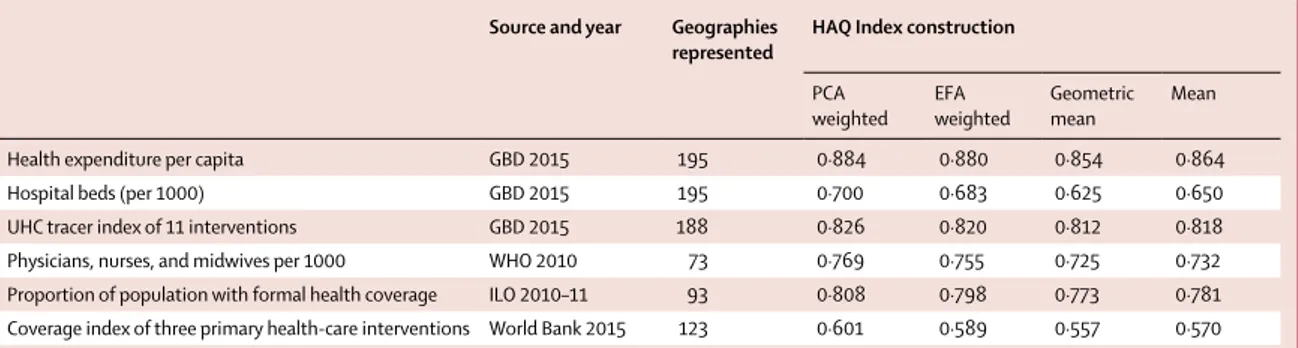
Proportion of population with formal health coverage ILO 2010–11 93 0·808 0·798 0·773 0·781 Coverage index of three primary health-care interventions World Bank 2015 123 0·601 0·589 0·557 0·570 The universal health coverage tracer index of 11 interventions included coverage of four childhood vaccinations (BCG, measles, three doses of diphtheria-pertussis-tetanus, and three doses of polio vaccines); skilled birth attendance; coverage of at least one and four antenatal care visits; met need for family planning with modern contraception; tuberculosis case detection rates; insecticide-treated net coverage; and antiretroviral therapy coverage for populations living with HIV. The World Bank coverage index included coverage of three interventions: three doses of diphtheria-pertussis-tetanus vaccine; at least four antenatal care visits; and children with diarrhoea receiving appropriate treatment. HAQ Index=Healthcare Access and Quality Index. PCA=principal components analysis. EFA=exploratory factor analysis. GBD=Global Burden of Disease. UHC=universal health coverage. ILO=International Labour Organization.
Table 2: Correlations between different constructions of the HAQ Index and existing indicators of health-care access or quality
See Online for appendix
mr
jascy=
m
jascy(
1 – JPAF
jasgyFigure 1: Map of HAQ Index values, by decile, in 1990 (A) and 2015 (B)
Deciles were based on the distribution of HAQ Index values in 2015 and then were applied for 1990. HAQ Index = Healthcare Access and Quality Index. ATG=Antigua and Barbuda. VCT=Saint Vincent and the Grenadines. LCA=Saint Lucia. TTO=Trinidad and Tobago. TLS=Timor-Leste. FSM=Federated States of Micronesia.
Balkan Peninsula Persian Gulf A B Caribbean LCA Dominica ATG TTO Grenada VCT TLS Maldives Barbados Seychelles Mauritius Comoros
West Africa Eastern
Mediterranean Malta Singapore Tonga Samoa FSM Fiji Solomon Isl Marshall Isl Vanuatu Kiribati Balkan Peninsula Caribbean LCA Dominica ATG TTO Grenada VCT TLS Maldives Barbados Seychelles Mauritius Comoros
West Africa Eastern
Mediterranean Malta Singapore Tonga Samoa FSM Fiji Solomon Isl Marshall Isl Vanuatu Kiribati <42·9 42·9–47·0 47·0–51·3 51·3–59·0 59·0–63·4 63·4–69·7 69·7–74·4 74·4–79·4 79·4–86·3 >86·3 Persian Gulf <42·9 42·9–47·0 47·0–51·3 51·3–59·0 59·0–63·4 63·4–69·7 69·7–74·4 74·4–79·4 79·4–86·3 >86·3 HAQ Index HAQ Index
underlying local risk exposure can skew measures of
mortality amenable to personal health care.
Construction of the Healthcare Access and Quality Index
based on age-standardised risk standardised death rates
To construct the Healthcare Access and Quality (HAQ)
Index, we first rescaled the log age-standardised
risk-standardised death rate by cause to a scale of 0 to 100
such that the highest observed value from 1990 to 2015
was 0 and the lowest was 100. To avoid the effects of
fluctuating death rates in small populations on rescaling,
we excluded populations less than 1 million population
from setting minimum and maximum values. Any
location with a cause-specific death rate below the
minimum or above the maximum from 1990 to 2015 was
set to 100 or 0, respectively.
Because each included cause provided some signal on
average levels of personal health-care access and quality,
we explored four approaches to construct the HAQ
Index: PCA, exploratory factor analysis, arithmetic mean,
and geometric mean. Details on these four approaches
are in the appendix (pp 7, 8, 21, 22). All four measures
were highly correlated, with Spearman’s rank order
correlations exceeding r
s=0·98. We selected the
PCA-derived HAQ Index because it provided the strongest
correlations with six other currently available
cross-country measures of access to care or health-system
inputs (table 2). Three indicators came from the GBD Study
2015: health expenditure per capita, hospital beds
per 1000, and the UHC tracer intervention index, a
composite measure of 11 UHC tracer interventions (four
childhood vaccinations; skilled birth attendance; coverage
of at least one and four antenatal care visits; met need for
family planning with modern contraception; tuberculosis
case detection rates; insecticide-treated net coverage; and
antiretroviral therapy coverage for populations living
with HIV).
56Three indicators came from WHO
(physicians, nurses, and midwives per 1000),
57the
International Labour Organization,
46and the World Bank
(coverage index based on diphtheria-pertussis-tetanus
vaccine coverage, coverage of at least four antenatal care
visits, and proportion of children with diarrhoea receiving
appropriate treatment).
45All indicators had correlation
coefficients greater than 0·60, and three exceeded 0·80
(health expenditure per capita, the UHC tracer index,
and International Labour Organization formal health
coverage).
The appendix (pp 21, 22) provides final rescaled PCA
weights derived from the first five components that
collectively accounted for more than 80% of the variance
in cause-specific measures. Colon and breast cancer had
negative PCA weights, which implied higher death rates
mortality rates.
Quantifying maximum levels of the HAQ Index across
the development spectrum
To better understand maximum levels of personal
health-care access and quality potentially achievable across the
development spectrum, we produced a frontier based on
the relationship between the HAQ Index and SDI. We
tested both stochastic frontier analysis models and data
envelopment analysis; however, the relationship between
SDI and the HAQ Index did not fit standard stochastic
frontier analysis models,
58and data envelopment analysis
cannot account for measurement error and is sensitive to
outliers.
59To generate a frontier fit that closely follows the
observed HAQ Index and allowed for measurement error,
we used free disposal hull analysis on 1000 bootstrapped
samples of the data.
58Every bootstrap included a subset
of locations produced by randomly sampling (with
replacement) from all GBD geographies. The final HAQ
Index value was drawn from the uncertainty distribution
for each location-year, with outliers removed by excluding
super-efficient units; additional methodological detail can
be found in the appendix (pp 9–12). Last, we used a Loess
regression to produce a smooth frontier for each five-year
interval from 1990 to 2015. For every geography, we report
the maximum possible HAQ Index value on the basis of
SDI in 1990 and 2015, while values for all years can be
found in the appendix (pp 23–28).
Uncertainty analysis
GBD aims to propagate all sources of uncertainty
through its estimation process,
47,48which results in
uncertainty intervals (UIs) accompanying each point
estimate of death by cause, geography, year, age group,
and sex. We computed the HAQ Index for each
geography-year based on 1000 draws from the posterior
distribution for each included cause of death. We report
95% UIs based on the ordinal 25th and 975th draws for
each quantity of interest.
Role of the funding source
The funder of the study had no role in study design, data
collection, data analysis, data interpretation, or writing of
the report. The corresponding author had full access to
all the data in the study and had final responsibility for
the decision to submit for publication.
Results
Distinct geographic patterns emerged for overall HAQ
Index levels and gains from 1990 to 2015 (figure 1).
Andorra and Iceland had the highest HAQ Index in 1990,
whereas most of sub-Saharan Africa and south Asia and
19 30 31 35 36 36 39 39 40 43 43 44 45 45 45 45 45 46 46 46 47 48 49 49 49 50 50 50 50 50 50 50 51 51 51 51 51 52 52 52 52 52 52 52 52 53 53 53 53 53 53 53 54 54 54 54 54 55 55 55 55 55 55 56 56 56 56 56 56 56 56 57 57 57 57 57 58 58 58 58 58 58 58 58 58 58 59 59 59 59 59 59 59 59 59 59 59 60 60 60 60 60 60 60 60 60 60 60 60 60 60 60 60 60 61 61 61 61 61 61 61 61 61 61 61 61 61 61 61 61 61 61 62 62 62 62 62 62 62 62 62 62 62 62 62 62 62 62 62 62 62 63 63 63 63 63 63 63 63 63 63 63 63 63 63 63 63 64 64 64 64 64 64 64 64 64 64 64 64 64 64 64 64 65 65 65 65 65 65 65 65 65 65 65 65 65 65 65 65 65 65 65 65 65 65 65 65 65 65 65 65 65 65 66 66 66 66 66 66 66 66 66 66 66 66 66 66 66 66 66 67 67 67 67 67 67 67 67 67 67 67 67 67 67 67 67 67 67 67 68 68 68 68 68 68 68 68 68 68 68 68 68 68 68 68 68 68 68 68 68 68 69 69 69 69 69 69 69 69 69 69 69 69 69 69 69 69 70 70 70 70 70 70 70 70 70 70 70 70 70 70 70 70 70 70 70 70 70 71 71 71 71 71 71 71 71 71 71 71 71 71 71 71 71 71 71 71 71 71 71 71 71 71 71 71 72 72 72 72 72 72 72 72 72 72 72 72 72 72 72 72 72 72 72 72 72 72 72 72 72 72 72 72 72 72 72 72 72 72 73 73 73 73 73 73 73 73 73 73 73 73 73 73 73 73 74 74 74 74 74 74 74 74 74 74 74 74 74 74 74 74 74 74 74 74 74 74 74 74 74 74 74 74 74 74 75 75 75 75 75 75 75 75 75 75 75 75 75 75 75 75 75 75 75 75 75 75 75 75 75 76 76 76 76 76 76 76 76 76 76 76 76 76 76 76 76 76 76 76 76 76 76 76 76 76 76 76 77 77 77 77 77 77 77 77 77 77 77 77 77 77 77 77 77 77 77 78 78 78 78 78 78 78 78 78 78 78 78 78 78 78 78 78 78 78 78 78 78 78 78 78 78 78 78 78 78 78 78 79 79 79 79 79 79 79 79 79 79 79 79 79 79 79 79 79 79 79 79 79 79 79 79 79 79 79 79 79 79 79 79 79 79 80 80 80 80 80 80 80 80 80 80 80 80 80 80 80 80 80 80 80 80 80 80 80 80 80 80 80 80 80 81 81 81 81 81 81 81 81 81 81 81 81 81 81 81 81 81 81 81 81 81 81 81 81 81 81 81 81 81 81 81 81 81 81 81 81 81 81 81 81 81 81 82 82 82 82 82 82 82 82 82 82 82 82 82 82 82 82 82 82 82 82 82 82 82 82 82 83 83 83 83 83 83 83 83 83 83 83 83 83 83 83 83 83 83 83 83 83 83 83 83 83 83 84 84 84 84 84 84 84 84 84 84 84 84 84 84 84 84 84 84 84 84 84 84 84 84 84 84 84 84 84 84 84 84 84 84 85 85 85 85 85 85 85 85 85 85 85 85 85 85 85 85 85 85 85 85 85 85 85 85 85 85 85 85 85 85 85 85 85 85 85 85 85 85 85 85 85 85 85 85 85 85 85 85 85 86 86 86 86 86 86 86 86 86 86 86 86 86 86 86 86 86 86 86 86 86 86 86 86 86 86 86 86 86 86 86 86 86 86 86 86 86 86 86 86 86 86 86 87 87 87 87 87 87 87 87 87 87 87 87 87 87 87 87 87 87 87 87 87 87 87 87 87 87 87 87 87 87 87 87 87 87 87 87 87 88 88 88 88 88 88 88 88 88 88 88 88 88 88 88 88 88 88 88 88 88 88 88 88 88 88 88 88 88 88 88 89 89 89 89 89 89 89 89 89 89 89 89 89 89 89 89 89 89 89 89 89 89 89 89 89 89 89 89 89 89 89 89 89 89 89 89 89 89 89 90 90 90 90 90 90 90 90 90 90 90 90 90 90 90 90 90 90 90 90 90 90 90 90 90 90 90 90 90 90 90 90 90 90 90 90 90 91 91 91 91 91 91 91 91 91 91 91 91 91 91 91 91 91 91 91 91 91 91 91 91 91 91 91 91 91 91 91 91 91 91 91 91 91 92 92 92 92 92 92 92 92 92 92 92 92 92 92 92 92 92 92 92 92 92 92 92 92 92 92 92 92 92 92 92 92 92 92 92 92 92 92 92 92 92 92 92 92 92 92 93 93 93 93 93 93 93 93 93 93 93 93 93 93 93 93 93 93 93 93 93 93 93 93 93 93 93 93 93 93 93 93 93 93 93 93 93 93 93 93 93 93 93 93 93 93 93 94 94 94 94 94 94 94 94 94 94 94 94 94 94 94 94 94 94 94 94 94 94 94 94 94 94 94 94 94 94 94 94 94 94 94 94 94 95 95 95 95 95 95 95 95 95 95 95 95 95 95 95 95 95 95 95 95 95 95 95 95 95 95 95 95 95 95 95 95 95 95 95 95 95 95 95 95 95 95 95 95 95 96 96 96 96 96 96 96 96 96 96 96 96 96 96 96 96 96 96 96 96 96 96 96 96 96 96 96 96 96 96 96 96 96 96 96 96 96 96 96 96 96 96 96 96 96 96 97 97 97 97 97 97 97 97 97 97 97 97 97 97 97 97 97 97 97 97 97 97 97 97 97 97 97 97 97 97 97 97 97 97 97 97 97 97 97 97 98 98 98 98 98 98 98 98 98 98 98 98 98 98 98 98 98 98 98 98 98 98 98 98 98 98 98 98 98 98 98 98 98 98 98 98 98 98 98 98 98 98 98 98 98 98 98 98 98 98 98 98 98 98 98 98 98 99 99 99 99 99 99 99 99 99 99 99 99 99 99 99 99 99 99 99 99 99 99 99 99 99 99 99 99 99 99 99 99 99 99 99 99 99 99 99 99 99 99 99 99 99 99 99 99 99 99 99 99 99 99 99 99 99 99 99 99 99 99 99 99 99 99 99 99 99 99 99 99 99 99 99 99 99 99 99 99 99 99 99 99 99 99 99 99 100 100 100 100 100 100 100 100 100 100 100 100 100 100 100 100 100 100 100 100 100 100 100 100 100 100 100 100 100 100 100 100 100 100 100 100 100 100 100 100 100 100 100 100 100 100 100 100 100 100 100 100 100 100 100 100 100 100 100 100 100 100 100 100 100 100 100 100 100 100 100 100 100 100 100 100 100 100 100 100 100 100 100 100 100 100 100 100 100 100 100 100 100 100 100 100 100 100 100 100 100 100 100 100 100 100 100 100 100 100 100 100 100 100 100 100 100 100 100 100 100 100 100 100 100 100 100 100 100 100 100 100 100 100 100 100 100 100 100 100 100 100 100 100 100 100 100 100 100 100 100 100 100 100 100 100 100 100 100 100 100 100 100 Serbia Chile Macedonia Lithuania Puerto Rico Taiwan Latvia Slovakia Bahrain Bermuda Saudi Arabia Poland Hungary Lebanon Montenegro USA Estonia Croatia Kuwait Portugal UK Czech Republic Malta Qatar Cyprus Israel Denmark South Korea New Zealand Singapore Germany Greece Slovenia Canada Belgium France Austria Ireland Italy Japan Luxembourg Netherlands Spain Finland Australia Norway Sweden Switzerland Iceland Andorra
Healthcare Access and Quality Index Tuberculosis Diarrhoeal diseases Lower respiratory infections Upper respiratory infections Diptheria Whooping cough Tetanus Measles Maternal disorders Neonatal disorders Non-melanoma skin cancer Cervical cancer Uterine cancer Testicular cancer Hodgkin’s lymphoma Leukaemia Rheumatic heart disease Ischaemic heart disease Cerebrovascular disease Hypertensive heart disease Chronic respiratory disease Peptic ulcer disease Appendicitis Inguinal, femoral, and abdominal hernia Gallbladder and biliary diseases Epilepsy Diabetes mellitus Chronic kidney disease Congenital heart anomalies Adverse effects of medical treatment
0 25 50 75 100 Panel A
11 20 23 24 24 24 25 25 26 26 27 27 27 27 27 28 28 29 29 29 29 30 30 31 31 32 32 32 33 33 33 33 34 34 35 35 36 36 36 37 37 37 37 37 38 38 38 38 38 38 39 39 39 39 39 40 40 40 40 40 40 40 41 41 41 41 41 41 41 41 41 41 42 42 42 42 42 42 42 42 42 43 43 43 43 43 43 43 43 43 43 43 43 44 44 44 44 44 44 44 45 45 45 45 45 45 45 45 45 45 45 46 46 46 46 46 46 46 46 47 47 47 47 47 47 47 47 47 48 48 48 48 48 48 48 48 48 48 48 49 49 49 49 49 49 49 49 49 49 49 50 50 50 50 50 50 50 50 50 50 50 50 50 50 50 51 51 51 51 51 51 51 51 51 51 51 51 51 51 52 52 52 52 52 52 52 52 52 52 52 52 52 52 53 53 53 53 53 53 53 53 53 53 53 53 53 53 54 54 54 54 54 54 54 54 54 54 54 54 54 54 55 55 55 55 55 55 55 55 55 55 56 56 56 56 56 56 56 56 56 56 56 57 57 57 57 57 57 57 57 57 57 57 57 57 57 57 57 57 57 57 57 57 57 58 58 58 58 58 58 58 58 58 58 58 59 59 59 59 59 59 59 59 59 59 59 59 60 60 60 60 60 60 60 60 60 60 61 61 61 61 61 61 61 61 61 61 62 62 62 62 62 62 62 62 62 62 62 62 62 62 62 62 62 62 62 63 63 63 63 63 63 64 64 64 64 64 64 64 64 64 64 65 65 65 65 65 65 65 65 65 65 65 65 66 66 66 66 66 66 66 66 66 66 66 67 67 67 67 67 67 67 67 67 67 67 67 67 67 67 67 68 68 68 68 68 68 68 68 68 68 68 68 68 68 68 68 68 68 69 69 69 69 69 69 69 69 69 69 69 69 69 69 70 70 70 70 70 70 70 70 70 70 70 70 70 70 70 70 70 70 70 70 71 71 71 71 71 71 71 71 71 71 71 71 71 71 71 71 72 72 72 72 72 72 72 72 72 72 72 72 72 72 72 72 72 73 73 73 73 73 73 73 73 73 73 73 73 73 73 73 74 74 74 74 74 74 74 74 74 74 74 74 74 75 75 75 75 75 75 75 75 75 75 75 76 76 76 76 76 76 76 76 76 76 76 76 77 77 77 77 77 77 77 77 77 77 77 77 77 77 78 78 78 78 78 78 78 78 78 78 78 79 79 79 79 79 79 79 79 80 80 80 80 80 80 80 81 81 81 81 81 81 81 82 82 82 82 82 82 82 82 82 82 82 82 82 82 82 82 82 82 83 83 83 83 83 83 83 83 84 84 85 85 85 85 85 85 85 85 85 85 85 86 86 86 86 86 86 87 87 87 87 88 88 88 88 88 88 88 88 88 88 88 88 89 89 89 89 90 90 90 90 90 91 91 91 91 91 91 91 92 92 92 92 92 92 92 92 93 93 93 93 93 94 94 94 94 94 94 94 94 95 95 95 95 95 95 95 95 95 95 96 96 96 96 96 96 96 96 96 96 96 96 96 96 97 97 97 97 97 97 97 97 97 98 98 98 98 98 98 98 98 98 98 98 98 98 98 98 98 98 98 98 99 99 99 99 99 99 99 99 99 99 99 99 99 99 99 99 99 99 100 100 100 100 100 100 100 100 100 100 100 100 100 100 100 100 100 100 100 100 100 100 100 100 100 100 100 100 100 100 100 100 100 100 100 100 100 100 100 100 100 100 100 Turkmenistan Grenada Kazakhstan Trinidad and Tobago Georgia Guam The Bahamas Azerbaijan Seychelles Malaysia Antigua and Barbuda Barbados Armenia Argentina Brunei Virgin Islands Greenland Bulgaria Russia
Northern Mariana Islands United Arab Emirates Ukraine Cuba Belarus Romania
Healthcare Access and Quality Index Tuberculosis Diarrhoeal diseases Lower respiratory infections Upper respiratory infections Diptheria Whooping cough Tetanus Measles Maternal disorders Neonatal disorders Non-melanoma skin cancer Cervical cancer Uterine cancer Testicular cancer Hodgkin’s lymphoma Leukaemia Rheumatic heart disease Ischaemic heart disease Cerebrovascular disease Hypertensive heart disease Chronic respiratory disease Peptic ulcer disease Appendicitis Inguinal, femoral, and abdominal hernia Gallbladder and biliary diseases Epilepsy Diabetes mellitus Chronic kidney disease Congenital heart anomalies Adverse effects of medical treatment
0 25 50 75 100 9 13 26 28 28 29 30 30 30 31 31 31 32 32 33 33 33 33 34 35 36 37 37 37 38 38 38 38 39 39 39 39 39 39 40 40 40 40 41 41 42 42 42 43 43 43 43 43 43 44 44 44 44 44 44 44 44 44 45 45 45 45 45 45 45 45 45 46 46 46 46 46 46 46 46 46 47 47 47 47 47 47 47 47 48 48 48 48 48 48 48 49 49 49 49 49 49 49 50 50 50 50 50 50 50 50 50 50 50 51 51 51 51 51 51 51 51 51 52 52 52 52 52 53 53 53 53 53 53 53 53 53 53 53 53 54 54 54 54 54 54 54 54 54 54 54 54 55 55 55 55 55 55 55 55 55 55 56 56 56 56 56 56 56 56 56 56 56 56 56 56 56 56 57 57 57 57 57 57 57 57 57 57 57 57 57 57 57 58 58 58 58 58 58 58 59 59 59 59 59 59 59 59 59 59 59 59 59 59 60 60 60 60 60 60 60 60 60 60 60 60 61 61 61 61 61 61 61 61 61 61 61 61 61 61 61 62 62 62 62 62 62 62 62 62 62 62 62 62 62 62 62 62 62 63 63 63 63 63 63 63 63 63 63 63 63 63 63 63 64 64 64 64 64 64 64 64 64 64 64 65 65 65 65 65 65 65 65 65 65 65 65 65 65 65 65 65 65 65 65 66 66 66 66 66 66 66 66 66 66 66 67 67 67 67 67 67 67 67 67 67 67 67 67 67 67 68 68 68 68 68 68 68 68 68 68 68 68 68 68 68 68 68 69 69 69 69 69 69 69 69 69 69 69 69 69 69 69 70 70 70 70 70 70 70 70 70 70 70 70 70 70 70 70 70 70 70 70 70 70 71 71 71 71 71 71 71 71 71 71 71 71 71 71 71 71 71 72 72 72 72 72 72 72 72 72 72 72 72 72 72 72 72 72 73 73 73 73 73 73 73 73 73 73 73 73 73 73 73 73 73 73 73 73 74 74 74 74 74 74 74 74 74 75 75 75 75 75 75 75 75 75 75 75 75 75 76 76 76 76 76 76 76 76 76 76 76 76 76 76 76 76 76 77 77 77 77 77 77 77 77 77 77 77 77 77 77 77 77 77 77 77 78 78 78 78 78 78 78 78 78 78 78 78 78 79 79 79 79 79 79 79 79 79 79 79 79 79 79 80 80 80 80 80 80 80 80 80 80 80 80 81 81 81 81 81 81 81 81 82 82 82 82 82 82 82 82 82 82 82 82 83 83 83 83 83 83 83 83 84 84 84 84 84 84 84 84 84 84 84 84 85 85 85 85 85 85 85 85 85 85 85 85 86 86 86 86 86 86 86 86 86 86 86 87 87 87 87 87 87 87 87 88 88 88 88 88 88 89 89 89 89 89 89 89 89 89 89 89 89 89 89 89 90 90 90 90 90 90 90 90 90 90 90 91 91 91 91 91 91 91 91 91 91 91 91 91 91 91 92 92 92 92 92 92 92 93 93 93 93 93 93 93 93 93 93 93 94 94 94 94 94 94 94 95 95 95 95 95 95 95 95 95 95 95 96 96 96 96 96 96 96 96 96 96 96 96 96 96 96 97 97 97 97 97 97 97 97 97 97 97 97 97 97 97 98 98 98 98 98 98 98 98 98 98 99 99 99 99 99 99 99 99 99 99 99 99 99 100 100 100 100 100 100 100 100 100 100 100 100 100 100 100 100 100 100 100 100 100 100 100 100 100 100 100 100 100 100 100 100 100 100 100 100 100 American Samoa Jamaica El Salvador Panama Venezuela Brazil Mauritius Vietnam Colombia Libya Peru Tunisia Thailand Iran Uruguay Sri Lanka Costa Rica Moldova China Maldives Jordan Turkey Oman Albania
Bosnia and Herzegovina
Panel
A cont.
Panel
B
Healthcare Access and Quality Index Tuberculosis Diarrhoeal diseases Lower respiratory infections Upper respiratory infections Diptheria Whooping cough Tetanus Measles Maternal disorders Neonatal disorders Non-melanoma skin cancer Cervical cancer Uterine cancer Testicular cancer Hodgkin’s lymphoma Leukaemia Rhaeumatic heart disease Ischaemic heart disease Cerebrovascular disease Hypertensive heart disease Chronic respiratory disease Peptic ulcer disease Appendicitis Inguinal, femoral, and abdominal hernia Gallbladder and biliary diseases Epilepsy Diabetes mellitus Chronic kidney disease Congenital heart anomalies Adverse effects of medical treatment 0 25 50 75 100 7 9 13 14 14 15 15 16 18 19 19 20 20 21 21 21 23 23 23 24 24 24 24 24 24 24 24 24 24 24 24 25 25 25 25 25 25 25 26 26 26 26 27 27 27 27 27 27 27 27 27 27 27 28 28 28 28 28 29 29 29 29 29 29 29 29 30 30 30 30 30 30 30 31 31 31 31 31 31 31 31 31 31 31 31 31 31 32 32 32 32 33 33 33 33 33 33 33 34 34 34 34 34 34 34 34 35 35 35 35 35 35 35 35 35 35 36 36 36 36 36 36 36 36 36 36 37 37 37 37 37 37 37 37 37 37 37 38 38 38 38 38 38 38 38 38 38 38 38 38 38 39 39 39 39 39 39 39 39 40 40 40 40 40 40 40 40 40 40 40 40 41 41 41 41 41 41 41 41 41 41 42 42 42 42 42 42 42 42 42 42 42 42 42 42 43 43 43 43 43 43 43 43 43 44 44 44 44 44 44 44 44 44 44 44 44 44 45 45 45 45 45 45 45 45 45 45 45 46 46 46 46 46 46 46 46 46 46 46 46 46 46 46 47 47 47 47 47 47 47 47 47 47 47 47 47 47 47 47 47 47 47 47 47 47 47 47 48 48 48 48 48 48 48 48 48 48 48 48 48 49 49 49 49 49 49 49 49 49 49 49 49 50 50 50 50 50 50 50 50 50 50 50 50 50 50 51 51 51 51 51 51 51 51 51 51 51 51 51 51 52 52 52 52 52 52 52 52 52 52 52 52 52 52 52 53 53 53 53 53 53 53 53 53 53 53 53 53 53 53 53 53 54 54 54 54 54 54 54 54 54 54 54 54 54 54 54 54 54 54 54 54 54 54 54 54 54 54 54 54 54 54 55 55 55 55 55 55 55 55 55 55 56 56 56 56 56 56 56 56 56 56 56 56 56 57 57 57 57 57 57 57 57 57 57 57 57 57 58 58 58 58 58 58 58 58 58 58 58 58 58 58 58 58 58 58 58 59 59 59 59 59 59 59 59 59 59 59 59 59 59 59 59 60 60 60 60 60 60 60 60 60 61 61 61 61 61 61 61 61 61 61 61 62 62 62 62 62 62 62 62 62 62 62 62 62 62 62 62 62 62 62 63 63 63 63 63 63 63 63 63 63 63 63 63 63 63 63 63 64 64 64 64 64 64 64 64 64 64 64 64 65 65 65 65 65 65 65 65 65 65 65 65 65 65 65 65 65 66 66 66 66 66 66 66 66 66 66 66 66 67 67 67 67 67 67 67 67 68 68 68 68 68 68 68 68 68 68 68 69 69 69 69 69 69 70 70 70 70 70 70 70 70 70 70 71 71 71 71 71 71 72 72 72 72 72 72 72 72 72 72 73 73 73 73 73 73 74 74 74 74 75 75 75 75 75 75 75 75 75 75 75 75 76 76 76 76 76 77 77 77 77 77 77 77 78 78 78 78 78 78 78 78 79 79 79 79 80 80 80 81 81 81 82 82 82 82 82 82 82 82 83 83 83 83 83 83 84 84 85 85 85 85 86 86 86 86 86 87 87 87 87 87 87 87 87 87 87 88 88 88 88 88 88 88 88 89 89 89 89 89 89 89 89 89 89 89 90 90 90 90 90 90 90 90 91 91 91 91 91 91 91 92 92 92 92 92 92 92 93 93 93 93 93 93 93 94 94 94 94 94 94 94 94 95 95 95 95 95 96 96 96 96 97 97 97 98 98 98 98 98 98 98 98 98 98 98 98 98 98 98 99 99 99 99 99 99 99 99 99 99 99 99 99 99 99 99 99 100 100 100 100 100 100 100 100 100 100 100 100 100 100 100 100 100 100 Swaziland Fiji Indonesia Guyana Botswana Gabon Philippines South Africa Namibia
Federated States of Micronesia Suriname
Saint Vincent and the Grenadines Dominica Belize Mongolia Bolivia Kyrgyzstan Paraguay Egypt Ecuador Tonga Samoa Uzbekistan Dominican Republic Saint Lucia Mexico 5 10 12 14 16 16 16 18 18 19 19 19 20 20 21 21 21 21 22 23 23 23 23 24 24 24 25 26 26 26 27 27 27 27 27 27 27 27 28 28 28 28 29 29 30 30 30 30 30 30 30 30 30 30 31 31 31 32 32 32 32 32 32 33 33 33 33 33 33 33 33 33 33 33 34 34 34 34 34 34 34 34 35 35 35 35 35 35 35 35 35 35 35 35 36 36 36 36 36 36 36 37 37 37 37 37 37 37 37 37 37 37 37 38 38 38 38 38 38 38 38 38 39 39 39 39 39 39 39 39 39 39 39 40 40 40 40 40 40 40 40 40 41 41 41 41 41 41 41 42 42 42 42 42 42 42 42 42 43 43 43 43 43 43 43 43 43 43 43 43 44 44 44 44 44 44 44 44 44 44 44 44 45 45 45 45 45 45 45 45 45 45 45 45 45 45 45 45 45 45 46 46 46 46 46 46 46 46 46 46 46 47 47 47 47 47 47 47 47 47 47 47 47 47 48 48 48 48 48 48 48 48 48 48 48 48 48 48 48 48 48 48 48 48 49 49 49 49 49 49 49 49 49 49 49 49 49 50 50 50 50 50 50 50 50 50 50 50 50 50 50 50 50 51 51 51 51 51 51 51 51 51 51 51 51 51 51 51 51 51 51 51 51 51 52 52 52 52 52 52 52 52 52 52 52 52 52 53 53 53 53 53 53 53 53 53 53 53 53 53 53 53 53 53 53 54 54 54 54 54 54 54 54 54 54 54 54 54 54 54 55 55 55 55 55 55 55 55 55 55 55 55 55 56 56 56 56 56 56 56 56 56 56 56 56 56 57 57 57 57 57 57 57 57 57 57 57 57 57 57 57 57 57 57 57 57 58 58 58 58 58 58 58 58 58 58 59 59 59 59 59 59 59 59 59 59 59 59 59 60 60 60 60 60 60 60 60 60 60 61 61 61 61 61 61 61 61 61 61 61 61 62 62 62 62 62 62 62 62 62 62 62 62 62 63 63 63 63 63 63 63 63 63 64 64 64 64 64 64 64 64 64 64 64 64 64 64 64 64 64 64 65 65 65 65 65 65 66 66 66 66 66 66 66 66 67 67 67 67 67 67 67 68 68 68 68 68 68 68 68 68 68 68 69 69 69 70 70 70 70 70 70 70 70 70 71 71 71 71 71 71 71 71 71 71 71 71 72 72 72 72 72 72 72 72 72 72 72 72 72 72 72 72 73 73 73 73 74 74 74 74 74 74 74 74 75 75 75 75 75 75 75 75 76 76 76 76 76 76 76 76 76 76 77 77 77 77 77 77 77 77 77 78 78 78 78 78 79 79 79 79 79 79 79 79 79 79 80 80 80 80 80 80 80 80 80 80 81 81 81 81 81 81 81 81 81 82 82 82 83 83 83 83 83 83 83 83 83 84 84 84 84 84 84 84 84 84 84 84 85 85 85 85 85 85 85 86 86 86 86 86 86 86 87 87 88 88 88 88 88 88 88 89 89 89 89 89 89 89 89 89 89 90 90 90 90 90 90 90 90 91 91 91 91 91 92 92 92 92 92 92 93 93 93 93 93 93 93 94 94 94 94 94 95 95 95 95 95 95 96 96 97 97 97 97 98 98 98 98 98 98 98 98 98 99 99 99 99 99 99 99 99 99 99 99 99 99 100 100 100 100 100 100 100 Equatorial Guinea Kenya Zimbabwe São Tomé and Príncipe Ghana Marshall Islands Sudan Cambodia Nepal Nigeria Timor-Leste Bangladesh Bhutan Honduras Guatemala Tajikistan Iraq Morocco North Korea Cape Verde Algeria Nicaragua Palestine Syria Panel C Panel B cont.
Healthcare Access and Quality Index Tuberculosis Diarrhoeal diseases Lower respiratory infections Upper respiratory infections Diptheria Whooping cough Tetanus Measles Maternal disorders Neonatal disorders Non-melanoma skin cancer Cervical cancer Uterine cancer Testicular cancer Hodgkin’s lymphoma Leukaemia Rheumatic heart disease Ischaemic heart disease Cerebrovascular disease Hypertensive heart disease Chronic respiratory disease Peptic ulcer disease Appendicitis Inguinal, femoral, and abdominal hernia Gallbladder and biliary diseases Epilepsy Diabetes mellitus Chronic kidney disease Congenital heart anomalies Adverse effects of medical treatment 0 25 50 75 100 5 6 7 9 11 11 11 13 13 14 15 15 16 16 16 17 18 18 18 18 18 19 19 19 19 19 19 20 20 20 21 21 21 21 21 22 22 22 22 22 22 23 23 23 23 23 23 23 24 24 24 24 25 25 25 25 26 26 26 26 26 26 26 26 26 26 26 26 26 27 27 27 27 27 27 27 28 28 28 29 29 29 29 29 29 29 29 29 29 29 29 30 30 30 30 30 30 30 30 31 31 31 31 31 31 31 32 32 32 32 33 33 33 33 33 33 34 34 34 34 35 35 35 35 35 35 35 35 35 35 35 35 35 36 36 36 36 36 36 36 36 36 36 36 36 36 36 36 36 37 37 37 37 37 37 37 37 37 37 38 38 38 38 38 38 38 38 38 38 38 38 39 39 39 39 39 39 39 40 40 40 40 40 40 40 40 40 40 41 41 41 41 41 41 41 41 41 41 42 42 42 42 42 42 42 42 42 42 42 42 42 42 43 43 43 43 43 43 43 43 43 43 43 43 43 43 43 44 44 44 44 44 44 44 44 44 44 44 45 45 45 45 45 45 46 46 46 46 46 46 47 47 47 47 47 47 47 47 47 47 47 47 48 48 48 48 48 48 48 49 49 49 49 50 50 50 50 50 50 51 51 51 51 52 52 52 52 52 53 53 54 54 54 55 55 55 55 56 56 56 56 56 56 56 57 57 57 57 57 58 58 58 58 58 59 59 59 59 59 59 59 60 60 60 60 60 61 61 62 63 63 63 63 63 63 64 64 64 64 64 65 65 65 66 66 67 67 67 67 68 68 68 68 68 69 69 69 69 69 70 70 70 70 70 70 71 71 71 71 71 72 72 72 73 73 73 73 73 74 74 74 74 75 75 75 76 76 76 76 76 76 76 77 77 77 77 77 78 79 79 79 80 80 81 82 82 83 84 84 85 86 89 90 91 91 92 93 93 93 93 95 96 96 96 96 97 97 97 98 98 98 98 98 99 Lesotho Papua New Guinea Angola Zambia Pakistan Solomon Islands Vanuatu Congo (Brazzaville) Cameroon Djibouti India Kiribati Laos Myanmar 6 7 10 11 12 12 13 13 13 13 13 14 14 14 14 14 14 15 15 16 16 17 17 17 17 17 17 18 18 18 18 18 18 18 18 18 19 19 19 19 19 19 19 19 19 19 20 20 20 20 20 20 20 20 20 20 21 21 21 21 21 21 21 21 21 21 21 21 21 21 22 22 22 22 22 22 22 22 22 22 22 23 23 23 23 23 23 23 23 23 23 23 23 24 24 24 24 24 24 24 24 24 24 24 24 24 24 25 25 25 25 25 25 25 25 25 25 25 25 25 26 26 26 26 26 26 26 26 26 26 26 27 27 27 27 27 27 27 27 27 27 27 27 28 28 28 28 28 28 28 28 28 28 28 28 28 28 28 28 29 29 29 29 29 29 29 29 29 29 29 29 29 29 29 30 30 30 30 30 30 30 30 30 30 30 30 30 30 30 30 30 30 30 31 31 31 31 31 31 31 31 31 31 31 31 31 31 31 31 32 32 32 32 32 32 32 32 32 32 32 32 32 32 32 32 32 33 33 33 33 33 33 33 33 33 33 33 33 33 33 33 33 33 33 33 33 34 34 34 34 34 34 34 34 34 34 34 34 34 34 34 34 34 34 34 34 34 35 35 35 35 35 35 35 35 35 35 35 35 35 35 35 35 35 35 35 35 35 36 36 36 36 36 36 36 36 36 36 36 36 36 36 36 36 37 37 37 37 37 37 37 37 37 37 37 37 37 37 37 37 37 37 37 37 38 38 38 38 38 38 38 38 38 38 38 38 38 38 38 38 38 38 38 38 38 38 38 38 38 38 38 38 39 39 39 39 39 39 39 39 39 39 39 39 39 39 39 39 39 39 39 39 40 40 40 40 40 40 40 40 40 40 40 40 40 40 40 40 40 40 40 40 40 40 40 41 41 41 41 41 41 41 41 41 41 41 41 41 41 41 41 41 41 42 42 42 42 42 42 42 42 42 42 42 42 42 42 42 42 42 42 42 42 42 42 43 43 43 43 43 43 43 43 43 43 43 43 43 43 43 43 43 43 43 43 43 43 44 44 44 44 44 44 44 44 44 44 44 44 44 44 44 44 44 44 44 44 44 44 44 44 44 45 45 45 45 45 45 45 45 45 45 45 45 45 45 45 45 45 45 45 45 45 45 45 45 46 46 46 46 46 46 46 46 46 46 46 46 46 47 47 47 47 47 47 47 47 47 47 47 47 47 47 47 48 48 48 48 48 48 48 48 48 48 48 48 48 48 48 48 48 48 48 48 48 48 48 48 49 49 49 49 49 49 49 49 49 49 49 49 49 49 49 49 49 50 50 50 50 50 50 50 50 50 50 50 50 50 50 50 50 50 50 50 50 51 51 51 51 51 51 51 51 51 51 51 51 51 51 51 51 51 51 51 51 51 51 51 52 52 52 52 52 52 52 52 52 52 52 52 52 52 52 52 52 52 52 53 53 53 53 53 53 54 54 54 54 54 54 54 54 54 54 54 55 55 55 55 55 55 55 55 55 56 56 56 56 56 56 56 56 56 56 56 56 56 56 56 56 56 56 57 57 57 57 57 57 57 57 57 57 57 57 57 57 57 58 58 58 58 58 58 58 58 58 58 58 59 59 59 59 59 59 59 59 59 59 59 60 60 60 60 60 60 60 61 61 61 61 61 61 61 61 61 61 61 61 61 61 61 62 62 62 62 62 62 62 62 63 63 63 63 63 63 63 63 64 64 64 64 64 64 64 64 64 64 64 64 64 65 65 65 65 65 65 65 65 65 65 65 66 66 66 66 66 66 66 66 66 66 66 66 66 66 66 66 66 67 67 67 67 67 67 67 68 68 68 68 68 68 68 68 69 69 69 69 69 69 69 69 69 69 69 70 70 70 70 70 70 71 71 72 72 72 72 72 72 73 73 73 73 73 73 73 73 73 74 74 74 74 74 74 75 75 75 75 75 75 75 75 76 76 76 76 77 77 77 77 77 77 77 77 78 78 78 78 78 78 78 78 78 79 79 79 79 79 80 81 81 81 81 81 81 81 82 82 82 82 82 82 82 82 83 83 83 84 84 84 84 85 86 86 87 87 87 87 88 88 89 89 90 90 91 91 91 91 91 92 92 92 92 93 93 93 93 94 94 94 95 95 95 95 96 96 96 96 96 96 96 96 97 97 97 97 98 98 98 98 98 99 100
Central African Republic Afghanistan Somalia Guinea−Bissau Chad Eritrea Haiti Guinea South Sudan DR Congo Burundi Niger Sierra Leone Côte d’Ivoire Burkina Faso Uganda Benin Mozambique Madagascar Ethiopia Togo Senegal Liberia Mali Malawi Comoros Rwanda Yemen The Gambia Tanzania Mauritania Panel C cont. Panel D
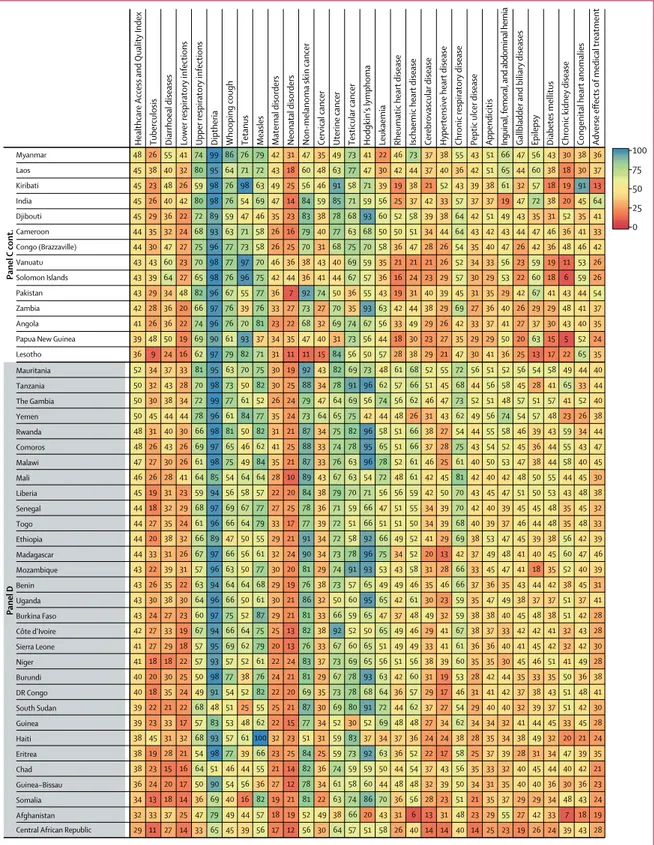
Figure 2: Figure 2: Performance of the HAQ Index and 25 individual causes by the fourth SDI quartile (A), third SDI quartile (B), second SDI quartile (C),
and first SDI quartile (D) in 2015
In addition to the HAQ Index, all causes presented in this figure are scaled 0 to 100, with 100 being the “best” value (ie, lowest observed age-standardised risk-standardised mortality rate by cause) and 0 being the “worst value” (ie, highest observed age-standardised risk-standardised mortality rate by cause) between 1990 and 2015. Within each SDI quartile, countries and geographies are ordered by their HAQ Index in 2015. HAQ Index=Healthcare Access and Quality Index. SDI=Socio-demographic Index.
several countries in Latin America and the Caribbean
were in the first decile. By 2015, nearly all countries and
territories saw increases in their HAQ Index, yet the gap
between the highest and lowest HAQ Index levels was
wider in 2015 (66·0) than in 1990 (61·6). The tenth decile
included many countries in western Europe, Canada,
Japan, and Australia, while the UK and the USA were
in the ninth decile. Latin America and the Caribbean
had varied HAQ Index levels, spanning from Haiti
(first decile) to Chile (seventh decile). By 2015, Vietnam
and Malaysia reached the sixth decile; China and
Thailand rose to the seventh decile; and Turkey and
several countries in the Middle East and Eastern Europe
improved to the eighth decile. In sub-Saharan Africa,
Cape Verde (fifth decile), Namibia, South Africa, Gabon,
and Mauritania (fourth decile) had the highest HAQ
Index levels in 2015, rising from their positions since
1990. At the same time, many sub-Saharan African
countries remained in the first decile in 2015, including
the Democratic Republic of the Congo, Niger, and
Zambia. In Asia and the Pacific, a number of countries
also experienced relatively low HAQ Index levels:
Afghanistan and Papua New Guinea (first decile);
Pakistan and India (second decile); and Indonesia,
Cambodia, and Myanmar (third decile).
Comparing the overall HAQ Index with its component
parts showed substantial heterogeneity in 2015, even
within similar SDI quartiles (figure 2). Within the fourth
SDI quartile, most geographies performed well on several
vaccine-preventable diseases, including measles,
diph-theria, tetanus, and whooping cough, yet some experienced
lower values for communicable conditions such as lower
respiratory infections. Geographies in the fourth SDI
quartile generally performed worse for cancers, but many
recorded values exceeding 90 for cervical and uterine
cancers. Nearly all geographies in the fourth SDI quartile
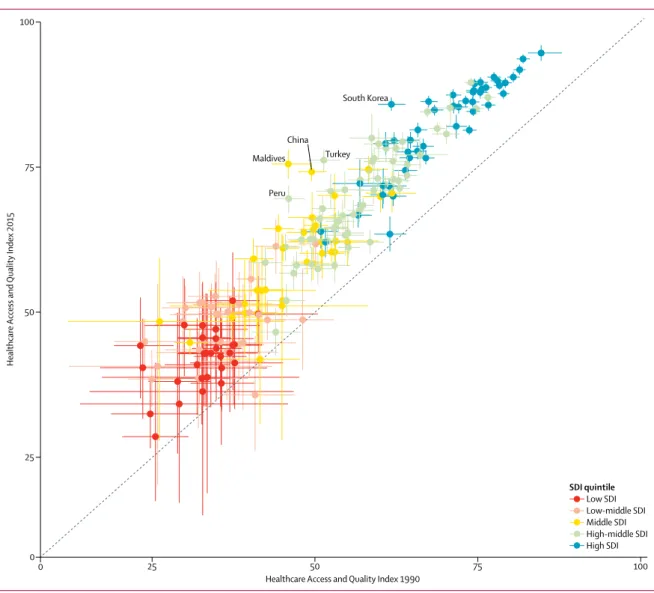
Figure 3: Comparison of 1990 and 2015 HAQ Index estimates, with uncertainty, by country or territory
Geographies with the largest improvement in the HAQ Index from 1990 to 2015 are labelled. All countries and territories are colour-coded by SDI quintile in 2015. HAQ Index=Healthcare Access and Quality Index. SDI=Socio-demographic Index.
0 0
25 50 75 100
Healthcare Access and Quality Index 1990
Healthcare Access and Quality Index 2015 75 100 South Korea Maldives Turkey Peru 50 25 China SDI quintile Low SDI Low-middle SDI Middle SDI High-middle SDI High SDI
surpassed 90 for maternal disorders, while geographies in
the third and second SDI quartiles showed far more
diverse results. A similar pattern emerged in causes for
which routine surgeries can easily avert mortality (eg,
appendicitis and hernias) among third and second SDI
quartile geographies, with some countries performing
fairly well for such causes (eg, China, Turkey, Sri Lanka)
while others lagged behind (eg, Mexico, Indonesia, South
Africa). Many geographies in the third and second SDI
quartiles not only had fairly low values for NCDs such as
diabetes, chronic kidney disease, and hypertensive heart
disease, but also fared poorly on a subset of infectious
diseases (ie, tuberculosis, lower respiratory infections, and
diarrhoeal diseases) and neonatal disorders. In the first
SDI quartile, neonatal and maternal disorders,
tuberculosis, lower respiratory infections, and diarrhoeal
diseases often led to the lowest scaled values, while most
geographies experienced relatively better performances for
a subset of cancers. Notably, several countries in the
first SDI quartile recorded fairly high values for
vaccine-preventable diseases. By contrast, nearly all of these
countries and territories saw values lower than 50 for
causes associated with routine surgeries and more
complex case management (eg, epilepsy, diabetes, and
chronic kidney disease).
For nearly all countries and territories, the HAQ Index
has markedly improved since 1990, with 167 recording
statistically significant increases by 2015 (figure 3).
Because of incomplete data systems, uncertainty bounds
were relatively large for lower-SDI countries, whereas
uncertainty for higher-SDI countries—places where data
systems are more complete and of high quality—was
much smaller. Five countries with the largest significant
increases for the HAQ Index were South Korea (high
SDI), Turkey and Peru (high-middle SDI), and China
and the Maldives (middle SDI). Among low-middle-SDI
and low-SDI countries, Laos and Ethiopia saw among
the greatest improvements in the HAQ Index; however,
these gains were less pronounced due to wide
uncertainty bounds.
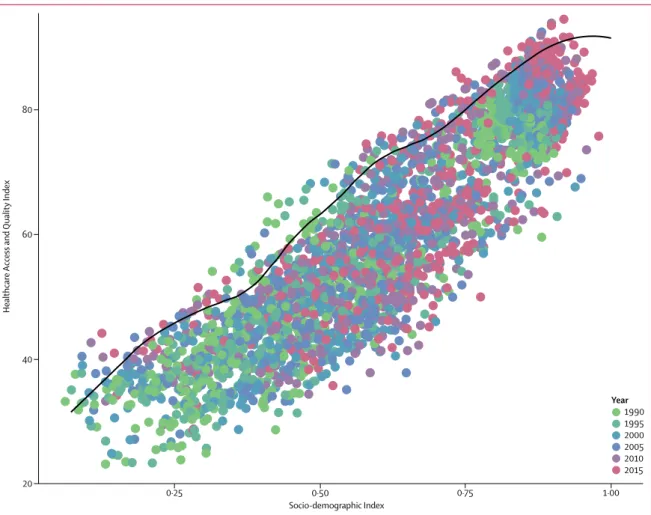
Based on a frontier analysis, we found that, as SDI
increases, the highest observed HAQ Index values also
Figure 4: Defining the HAQ Index frontier on the basis of SDI
Each circle represents the HAQ Index and level of SDI for a given geography-year, and circles are colour-coded by year from 1990 to 2015. The black line represents the HAQ Index frontier, or the highest observed HAQ Index value, at a given level of SDI across years. HAQ Index=Healthcare Access and Quality Index. SDI=Socio-demographic Index. 0·25 0·50 0·75 1·00 20 Healthcare Access and Quality Index Socio-demographic Index 40 60 80 Year 1990 1995 2000 2005 2010 2015
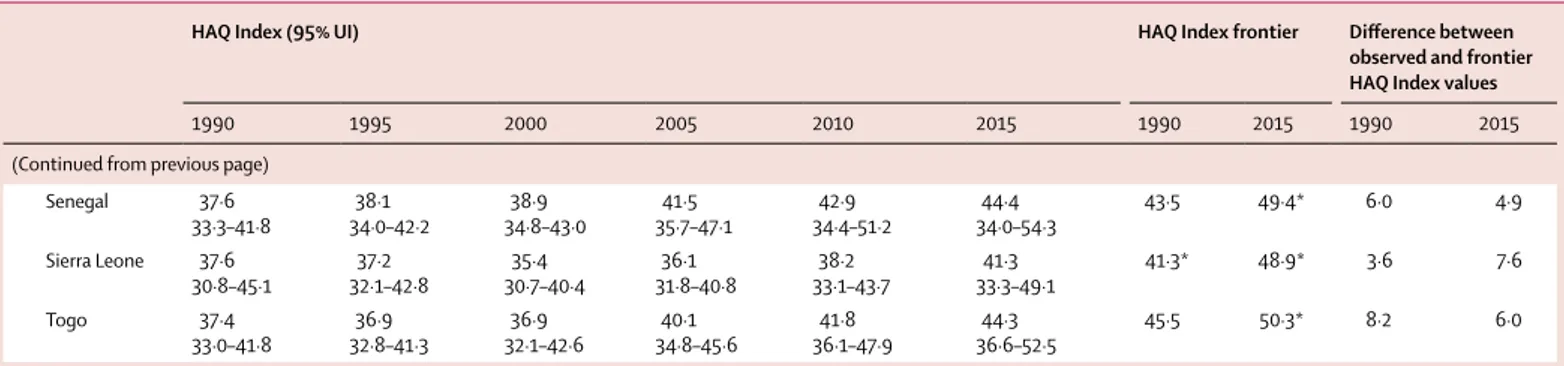
HAQ Index (95% UI) HAQ Index frontier Difference between observed and frontier HAQ Index values
1990 1995 2000 2005 2010 2015 1990 2015 1990 2015
Global 40·7
39·0–42·8 41·0–44·542·7 43·2–46·744·8 46·3–49·647·8 49·5–52·751·0 52·2–55·453·7 61·9 73·8 21·2 20·1 Southeast Asia, east
Asia, and Oceania 42·8–47·144·8 46·1–50·348·1 49·3–53·051·1 53·7–57·355·4 58·3–61·760·0 61·7–65·463·5 57·6 75·0 12·8 11·5 East Asia 49·5 47·5–51·9 51·8–55·953·8 56·0–59·757·8 61·8–65·463·6 68·0–71·369·7 72·2–75·473·8 57·1 75·4 7·6 1·6 China 49·5 47·4–51·8 51·7–55·953·7 55·9–59·757·8 61·9–65·663·7 68·2–71·569·9 72·5–75·874·2 56·2 75·4* 6·7 1·2 North Korea 53·1 46·2–59·8 49·5–61·655·8 50·2–61·656·0 52·8–62·357·5 56·0–64·660·4 57·2–67·162·3 70·6 69·1 17·5 6·9 Taiwan 64·2 62·5–66·4 65·1–68·866·8 68·5–71·970·1 72·1–75·473·6 75·6–78·677·1 74·7–80·477·6 76·8 88·6 12·6 11·0 Southeast Asia 38·6 35·8–41·4 38·4–43·440·9 40·7–45·443·0 43·7–48·546·0 47·1–51·849·4 49·5–54·752·1 59·0 74·0 20·4 21·9 Cambodia 30·0 26·5–33·6 28·1–34·931·3 30·8–37·434·1 37·6–44·040·7 42·2–48·545·5 47·2–54·650·7 45·4 62·3 15·3 11·6 Indonesia 37·2 33·4–41·4 36·3–43·739·7 38·3–44·541·3 40·9–46·743·8 43·7–49·946·8 45·3–52·949·2 60·6 74·4 23·4 25·2 Laos 23·8 19·1–29·3 21·5–30·425·7 25·0–32·728·7 30·4–36·933·6 36·4–42·839·6 40·7–48·944·9 46·3 63·9 22·5 19·0 Malaysia 54·2 52·2–56·5 55·3–59·257·2 58·5–62·160·3 61·5–64·963·2 62·3–65·763·9 64·1–69·266·6 69·3 81·5 15·1 14·9 Maldives 45·9 43·3–49·2 49·4–54·351·6 57·3–61·359·3 65·4–69·067·1 71·1–74·672·9 73·0–78·075·5 50·1 73·2* 4·3 ·· Mauritius 53·6 51·6–56·1 55·6–59·157·3 58·2–61·859·8 60·1–63·561·8 61·6–65·163·3 64·0–67·565·7 68·6 79·0 15·0 13·3 Myanmar 29·7 22·4–37·5 23·9–39·531·6 26·9–43·134·7 31·6–48·139·5 36·2–52·644·4 40·3–56·348·4 45·8 64·9 16·1 16·5 Philippines 45·0 43·2–47·1 44·3–48·246·1 45·7–49·547·5 45·8–49·647·6 47·8–51·549·6 49·9–54·252·0 63·8 74·1 18·8 22·1 Sri Lanka 56·9 55·2–58·5 57·5–61·359·5 58·3–62·260·4 62·0–65·463·8 67·5–70·368·9 69·5–76·072·8 66·3 76·8 9·4 4·1 Seychelles 50·7 48·6–53·2 52·9–57·455·1 56·4–60·658·5 59·1–63·161·1 61·7–65·763·9 63·6–68·566·1 72·2 80·9 21·5 14·8 Thailand 52·4 50·1–54·9 53·7–58·155·9 57·3–61·659·3 62·6–67·064·8 66·1–70·568·4 68·0–73·870·8 66·5 76·8 14·1 5·9 Timor-Leste 32·2 27·2–39·6 30·9–41·335·4 33·7–45·238·2 38·7–48·142·6 44·4–53·248·4 46·9–57·051·6 46·6 59·1 14·3 7·5 Vietnam 49·5 45·8–54·0 48·8–56·952·4 52·7–59·255·8 55·4–64·259·6 58·5–67·763·0 62·1–70·666·3 52·2* 73·5 2·7 7·2 Oceania 33·8 28·4–39·8 29·1–40·734·8 29·8–41·735·4 30·0–42·636·1 31·4–43·937·7 33·5–46·440·3 51·3 62·9 17·5 22·7 American Samoa 51·8–57·554·6 52·4–58·655·6 57·7–62·860·2 59·0–64·261·7 60·5–65·763·1 59·8–66·763·3 74·0 77·4 19·4 14·1 Federated States of Micronesia 41·1 33·4–50·2 35·9–51·943·6 38·3–54·946·8 40·9–57·649·8 42·0–59·251·5 44·5–61·553·8 62·5 73·3 21·5 19·5 Fiji 43·9 40·1–47·8 40·6–47·744·1 41·7–47·744·7 41·9–48·145·0 42·0–48·945·4 42·5–50·646·6 69·2 76·1 25·3 29·6 Guam 61·5 59·1–64·0 61·3–66·063·6 64·9–69·267·0 64·1–68·566·4 61·4–65·963·7 60·5–66·563·4 81·7 89·8 20·2 26·3 Kiribati 35·4 31·8–39·3 33·0–40·036·5 36·3–43·439·7 37·0–44·641·1 39·0–47·743·6 40·0–49·744·9 53·3 61·7 17·9 16·8 Marshall Islands 41·2 37·4–45·2 39·3–47·143·2 39·0–48·143·2 40·2–48·644·3 42·3–51·446·8 45·7–54·249·8 56·8 71·4 15·7 21·7 Northern Mariana Islands 56·7–64·060·5 62·7–68·665·5 66·6–71·268·9 69·4–73·371·4 70·6–75·072·7 68·6–74·771·8 82·2 87·0 21·7 15·3 (Table 3 continues on next page)