Multi-criteria assessment of biomethane production
from waste and residual feedstocks of
Emilia-Romagna (Italy)
Giovanni Zanaroli
Master
's thesis
SLU, Swedish University of Agricultural Sciences Faculty of Natural Resources and Agricultural Sciences Department of Energy and Technology
Title: Multi-criteria assessment of biomethane production from waste and residual feedstocks of Emilia-Romagna (Italy)
Author: Giovanni Zanaroli
Supervisor: Åke Nordberg, Department of Energy and Technology, SLU
Assistant supervisor: Niclas Scott Bentssen, University of Copenhagen, Department of Geosciences and Natural Resources Management
Examiner: Björn Vinnerås, Department of Energy and Technology, SLU Course: Independent project in Environmental Science - Master's thesis Course code: EX0431
Credits: 30 Level: A2E
Course coordinating department: Department of Aquatic Sciences and Assessment Programme/education: Environmental Sciences (EnvEuro)
Series title: Examensarbete (Institutionen för energi och teknik, SLU), 2019:01 ISSN: 1654-9392
Biomethane can be produced by anaerobic digestion of residues or wastes and it can be used as a renewable fuel for transport. It is associated with reduced GHG emissions, offsetting of fossil fuels and of mineral fertilizers, waste management and nutrient recycling in agriculture. Six suitable feedstocks for the production of bio-methane are compared through a multi-criteria assessment designed by the Linköping University and applied to the context of Emilia-Romagna region in Italy. The aim of this work is to provide decision-making support on the choice between feedstocks by identifying opportunity, technical feasibility and environmental sustainability of pro-ducing biomethane out of them. Feedstocks availability, current uses and accessibil-ity in relation to the case study are assessed. In addition, technical aspects such as suitability for anaerobic digestion, biomethane yields and digestate quality, are com-plemented by a life cycle assessment including climate impact and energy balance for each feedstock. The results suggest that there are strengths and weaknesses for every feedstock and that the choice depends on the objective to be achieved and on the specific conditions. In a nutshell, the agricultural feedstocks considered (cow ma-nure and wheat straw) and the agro-industrial (milk and cheese industry by-products and wine industry by-products) respectively have very high and medium theoretical availability and poor or satisfactory suitability for production of biomethane and bio-fertilizer through single-feedstocks digestion. Organic municipal solid waste (OMSW) and pig slaughterhouse wastes (PSW) have low theoretical availability but are well suitable for the production of biomethane. PSW is also well suitable as bio-fertilizer. From an environmental point of view, PSW and OMSW are associated to the best performances and liquid manure to the worst if the assessment is done ac-cording to the RED guidelines. By applying a system expansion to the environmental assessment different outcomes were obtained and the sensitivity of the parameters chosen was studied through sensitivity analysis. To conclude, the production of bio-methane from the selected feedstocks can relevantly contribute to the regional targets for the transport sector and the methodology of this assessment is useful to deal ho-listically with the feedstock-choice while providing decision-oriented information.
Il biometano può essere prodotto tramite digestione anaerobica a partire da substrati o matrici residuali e di scarto ed essere utilizzato come combustibile rinnovabile per il trasporto. E’ associato alla riduzione delle emissioni di gas a effetto serra, alla so-stituzione dei combustibili fossili e dei fertilizzanti minerali, alla gestione dei rifiuti e al riciclo dei nutrienti in agricoltura. Sei substrati da adibire alla produzione di bio-metano sono confrontati attraverso un analisi multi-criteriale ideata dall’Università di Linköping e applicata al contesto della regione Emilia-Romagna in Italia. Lo scopo di questo lavoro è di provvedere supporto nella scelta fra le diverse matrici tramite l’identificazione della loro disponibilità, della fattibilità tecnica e della sostenibilità ambientale della produzione di biometano a partire da esse. La disponibilità dei sub-strati, gli usi correnti e l’accessibilità in relazione al caso studio sono considerate. Agli aspetti tecnici -come la compatibilità per la digestione anaerobica, la resa in metano e la qualità del digestato- è aggiunta una analisi ambientale del ciclo di vita che include l’impatto climatico e il bilancio energetico per ogni substrato. I risultati evidenziano punti di forza e debolezze per ciascuno dei casi considerati e la scelta fra essi dipende dagli obiettivi che si vogliono raggiungere e dalle condizioni specifiche. In estrema sintesi, si può dire che le matrici agricole considerate (letame e liquame bovino e paglia da frumento) e quelle agro-industriali (residui lattiero-caseari e resi-dui di vinificazione) presentano, rispettivamente, disponibilità teoriche molto e me-diamente alte in regione ma si prestano in modo scarso o soddisfacente alla produ-zione di biometano e di bio-fertilizzante nel caso di mono-digestione. La fraprodu-zione organica dei rifiuti differenziati (OMSW) e gli scarti di macellazione suina (PSW) sono disponibili in scarse quantità ma si prestano bene dal punto di vista tecnico. I PSW presentano anche una buona qualità del digestato. Attenendosi alle linee guida della RED, PSW e OMSW risultano avere le migliori performance dal punto di vista ambientale, mentre il liquame bovino la peggiore. Inoltre, le variazioni dei risultati in seguito a espansione del sistema e sensitivity analysis sono discusse. Per conclu-dere, il contributo potenziale dei substrati considerati per il settore dei trasporti re-gionale e per la riduzione delle emissioni a effetto serra si è dimostrato elevato e la metodologia utilizzata è particolarmente adatta per affrontare olisticamente la com-plessità del tema e ottenere, al tempo stesso, chiare indicazioni decisionali.
Today, everybody seems to be aware that our society would need to get rid of its dependency on fossil resources because of the disastrous conse-quences on the environment. The plastic floating in the oceans and climate change are by now part of the daily discussions and they are a source of deep concern for many people. The transport sector has played an important role for the situation where we are now: the extraction and burning of fossil fuels by cars, trucks, planes and boats are relevantly contributing to climate change, as I explain in the introduction (Section 1.1).
Several solutions and alternative fuels for the transport sector have been proposed. One of the most promising and fast-growing solutions in the world is biomethane, also known as biogas. Biomethane is not different from natural gas (98 to 100% methane) except that it is self-produced with a biological process instead of being extracted from underground prehistoric reserves. Some micro-organisms are able to produce methane and other gasses out of organic feedstocks (such as food, plant material, animal manure etc.). Bio-methane can be used as a transport fuel, as well as for other uses; the liquid residue of the process (digestate) is rich in carbon and nutrients and can be used in agriculture.
Switching from a fossil fuel to biomethane reduces importantly the cli-mate impact of a vehicle, especially if biomethane is produced out of recycled feedstocks such as waste and agricultural or industrial residues. However each feedstock is associated to a different performance in terms of quantity and quality of the products obtained and to a slightly different process. In this work, I’ve dealt exactly with those issues: the performances of six different feedstocks were compared from a technical and environmental point of view through a mixed set of methods, including literature review and Life Cycle Assessment approach. In order to select the feedstocks, I investigated the availability of many residual feedstocks in the Italian region of Emilia-Ro-magna. Not only the theoretical availability of each feedstock, but also the
Popular summary
geographical distribution and the “real” availability -determined by accessi-bility, seasonality and competing uses of the feedstock- were investigated.
What I could get out of this analysis is that the agricultural feedstocks considered (cow manure and wheat straw) are very abundant and available in the region, hence they can contribute relevantly to the production of bio-methane. The availability of other feedstocks in Emilia-Romagna is much more limited, but it is in some cases (for example for pig slaughterhouse wastes) partly compensated by a high specific yield of biomethane and a high nutrient content of the digestate. Overall, the use of biomethane produced out of any of the feedstocks considered except for one (cow liquid manure) would lead to a reduction of at least 50% in greenhouse gas emissions compared to the use of fossil fuels (diesel or gasoline), according to the conditions as-sumed in this study.
In short, the availability of suitable feedstocks for its production -together with the simplicity of the process and the environmental benefit- stresses the interest for biomethane development in the region and at larger scale. A com-prehensive analysis including and expanding the scope of this work is recom-mended in order to select the optimal feedstocks for production of bio-methane and before any implementation is carried out. To conclude, I believe that biomethane might not save the world alone but it is definitely worth a try!
Abstract 1 Abstract (Italiano) 2 List of tables 9 List of figures 10 Abbreviations 11 1 Introduction 13
1.1 State of the art 13
1.2 Research objectives 15
1.3 Limitations of the study 16
2 Background information 17
2.1 Definition and history of biomethane 17
2.2 The investigated feedstocks 19
2.3 The case study (Emilia-Romagna) 21
2.4 Multi-criteria assessment as a holistic and decision making tool for the choice
between feedstocks 21
3 Methodology 26
3.1 Choice of the feedstocks 26
3.2 Choice of the parameters 26
3.3 Assessment of feedstocks availability 28
3.4 Assessment of the technical suitability 29
3.5 Assessment of environmental sustainability 33
3.5.1 Energy balance 33
3.5.2 Climate impact 36
3.5.3 System expansion 38
3.5.4 Sensitivity analysis 40
4 Results 41
4.1 Feedstocks availability 41
4.1.1 Amounts 41
4.1.2 Control and competition over the feedstocks 42 4.1.3 Geographical and physical accessibility 44 4.2 Technical suitability of the selected feedstocks for production of biomethane
and nutrients recycling 45
4.2.1 Feedstock characteristics and Suitability for anaerobic digestion 45
4.2.2 Methane yield 47
4.2.3 Biomethane volume and corresponding energy value 49
4.2.4 Nutrient content 50
4.2.5 Amount and value of bio-fertilizers 52
4.2.6 Suitability for bio-fertilizers 53
4.3 Environmental sustainability 53 4.3.1 Energy balance 53 4.3.2 Climate Impact 54 4.3.3 System expansion 55 4.3.4 Sensitivity analysis 56 4.4 Aggregated results 60 5 Discussion 61
5.1 Critical reflections over the methodology 61
5.2 Discussion over the results 63
5.2.1 Organic municipal solid waste (OMSW) 63
5.2.2 Cow manure 65
5.2.3 Pig slaughter-house waste (PSW) 66
5.2.4 Wheat straw 67
5.2.5 Milk and Cheese Industry by-product 68
5.2.6 Wine-making residues 69
6 Conclusions 71
References 74
Acknowledgements 83
Appendix 1: Grading scale used for geographical and physical accessibility of the selected feedstocks (from Ammenberg et al., 2017) 84
Appendix 2: Density maps of feedstocks production sites (provided by GoBiom project): (a) non-dangerous waste handling sites; (b) cow
manure and cow slurry; (c) slaughterhouse waste; (d) milk/cheese-industry residues; (e) wine-making by-products. 85 Appendix 3: Population density map of Romagna (from
Emilia-Romagna Region website) 86
Appendix 4: Grading scale for the indicator “control and competing interests over the feedstocks” (from Ammenberg et al., 2017) 87
Appendix 5: Grading criteria for the indicator “suitability for bio-fertilizers” (from Ammenberg et al., 2017) 88
Appendix 6: Excel calculations for energy balance 89
Table 1. Research matrix 27 Table 3. Grading scale for biomethane yield from Ammenberg et al. (2017) 30 Table 4. Energy output obtainable from the selected feedstocks 31 Table 5. Grading scale for biomethane amount (from Ammenberg et al., 2017) 31 Table 6. Values used for baseline scenario PE inputs 35 Table 7. Grading scale for the energy balance of the selected feedstocks (from
Ammenberg et al., 2017) 36
Table 8. Sources of GHG emissions, amounts and CO2 equivalent conversion
factors 38
Table 9. Grading scale for the indicator GHG emissions savings (from Ammenberg
et al., 2017) 38
Table 10. Selected feedstocks availability in Emilia-Romagna 41 Table 11. Control and competing interests over the selected feedstocks 43 Table 13. Geographical and physical accessibility of the selected feedstocks 44 Table 14a. Feedstock characteristics of OMSW, solid and liquid cow manure and
PSW 45
Tabell 14b. Feedstock characteristics of wheat straw, milk and cheese industry
by-products (whey) and wine by-by-products 46
Table 15a. Theoretical biogas (G0) and methane yield (B0) of the first 3 selected
feedstocks. Standard deviation is expressed in parenthesis. 48 Table 15b. Theoretical biogas (G0) and methane yield (B0) of the last 3 selected
feedstocks. Standard deviation is expressed in parenthesis. 49 Table 16. Amounts of biogas and biomethane potentials per year from selected
feedstocks in Emilia-Romagna 50
Tabell 17b. Nutrient content for the feedstocks whey and wine by-products 52
Table 18 Gross nutrient content 52
Table 19. PEIO ratio of selected feedstocks 54
Table 20. GHG emissions reduction 55
Table 21. Aggregated results 60
Figure 1. Grading scale for the feedstocks’ nutrient content from Ammenberg et al.
(2017) 32
Figure 2. Grading scale for amount and value of bio-fertilizers from Ammenberg et
al. (2017) 33
Figure 3. GHG emissions allocation method. The grey arrows with a dashed line
indicate material flows while the black solid lines represent emissions
(taken from Manninen et al., 2013). 37
Figure 4. GHG emissions per MJ of biomethane produced 55
Figure 5. GHG emissions of the feedstocks with system expansion 56
Figure 6. Sensitivity analysis for the PEIO ratio 57
Figure 7. Sensitivity analysis for the climate impact indicator 58
Figure 8. Sensitivity analysis for the system expansion scenario of the climate
impact indicator. 59
CRPA ILUC ISTAT LCA MCA OMSW PE PEIO PSW TS VS WW
Centro Ricerche Produzioni Animali (Research Centre on for Ani-mal Production)
Indirect Land Use Change
Italian National Statistics Institute Life Cycle Assessment
Multi Criteria Assessment
Organic fraction of Municipal Solid Waste Primary Energy
Primary Energy Inputs to Outputs ratio Pig Slaughterhouse Waste
Total solids (Dry matter)
Volatile solids (Organic dry matter) Wet weight
The relevance of the topic of this report is introduced in Section 1.1. The bigger picture is presented, with drivers such as climate change and the transport sector affecting the global situation and calling for solutions. Biomethane is contextualized among the biofuels and the state of the art of literature about biomethane feedstocks is provided. In Section 1.2, the research objectives of this report are presented, fol-lowed by a summary of the main criteria and parameters adopted. In Section 1.3, the limitations of the assessment are outlined.
1.1 State of the art
CO2 emissions from the transport sector accounted for 23% of the global
energy-related emissions in 2014 and have been increasing by 2.5% annually between 2010 and 2015, according to the report released in October 2018 by the Intergovernmental Panel on Climate Change (IPCC, 2018). The transport sector is the least diversified sector, with an almost complete reliance on oil products for its energy needs and therefore contributing relevantly to the global oil final-energy demand (ibid., Fenton & Kanda, 2017).
Biofuels have become a topic of interest in the last few years in connection with the struggle to mitigate GHG emissions and to reduce the dependency on fossil fuels associated to the transport sector. Even though the global production of biofuels is still limited today compared to the production and use of fossil fuels, biofuels are perceived by many as a “bridge”, as a complementary solution or even as an alter-native to electric vehicles and to other solutions for the transport sector of the future (Börjesson et al., 2009; Magnusson & Berggren, 2018). Among the scenarios drawn by international scientists and policy makers for the reduction of CO2 emissions in
the transport sector by 2050, biofuels often figure as a key element for decarboniza-tion and in particular for heavy-duty vehicles, aviadecarboniza-tion and shipping (IPCC, 2018).
1 Introduction
At the same time, the category of biofuels has received severe critics in the past years. One of the main arguments which were brought up by several NGOs and researchers is ethical, and it concerns the indirect change of land use (ILUC) and the exploitation of resources for the purpose of growing energy crops instead of food crops, while poverty and food scarcity still affect a large part of the global popula-tion (Börjesson et al., 2009; Scarlat et al., 2018). Another argument along this line concerns the sustainability of biofuels in terms of emissions reduction, especially for the case of imported biofuels or biofuels produced with feedstocks coming from remote areas of the world (Börjesson et al., 2009; Åhman, 2010).
The critics against unethical and unsustainable biofuels have contributed to shift the interest from the so called “food-based” or “first-generation” biofuels to “ad-vanced” or “second-generation” biofuels. Advanced biofuels are produced out of materials at the end of their life cycle, such as bio-wastes, residues and by-products (Mitkidis et al., 2018). In order to disincentivise or phase out the production of food-based biofuels, policy efforts are being made (Scarlat et al., 2018). In the Renewable Energy Directive of the EU (RED I) from 2009, waste-based biomethane is double-counted in the calculations for the achievement of national targets in sustainable transport. Compared to the RED I, it was announced that the upcoming RED II for the period 2021-2030 will tackle the issue more directly (Mitkidis et al., 2018). One of the measures expected is the setting of a decreasing cap (starting from 7% and reaching 3.8% in 2030) on the maximum contribution of food-based biofuels to the renewable energy targets (Bitnere, 2017; European Commission, 2016).
Biomethane is gaining quite a lot of attention in the past recent years among the second-generation biofuels. Biomethane is obtained after upgrading (removal of carbon dioxide) of biogas, which is produced by anaerobic digestion of any biode-gradable feedstock.When the feedstocks used are bio-wastes, residues or by-prod-ucts, the biomethane produced can be considered “advanced”. Biomethane is pri-marily interesting for use as a transport fuel with the purpose of replacing fossil fuels and reducing emissions. Furthermore, anaerobic digestion also generates a nu-trient-rich co-product (digestate), which can be used as an organic fertilizer and off-setting mineral fertilizers by making agronomic use of the digestate (Patterson et al., 2011).
Which feedstocks is best to use for the production of biomethane is an important question among the issues which are being debated. Research has already been made over many aspects of biomethane production, use and implementation. Hijazi et al. (2016) asserts that “the type of feedstock is a determining factor for the environmental impacts of biogas systems”.
Recent studies have looked into feedstocks available at different scale, assessing potential energy contributions, technical suitability for biomethane production, as-sociated environmental benefit, public opinion and economic profitability (Åhman,
2010). However, there is a lack in comprehensive and systematic studies which are able to consider “the full picture” when comparing different feedstocks for bio-methane production (Ammenberg et al., 2017).
1.2 Research objectives
In this report, a multi-criteria assessment is carried out for different waste-based feedstocks which can be used for the production of biomethane. Feedstock availa-bility, technical suitability and environmental sustainability are investigated.
The region Emilia-Romagna, situated in the Po Valley of northern Italy, is taken as a case study for this report. Emilia-Romagna became one of the pulling regions for biogas development in Italy in the recent years and has been referred to as a potential “biomethane hub” due to some favourable characteristics described in the background (Patrizio & Chinese, 2016). The national incentive scheme, in force since March 2018 as part of the Biomethane Decree, aims at enhancing production of biomethane from wastes and by-products (Ministero dello Sviluppo Economico, 2018). Hence, a multi-criteria comparison between some of the relevant waste-based feedstocks available in the region recently became of great actuality.
In this study, the multi-criteria assessment (MCA) is carried out for different waste-based feedstocks, which can be used for the production of biomethane and is based on the following research questions:
1. What is the availability of the selected feedstocks within the Italian region of Emilia-Romagna?
2. What is the technical suitability of the selected feedstocks for the production of biomethane and bio-fertilizer through anaerobic digestion?
3. Is it reasonable from an energy and environmental perspective to produce bio-methane from the selected feedstocks?
The aim of this work is to provide decision-making support for public and private bodies on the choice between waste-based biomethane feedstocks by identifying opportunities and discussing their feasibility and environmental sustainability. The criteria included in the MCA are socio-geographical, technical and environ-mental. For the socio-geographical aspects, theoretical and real availability of the feedstocks are considered, as well as their geographical distribution and accessibil-ity in the region. For the technical aspects, methane yield, nutrient content, suitabil-ity for anaerobic digestion and suitabilsuitabil-ity for the use as bio-fertilizer are considered. For the environmental aspects of biomethane production from the feedstocks, the
net energy balance between inputs and outputs as well as the climate impact (in terms of GHG emissions) are assessed.
1.3 Limitations of the study
The feedstocks selected for the MCA of this report are: • Organic fraction of municipal solid waste (OMSW) • Cow manure
• Pig slaughterhouse waste (PSW) • Wheat straw
• Milk and cheese industry by-products • Wine industry wastes
The report is limited to the Emilia-Romagna region and to present time. Con-cerning the process, it is assumed that each feedstock is used individually and not in co-digestion with other feedstocks. The biomethane produced is assumed to be upgraded and used as a fuel for transport, while the digestate produced is assumed to be used, at least for the solid fraction, as bio-fertilizer in agriculture.
Section 2.1 provides background information about characteristics and production of biomethane, followed by a short summary concerning technological development and possible uses of the gas, and by an introduction to the role played by digestate for the recycling of nutrients. Sections 2.2 and 2.3 provide, respectively, background information about the six feedstocks investigated and about the case study. Section 2.4 introduces the approach of Multi Criteria Analysis in the context of system anal-ysis and provides in-depth background information about the parameters consid-ered in the assessment.
2.1 Definition and history of biomethane
What is biomethaneBiomethane is an upgraded version of biogas, which -instead of being composed by methane (roughly 60%), carbon dioxide (roughly 40%) and other gasses- is pu-rified to almost 100% methane. As also biogas, biomethane is the product of micro-biological degradation of organic substrates under anaerobic conditions.
The process of methane formation consists of four main steps, which depend on different consortia of microorganisms (Weiland, 2010). During the first two steps -hydrolysis and fermentation- the complex organic materials are reduced to simpler form and transformed in intermediary products (such as alcohols, fatty acids, lactic acid and also hydrogen gas and carbon dioxide) thanks to strict anaerobic and fac-ultative anaerobic bacteria (ibid). Then anaerobic oxidation takes place and all fatty acids are converted to hydrogen gas and carbon dioxide or to acetate. During the fourth step, methane formation, two syntrophic groups of microorganisms (respec-tively, hydrogen and acetate users) convert the obtained components to methane (ibid.).
Once that methane is formed, the gas is purified from carbon dioxide and from other gaseous co-products of methane (i.e volatile nitrogen). This step, known as
2 Background information
“Upgrading”, can be done in several ways and with different technologies. The most common upgrading technologies are high-pressure water-scrubbing and membrane technologies (i.e ammine membrane). The carbon dioxide which is sequestrated can be collected and re-used for example in soft drinks industry or algae breeding, so that the release to the atmosphere can be avoided. Depending on the transport sys-tem and on the final use, the upgraded gas needs to be compressed to a certain pres-sure. Alternatively, biomethane can be liquified.
Digestate, the co-product of biomethane, needs to be handled once that the an-aerobic digestion phase is over (approximately after 30 days). Depending on its characteristics and on factors such as the distance from the field where it will be spread, digestate can be handled differently. The most straightforward pathway is to transport and spread the digestate the way it is after anaerobic digestion, however a phase-separation step is often introduced in order to separate the liquid phase from the solid and circulate it in the digestor, so to reduce the volumes which need to be transported to the field. Different separation technologies have different separation efficiencies in terms of nutrients accumulation: for example, decanter and discon-tinuous centrifuges are associated to higher efficiency than screw press (Drosg et al., 2015). In addition, further treatments of the solid and liquid phases can be ap-plied in order to enhance the availability of the nutrients and other characteristics of the digestate (ibid).
Biomethane as an energy carrier and a green fuel
Biogas is well known and produced since the 1950s. At that time, biogas was considered as a by-product of processes such as waste water treatment and generally it was unused or used to heat the buildings around the production site. In the 1990s, after the oil crises and the raising of environmental concerns, biogas started to gain interest as a potential renewable energy source. It has been used for heat and elec-tricity generation.
More recently, upgrading to biomethane was implemented in order to valorise the gas better than as raw gas. Once upgraded and compressed or liquified, bio-methane can replace carbon natural gas (CNG) -as transport fuel for CNG vehicles and as gas for domestic uses- or be used for the generation of electricity.
Biomethane can be stored and can be transported through the existing gas grids or by truck. It is appreciated for being a renewable source of energy and being less dependent on climatic conditions than other renewable forms of energy (i.e wind and solar power).
Agronomic use of digestate and circular economy
What is also fascinating about biogas production is its transboundary and cyclic nature. During biogas production, feedstocks at their end-life such as municipal
organic waste, agricultural residues and industrial bio-wastes are used as feedstocks for the anaerobic digestion. Everything which is not fermented to biogas during an-aerobic digestion ends in the digestate. Digestate has little methanogenic potential but can be used in agriculture due to its content of carbon, macronutrients (nitrogen, phosphorus and potassium) and micronutrients.
In this way the cycles of materials at their end-life can be closed and materials normally requiring a disposal cost can gain an economic value. From an environ-mental point of view, the recycling of nutrients through spreading of the digestate is also interesting because it can contribute to the offset of mineral fertilizers.
2.2 The investigated feedstocks
It is defined “feedstock” any substance or material which can be used as primary input for the process of biomethane production. The feedstocks investigated in this report are wastes and residues available in the region. It is defined “residue” any substance or material which is not deliberately produced during a production pro-cess (Ministero dell’ambiente e della tutela del territorio e del mare, 2017). No dis-tinction is made in this report between the terms “by-product” and “residue”. Ac-cording to the Italian regulation (ibid), a residue is characterized by: 1) being origi-nated from a production process which is not primarily aimed at producing the feed-stock; 2) to have some utilization besides disposal; 3) to not require further treatment ; 4) to be legal, by fulfilling the requirements contained in the health and environ-mental legislation. All the investigated feedstocks belong to the category of residues except for the organic fraction of municipal solid waste (OMSW).
OMSW belongs to the category of wastes. It corresponds to the sorted fraction of organic municipal waste in the region and is a synonym of the term “catering waste”. Besides households organic waste, OMSW also includes food waste from restaurants and canteens and small garden residues such as grass, fruits and leaves. However, abundant residues from gardening and from tree pruning belong to the green fraction of waste, which is excluded from this assessment. OMSW is subject to the waste-management regulation, which implies a longer path necessary to ob-tain authorization for a new plant and also the ban to use digestate as fertilizer (Ministero delle politiche agricole alimentari, forestali e del turismo, 2016; Croce, 2018). In the case study, 61.8% of the total urban waste is source-separated in dif-ferent wet fractions (organic and green fractions) and dry fractions (paper, plastic, glass and metal fractions) according to the 2017 report on waste management from the Regional Agency for Prevention, Environment and Energy (Zinoni et al., 2017). The OMSW fraction corresponds to about 15% of the total sorted-waste (ibid). The
most common collection method for OMSW in Emilia-Romagna is the door by door collection (50.8%), followed by street containers (41.8%) and by other services.
Cow manure includes manure from meat and dairy livestock of the region mixed with straw or other bedding material used in the stable. Cow slurries are also con-sidered in the assessment when specified and referred to as “Cow liquid manure”. The difference between the two, despite the same origin, is due to the mixture with animal bedding in the solid part, which alters the composition and the physical char-acteristics of the feedstock.
Pig slaughterhouse waste (PSW) includes the main types of residues from the pig slaughterhouse industry: offal, guts, blood, bristles, nails and bones. The char-acteristics refer to a mixture of these parts, or to only some parts if specified. As required by the legislation, plants using animal wastes for biogas production have to be registered by the National Veterinary Authority. PSW which are not consid-ered to belong to the category of “animal wastes with low hygiene sanitary risk” according to Reg. CE n. 1069/09 and Reg. CE n. 142/11 have According to the EU regulation (Reg. CE n. 1069/09), residues of animal origin are divided in three cat-egories based on the hygiene sanitary risk. Meat and bones flours fall into Category 2, while all the rest of PSW fall into Category 3. A requirement for residues belong-ing to Category 3 is pasteurization prior to further uses, which consists of heat treat-ment (70°C) for one hour (Riva et al., 2013).
Straw from cultivation of soft wheat (Triticum aestivum) is considered. In the case study, straw is either left on the field after harvest or collected and used for other purposes. Straw from other cereals (for example durum, barley and sorghum) was excluded from the assessment unless specified.
Milk and cheese industry residues include whey and ricotta whey (scòtta in Ital-ian). Whey is the liquid residue obtained when casein and fat are separated by co-agulation from the milk, ricotta whey is the residual liquid after extraction of pro-teins and fat from the milk. Where not specified differently, the values used in the report refer to whey from cow milk. Further residues or by-products which were not included due to lack of data are buttermilk, unsold milk and cheese, cleaning and waste waters from the factories. The feedstock is referred to as “whey” throughout the report.
Wine industry residues includes all residues from the wine making process. The main residues are: grapeseed, marcs, stalks and grape lees. When not specified dif-ferently, the values refer to a mix of all the sub-fractions of the feedstock.
2.3 The case study (Emilia-Romagna)
Emilia-Romagna is a region of 22,452,78 km2located in north-eastern Italy.
About half of the territory (48%) is flat, while the remaining territory is hilly (27%) or mountainous (25%) (Cavicchi, 2016). In response to a favourable regime of in-centives and tax exemptions and to other factors, the number of biogas plants in the region increased exponentially between 2010 and 2012 (ibid.). The number of bio-gas plants reached 237 plants in 2018 and accounts for about 15% of the biobio-gas produced in Italy (Caselli, 2018). The distribution of the biogas plants is concen-trated in the northern area of the region, which corresponds to the flat part and there-fore to the most favourable area for agriculture and for animal production (Valentini, 2018).
The way the biogas sector developed in the region was characterized by a large use of silages and energy crops for production of electricity (Cavicchi, 2016). As in the rest of Italy, biomethane never developed as the upgrading infrastructure neces-sary for the production of biomethane was never put in place. However, in response to the new national policy for biomethane, the interest is recently shifting towards it and in particular to advanced biomethane (Fontana, 2018).
The transition process from biogas to biomethane is supported by the regional administration, which included biomethane in the 2030 Regional Energy Plan and co-financed two research projects on biomethane development: GoBiom and Bi-omether. GoBiom was concluded in autumn 2018 and aimed at optimizing the value chain of biomethane, by working on solutions for the upgrading technology and identifying potentials of residual biomasses at regional level (GoBiom, 2018). Bi-oMether is a Life project running until 2019 which also aimed at optimizing bio-methane value chain focusing on biobio-methane from sludge and urban wastes. The presence at regional level of research centres such as CRPA and of several univer-sities seems to contribute in speeding up the process as it happened with biogas development (Cavicchi, 2016). National actors such as Consorzio Italiano Biogas (CIB) and the environmental NGO Legambiente are very active in the region and in the northern part of Italy. Furthermore, the already established use of compressed natural gas (CNG) fuelled vehicles -accounting for about 15-20% of the regional car fleet- and the existing infrastructure for CNG distribution create favourable condi-tions for the development of biomethane in the area (Patrizio & Chinese, 2016).
2.4 Multi-criteria assessment as a holistic and decision
making tool for the choice between feedstocks
Biomethane development is a complex and transboundary issue, which involves knowledge from the agricultural, energetic, environmental and socio-economic
fields (Olsson & Fallde, 2015). In order to describe complex issues, a vast amount of information is needed, depending on the degree of observation (ibid.). System analysis is a discipline aiming at the observation of complex issues from a holistic, not sectorial or narrowed point of view. It developed greatly in the last 50 years (Liljenström & Svedin, 2005). System analysis can be useful for scientists, policy makers and other actors to break down an issue into manageable components (Ols-son & Sjöstedt, 2004). System analysis was applied to biogas and biomethane de-velopment at different levels and in different ways in the past. Several tools, indica-tors and methodologies have served as “lenses” for system analysis depending on the aspects to be emphasized. One type of system analysis is the multi-criteria as-sessment of the suitability of a feedstock for production of biogas/biomethane. Pio-neers in this type of analysis were some researchers from the Biogas Research Cen-tre of the Linköping University (Sweden). Several of the aspects addressed in a study by Ammenberg et al. (2017) were investigated in this report and are presented in the following paragraphs along with background knowledge.
Assessing feedstocks availability
The theoretical availability of a feedstock can be estimated with reasonable ac-curacy, however it is not always representative of the real availability of a feedstock, as that depends on factors such as the current uses and the competing interests over it, as well as on its physical and geographical accessibility and on the seasonality during the year.
Assessing feedstocks technical suitability for biomethane production and nutri-ent recycling
Biomethane represents the most valuable product of anaerobic digestion, from the economic perspective. The biomethane yield is defined as the amount of me-thane which can be obtained from a ton of volatile solids (VS) of feedstock after anaerobic digestion and upgrading processes. It is expressed as volume (m3) of gas
composed by at least 97-98% of methane. The quality of the feedstock and the pro-cess itself affect the biomethane yield (Hijazi et al., 2016). The quality of the feed-stock is defined by its biochemical composition and by other characteristics such as TS and VS content. According to Hijazi et al. (2016), carbohydrates produce biogas with theoretical methane content of 50%, while biogas from fats and proteins tends to have a CH4 content of up to about 70%. The amount of total solids (TS) is the dry matter content of the feedstock, usually reported as a percentage of the wet weight. Volatile solids (VS) is the fraction of TS which is lost (evaporating) after ignition and is expressed as percentage of TS. The amount of VS corresponds to the organic content within the TS and is the part affected by the microbiological activity and directly correlated to the biogas yield. Other factors such as retention time,
loading rate, digestion technology (co-digestion; batch or continuous; one or two phase digestion) and pre-treatment of the raw feedstocks have an influence on the final yield as well (Berglund & Börjesson, 2006).
Nutrients availability, degradability, physical characteristics and presence of in-hibiting substances in the feedstock are some of the main factors affecting the an-aerobic digestion process. The carbon-nitrogen (C/N) ratio is an indicator of degra-dability which affects the entire anaerobic digestion phase, by influencing the amount of nutrients available for the microorganisms involved and the process sta-bility (Divya et al., 2015). The highest ratio tends to increase the uptake of nitrogen by microorganisms, while the lower ratio leads to ammonia accumulation and po-tentially inhibition (Divya et al., 2015). A C/N ratio of the feedstock between 20 and 30 is optimal, while a C/N ratio higher than 30 -typical of feedstocks rich in lignocellulose- normally requires additional pre-treatments to facilitate the digestion process (Ammenberg et al., 2017; Greggio et al., 2018). The pH can affect the pro-cess of anaerobic digestion, even though self-regulation and stabilization of the pH usually occur during anaerobic digestion (Consultation with Åke Nordberg 4/7/2018).
The suitability of a feedstock for bio-fertilizer use depends on the quality of the digestate produced. The quality of the digestate is determined by its nutrient content and by the presence and persistency of undesirable substances in it. It is considered undesirable any substance associated to negative effects on plants, soil and living organisms. Typical examples of undesirable substances are plastics and heavy met-als. Concerning the nutrient content, the amount of nutrients which remains in the digestate can vary depending on the conditions of the anaerobic digestion process and on the feedstock as well. Literature suggests that all of the Total Phosphorous generally remains in the digestate, while a part of the Total Nitrogen can get lost during the process and during uncovered storage, mainly in the form of ammonia (Güngör et al., 2007; Poeschl et al., 2012). Part of the organic nitrogen in the raw feedstock tends to be transformed to plant-available, ammoniacal form (N-NH4+)
during anaerobic digestion (Fabbri & Piccinini, 2012; Drosg et al., 2015). When digestate is directly spread as bio-fertilizer the entirety of the nutrients contained by the digestate reaches the soil, but when digestate is separated in phases a large part of the nutrients remains in the liquid phase (the extent of it depending on the sepa-ration technology used). Concerning the nitrogen form, the majority of the ammo-nium nitrogen (around 80%) tends to remain in the liquid fraction of digestate, while the solid fraction is characterized by organic nitrogen (Drosg et al. 2015). From a regulatory point of view, in Italy digestate is regulated based on the feedstock of origin. For example when the feedstock sent to anaerobic digestion belongs to the category of “wastes”, the resulting digestate will have to be managed in accordance
with the normative regulating the use of wastes. These regulatory differences have consequences on the authorization process for the use of digestate as bio-fertilizer.
Assessing the environmental aspects of biogas/biomethane production
The anaerobic digestion of a feedstocks is associated to local and more wide-spread or climatic impacts (Ammenberg et al., 2017). Local impacts include nega-tive impacts on land/soil, water and ecosystems. They are typically associated to the production of crops used as feedstocks for biomethane production or to the spread-ing of digestate. Other local impacts such as odour and aesthetic issues might also be included in some assessments. Climatic impacts arise from the whole life-cycle process and correspond to GHG emissions released to the atmosphere. The process includes steps taking place before the incoming feedstock reaches the plant (collec-tion and transporta(collec-tion), during the processing within the plant (pre-treatments, an-aerobic digestion, followed by upgrading and compression of the biogas produced) and after leaving the plant (separation of the digestate between solid and liquid form, loading, transport and spreading to field). Each of these steps of the process con-sumes energy, which is indirectly associated to greenhouse gas (GHG) emissions depending on the source of energy utilized. The sum of these GHG emissions de-fines the climatic impact of the biomethane produced from the feedstock. Typically it is accounted by including also the direct GHG emissions to the atmosphere which can occur during the process due to leakages or flared biogas/biomethane.
The Renewable Energy Directive (RED) of the European Union from 2009 sug-gests to account for the GHG emissions of biomethane production in the described way. With the RED approach, the GHG emissions from biomethane production are referred to the Lower Heating Value of the feedstock and compared to the GHG emissions from the production of another fuel (Ammenberg et al., 2017). However in literature it is common to expand the analysis in order to account also for indirect upstream and downstream GHG emissions by using a Life Cycle Approach. Up-stream GHG emissions occur during processes prior to collection of the feedstocks (such as the cultivation of agricultural feedstocks). However, according to Man-ninen et al. (2013), no upstream GHG emissions should be accounted for waste-and-residues based feedstocks due to their nature of waste resource. Downstream GHG emissions can refer to avoided emissions as a consequence of producing bio-methane and spreading of digestate, or also to emissions occurring because of the change in land use or feedstock use (Tufvesson et al., 2013).
A thing which is important to notice is that the GHG emissions occurring from the use of biomethane (combustion, in the case of transport) are generally not ac-counted for biomethane produced from plant-based feedstocks or waste-based feed-stocks. The reason for this is that the GHG emissions associated to this type of bio-methane, which get the name of “biogenic emissions”, were previously sequestrated
from the atmosphere by the plants used for production of biomethane or, in the sec-ond case, would occur in any case due to the degradable nature of the feedstock . The not-accounting of “biogenic emissions”, especially of the ones from plant-based biomethane (i.e biomethane from energy crops or from woody plants) has been crit-icised by several literature studies on the basis that these emissions could be avoided if the plants were left in place (Searchinger et al., 2009; Haberl et al., 2012; De Kleine et al., 2017).
In Sections 3.1 and 3.2 of the methodology chapter, the criteria behind the choice of the feedstocks and of the parameters assessed are outlined. In Sections 3.3, 3.4 and 3.5 the methods used to answer the research questions are presented, divided by research question.
3.1 Choice of the feedstocks
The choice of which feedstocks to assess was based on several criteria. The first criteria was to consider feedstocks which are residues or waste re-sources. Energy crops and not-residual feedstocks were therefore excluded.
The second criteria was the feedstock availability (in terms of tons of VS per year). The theoretical availability of all residual and waste resources in the region was considered and the feedstocks which were considered to be only marginally significant at regional scale were excluded.
In the third place, the feedstocks category was considered. Urban, agricultural and agri-industrial were the main categories identified. It was chosen to represent them all with at least one feedstock.
The fourth criteria was process uniformity. Feedstocks whose treatment process differs too much from the rest (i.e woody residues) were excluded because of diffi-cult comparability.
3.2 Choice of the parameters
Compared to the broader study from Ammenberg et al. (2017), which served as as guiding framework for structuring this assessment, it was chosen to focus mainly on technical and environmental aspects. Geographical and socio-economic aspects
3 Methodology
were also partly covered in order to contextualize the assessment to the case study and to discuss about the effective availability of feedstocks and Regional impacts. The structure of the assessment is schematized in Table 1. The three research questions presented in Section 1.2 are addressed with eleven sub-questions, which were assessed by using different indicators, methods and tools. Seven of the seven-teen indicators proposed in the original study by Ammenberg et al. (2017) were excluded due to time constraints and, partly, due to lack of information available. The indicators which were excluded regarded mostly socio-economic aspects (tech-nological feasibility, profitability, clarity of business implications, policy support and public opinion) and local environmental impacts (impacts on land or soil, on water resources, on biodiversity and ecosystems, other impacts such as odor, noise and esthetic issues, and ILUC).
Table 1. Research matrix
Research question
Sub-question Indicators Method/Tool
Availability of feedstocks
Amounts per year Theoretical feedstock (TS) per year
GoBiom database Geographical distribution
Current uses, control and competition
Feedstock production den-sity sites
Length of contracts for ac-cess to feedstock
GoBiom maps, Biome-ther geoportal Literature review, Stakeholder Interviews Technical suita-bility Physical-chemical charac-teristics
Suitability for a. digestion
Biochemical composition; TS & VS C/N ratio Literature review Literature review Biomethane yield
Biomethane volume and corresponding energy value Suitability as bio-fertilizer Nutrient content
Amount and value of bio-fertilizer
B0 and G0
Tot biomethane produci-ble per year
Amount of undesirable substances
Nitrogen, Phosphorous contents
Nitrogen, Phosphorous available per year
Literature review Own calculations Literature review Literature review Own calculations Environmental sustainability Climate impact Energy efficiency GHGs emissions savings Energy balance LCA LCA
3.3 Assessment of feedstocks availability
AmountsThe Regional database of wastes and by-products was realized in 2017 for the GoBiom Project and was used in this report in order to extrapolate the amounts of feedstocks available within the region. The amount of feedstock available is a new indicator compared to the assessment of Ammenberg et al. (2017). The data used refer to the year 2016 and are based on the data from ISTAT, the Italian National Statistics Institute. The amounts of feedstocks available were provided in form of tons of dry matter per year. The potential biomethane yields per year were also pro-vided in the database, but they were not used, as it was preferred to find and use own average values from literature. No grading scale was used for this indicator, as the availability is already reflected by the sub-questions “Biomethane volume and corresponding energy value” and “Amount and value of bio-fertilizer”.
Geographical and physical accessibility
For this sub-question, data on the actual geographical location of the feedstocks in the region could not be found. However, a source of information which was avail-able is regional density maps of the sites of feedstocks production (or handling, in the case of OMSW) realized in 2018 from one of the GoBiom project partners, the Inter-Departmental Centre for Research in Environmental Sciences (CIRSA) of the University of Bologna. From these maps, information about how many production sites and about where they are located in the region was extrapolated. The maps were based on data from ISTAT and from CIRSA’s own database. The data refer to the year 2016. QGIS is the software used to create the density maps through the tool “Heatmap”. The chosen radius was 15 km and the squared cells have sides of 15 km. The only feedstock for which a density map is not available is wheat straw, which was not assessed for this indicator. The density maps are available in Appen-dix 2.
Other sources of information which were used are literature articles, materials from the conference “L’era del biometano” from October 11th 2018, and personal
communications from key informants. In particular, a phone call with one the au-thors of the GoBiom maps was conducted, followed by an email exchange with the bioenergy-sector responsible of the regional farmers union “Confagricoltura”.
Considering parameters such as extension and connectedness of the areas where the feedstocks are concentrated, it was possible to grade the feedstocks on this as-pect. The figure reported in Appendix 1 shows the grading scale used to assess the
geographical and physical accessibility of the feedstocks, based on the study from Ammenberg et al. (2017).
Feedstock control and competing interests
Based on literature, conference material and personal communications, an over-view of the current uses and market of the feedstocks could be gained. A main indi-cator used was the possibility to sign long-term agreements for the use of the feed-stocks. The purpose was to assess how viable is the future use of these feedstocks for production of biomethane, when considering the competing uses and interests for the same feedstocks.
The grading scale for the indicator was taken from Ammenberg et al. (2017) and it is reported in Appendix 4.
3.4 Assessment of the technical suitability
To assess the technical suitability of different feedstocks for production of bio-methane, the following aspects were investigated based on the study conducted by Ammenberg, Feiz, et al. (2017). Literature review was the method used for the re-sults of this section. Values from existing studies were extrapolated and average values were generally taken as definitive result unless one of the values was consid-ered to be more representative than the others.
Feedstocks characteristics and Suitability for anaerobic digestion
Some physical and chemical characteristics of the feedstocks considered were assessed through literature review. In particular, biochemical composition, TS and VS were investigated and reported in the results for this section. Other characteris-tics such as C/N ratio, pH and degradability were also investigated.
The sub-question “Suitability for anaerobic digestion” looks at the feedstocks physical and chemical characteristics in order to assess to which degree they fit an-aerobic digestion requirements as single feedstocks (Ammenberg et al., 2017). The C/N values and the other relevant parameters were taken from literature. As consid-ered by Ammenberg et al. (2017), if a feedstock requires a complex and uneconomic pre-treatment in order to enhance anaerobic digestion to a satisfactory level, this aspect is taken in consideration during the grading of the feedstocks. The assessment scale is reported in Table 2.
Table 2. Grading scale for the indicator “Suitability for anaerobic digestion” from Ammenberg et
al. (2017)
Value Scale definition
Very good This feedstock is very digestible and contains all of the components needed for diges-tion (in suitable amounts and propordiges-tions). There is no content of undesirable sub-stances/materials that are inhibiting
Good This feedstock is very digestible and contains most of the components needed for di-gestion (in suitable amounts and proportions). This means that additives are needed. There is no content of undesirable substances/materials that are inhibiting.
Satisfactory This feedstock is rather digestible and contains some of the components needed for digestion (in suitable amounts and proportions). This means that this feedstock needs to be co-digested or additives need to be added. There is may be some content of un-desirable substances/materials, but they are not significantly inhibiting.
Poor This feedstock may be used as complementary feedstock for co-digestion, because it contains one or few of the needed components. There may be some content of unde-sirable substanecs/materials, but they are not significantly inhibiting.
Very poor This feedstock cannot contribute to the digestion process, or may act as inhibitor. OR There are some content of undesirable substances/materials that will significantly in-hibit the digestion.
Methane yield
A literature review was carried out in order to obtain average values for the me-thane yield of the selected feedstocks. Some literature studies only reported the bi-ogas yield, which had to be multiplied by the average methane content (percentage of methane within the biogas) in order to obtain the biomethane yield. The average methane content of the feedstock was generally reported by the same article provid-ing with the methane yield, but if not provided then it was assumed as the average value obtained from the other sources. The grading scale from Ammenberg et al. (2017) was applied to the yields of the feedstocks and is reported in Table 3.
Table 3. Grading scale for biomethane yield from Ammenberg et al. (2017)
Value Scale definition
(m3 CH4/ton VS) Very good ³ 600 Good 400-600 Satisfactory 200-400 Poor 50-200 Very poor ≤ 50
Biomethane volume and corresponding energy value
This sub-question relates the theoretical biomethane yields to the availability per year of the selected feedstocks in the region. By multiplying the two parameters, a value corresponding to the total potential biomethane was obtained (millions m3CH
4/year). In order to adopt the grading scale from Ammenberg et al. (2017), the
biomethane amount was converted in energy unit (GWh/year). The unit conversion was done by using the energy outputs reported in Table 4, which were self-calcu-lated assuming a lower heating value of 34.812 MJ/Nm3 of biomethane (Svenskt
gastekniskt center, 2012).
Table 4. Energy output obtainable from the selected feedstocks
Feedstock Energy output (GWh/ton VS)
OMSW 4.099
Cow solid manure Cow liquid manure
1.915 1.861 PSW 5.343 Wheat straw 2.267 Whey 2.704 Wine by-products 1.516
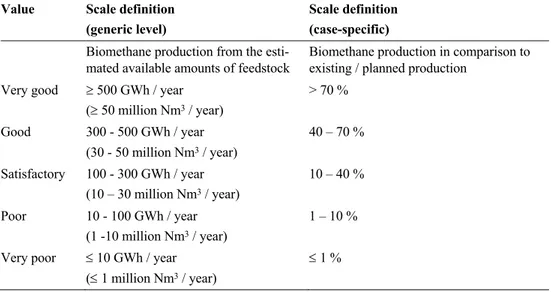
The grading scale adopted for the sub-question is reported in Table 5. The generic scale definition was adopted for the case of each feedstock and the potential bio-methane production was compared to the Regional 2030 energy targets.
Table 5. Grading scale for biomethane amount (from Ammenberg et al., 2017)
Value Scale definition (generic level)
Scale definition (case-specific)
Biomethane production from the esti-mated available amounts of feedstock
Biomethane production in comparison to existing / planned production
Very good ³ 500 GWh / year (³ 50 million Nm3 / year) > 70 % Good 300 - 500 GWh / year (30 - 50 million Nm3 / year) 40 – 70 % Satisfactory 100 - 300 GWh / year (10 – 30 million Nm3 / year) 10 – 40 % Poor 10 - 100 GWh / year (1 -10 million Nm3 / year) 1 – 10 % Very poor £ 10 GWh / year
(£ 1 million Nm3 / year)
Nutrient content
The Nitrogen (N) and Phosphorous (P) contents of the raw feedstocks are the indicators considered for this sub-question. Nutrient content is defined as the amount (kg) of Total Nitrogen (N) and Total Phosphorous (TP) per ton of DM in the raw feedstock. Given that covered storage of the digestate is assumed for this study, nitrogen losses in form of ammonia are discarded.
The scale in Figure 1 from Ammenberg et al., (2017) was adopted in order to grade the feedstocks based on the nutrient content. VL stands for very low, L stands for low, M for medium, H for high and VH for very high. VP stands for very poor, P for poor, M for medium, G for good, VG for very good. A very high nutrient content per ton of feedstock is judged to be “very good” for the purpose of this study. However, a conscious use of the digestate is required, since the excessive and inefficient spreading of digestate can lead to adverse effects such as eutrophication and acidification.
Figure 1. Grading scale for the feedstocks’ nutrient content from Ammenberg et al. (2017) Amount and value of bio-fertilizers
The amount of bio-fertilizer which can be produced every year at regional level is calculated and evaluated based on the gross nutrient amount. In order to calculate the amount of bio-fertilizer, the specific nutrient content is applied to the theoretical availability of the feedstocks in the region. The scale is reported in Figure 2. The upper threshold of 4000 tons of N and 2500 tons of P was set by Ammenberg et al. (2017) as a result of a participatory consultation with Swedish farmers and biogas producers, which was maintained for this study.
Figure 2. Grading scale for amount and value of bio-fertilizers from Ammenberg et al. (2017) Suitability for bio-fertilizer
The evaluation of the feedstocks based on their suitability for production of bio-fertilizers took into consideration the presence of undesirable substances (i.e process inhibitors and heavy metals) or materials (i.e plastics) associated to each feedstock. The amounts expected to be found in the digestate (high or negligible amounts), as well as their persistency (easy, relatively easy or not easy to degrade/remove), are the parameters considered for the evaluation. Literature studies, regional and na-tional regulation on the issue were the main sources of information. The grading scale utilized, taken from Ammenberg et al. (2017) is reported in Appendix 5.
3.5 Assessment of environmental sustainability
3.5.1 Energy balanceThe energy balance was calculated by relating -in form of ratio (PEIO ratio)- the Primary Energy inputs to the final energy outputs, occurring throughout the life cy-cle stages of biomethane production.
For this sub-question, the recommendations from Ammenberg et al.(2017) were followed. The assessment included all life-cycle stages -except collection- which are needed to produce biomethane and co-product. The production of 1 MJ of bio-methane from each feedstock was taken as functional unit.
Concerning the final energy output (denominator of the ratio), the lower heating value (LHV) of 1 Nm3 of biomethane was considered in accordance with the
guide-lines of the European Renewable Energy Directive (RED). The LHV considered is 34,812 MJ according to Svenskt gastekniskt center (2012). The LHV was multiplied
by the yield associated to 1 ton of fresh feedstock. The yields are feedstock-specific and they are reported in Section 4.2.2 of the results.
Concerning the Primary energy inputs along the production chain, for Primary Energy it is meant an unconverted and untransformed energy flow as intended by Berglund & Börjesson (2006). The assumptions made for the energy inputs calcu-lations of the baseline scenario are the following:
• All the feedstocks are residues or wastes, therefore energy inputs prior to the collection of feedstock (i.e energy required for production or cultivation) should not be included (Berglund & Börjesson, 2006);
• The energy inputs related to the collection of feedstocks is not accounted for, due to lack of homogeneous data and to the high variability of conditions within a regional context;
• Transport of feedstocks is assumed to happen by trucks fuelled with gasoline. The associated energy inputs refer to a distance of 20 km which includes the empty return of the truck (Berglund & Börjesson, 2006);
• Mechanical pre-treatment is assumed to take place for all the feedstocks in order to reach a Total Solids (TS) content of 12%. In the case of feedstocks with higher TS than 12% treatment with screw press and adding of water is assumed, in the case of feedstocks with lower TS treatment with screw press and recirculation of the excess water is assumed (Pöschl et al., 2010);
• The amount of incoming feedstock resulting from the mechanical pre-treatment is directly proportional to the TS content and it originates an equivalent amount of digestate;
• Heat pre-treatment (sterilization) is assumed to take place for OMSW and PSW at respectively 70 and 133°C for 1 hour and 20 minutes according to Pöschl et al. (2010);
• Heat demand during the pre-treatments, digestion and upgrading processes is met by utilization of part of the raw biogas produced, through boiler, assuming that 1 m3 of biogas with 60% of CH
4 content corresponds to 6 kWh of energy
(Svenskt gastekniskt center, 2012) and that 1 MJ of biogas corresponds to 1.3 MJ PE (Berglund & Börjesson, 2006);
• Electricity demand during digestion and upgrading processes is met by utiliza-tion of the electricity grid, whose electricity is provided by the Italian electricity mix intended as in the report by Caputo, 2018);
• Electricity demand associated to anaerobic digestion is intended as centralized and mesophilic anaerobic digestion;
• All raw biogas which is not used for heating is upgraded to biomethane through membrane technology as in (Valtieri & Saccani, 2014)
• Digestate is mechanically separated in liquid and solid phases through screw-press technology and partly recirculated in the anaerobic digestion (liquid phase), while the rest (solid phase) is transported and spread as fertilizer;
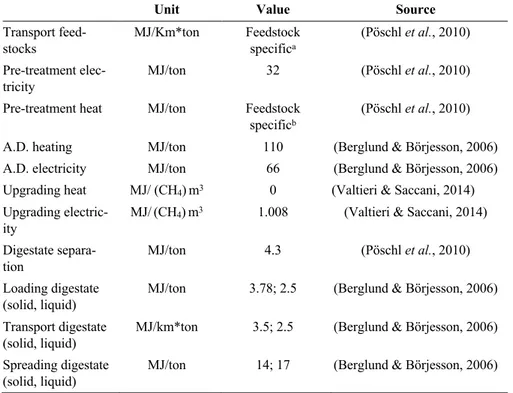
Values from existing studies on the energy balances of the selected feedstocks were used for the purpose of calculating the PE inputs for the baseline scenario. In the absence of values for the same exact feedstocks, values referring to comparable feedstocks in terms of characteristics (i.e TS) were taken as reported in footnote. Table 6 summarizes which PE values were used and from which author. A screen-shot with the excel calculations for the PEIO ratio is reported in Appendix 6.
Table 6. Values used for baseline scenario PE inputs
Unit Value Source
Transport feed-stocks MJ/Km*ton Feedstock specifica (Pöschl et al., 2010) Pre-treatment elec-tricity MJ/ton 32 (Pöschl et al., 2010) Pre-treatment heat MJ/ton Feedstock
specificb
(Pöschl et al., 2010) A.D. heating MJ/ton 110 (Berglund & Börjesson, 2006) A.D. electricity MJ/ton 66 (Berglund & Börjesson, 2006) Upgrading heat MJ/ (CH4)m3 0 (Valtieri & Saccani, 2014)
Upgrading electric-ity
MJ/(CH4)m3 1.008 (Valtieri & Saccani, 2014)
Digestate separa-tion
MJ/ton 4.3 (Pöschl et al., 2010) Loading digestate
(solid, liquid)
MJ/ton 3.78; 2.5 (Berglund & Börjesson, 2006) Transport digestate
(solid, liquid)
MJ/km*ton 3.5; 2.5 (Berglund & Börjesson, 2006) Spreading digestate
(solid, liquid)
MJ/ton 14; 17 (Berglund & Börjesson, 2006)
= OMSW 1.8; Manure 2.8; Slaughterhouse waste (paunch content) 2.1; Straw 6.9; Whey (assumed from
grease separator sludge) 2.1; Wine residues (assumed from pomace) 2.7; b = OMSW 80.64; PSW 113.4; The PEIO ratio is applied to the grading scale from Ammenberg et al. (2017), which is reported in Table 7. The scale was used to grade the energy balance of the feed-stocks, adopting a rounding up in the allocation of the grade considering that the collection step in the life cycle of the feedstocks was excluded from the calculations, likely leading to slightly lower estimations compared to Ammenberg et al. (2017).
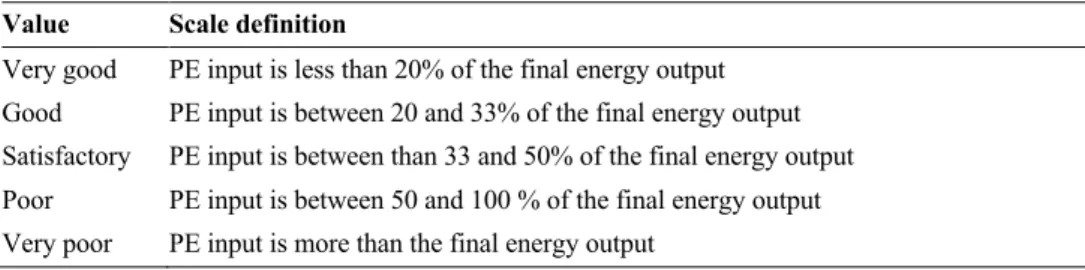
Table 7. Grading scale for the energy balance of the selected feedstocks (from Ammenberg et al., 2017)
Value Scale definition
Very good PE input is less than 20% of the final energy output Good PE input is between 20 and 33% of the final energy output Satisfactory PE input is between than 33 and 50% of the final energy output Poor PE input is between 50 and 100 % of the final energy output Very poor PE input is more than the final energy output
3.5.2 Climate impact
The climate impact of biomethane production from the selected feedstocks is assessed by the indicator Greenhouse gas (GHG) emissions savings, which com-pares emissions related to the process of biomethane production (E biomethane) to the
emissions related to a baseline fossil reference (indicating average supply and com-bustion emissions of a fossil fuel, expressed as E fossil), as it is recommended by the
Annex V of RED and by Ammenberg, Feiz, et al. (2017). The emissions savings (E) were calculated using the following formula and expressed in percentage form:
! = ! $%&&'( − ! *'%+,-ℎ/0,! $%&&'( (1.)
GHG emissions were expressed as grams of CO2-equivalent emissions per MJ
of upgraded biomethane produced. CH4, and N20 emissions were converted to CO2
equivalent through the conversion factors reported in Table 8, which are in accord-ance with the IPCC 4th report (Giuntoli et al., 2015).
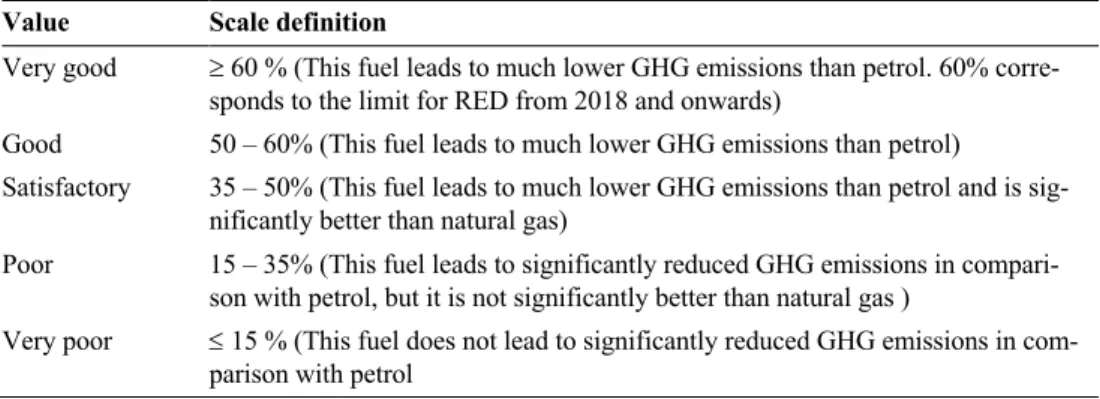
For the fossil emissions (Efossil), the baseline reference of 94.1 gCO2 / MJ was
used to account for the emissions related to supply and combustion of fossil fuels (Council of The European Union, 2015; Ammenberg et al., 2017) . In addition to this value, the baseline reference for emissions related to supply and combustion of natural gas (CNG) was also considered and assumed to be 71.7 gCO2 / MJ according
to Giuntoli et al. (2015).
In order to calculate the GHG emissions associated to the production of bio-methane (Ebiomethane) from the different feedstocks, the guidelines contained in the
EU RED were followed for the baseline scenario of this report. According to the RED guidelines, the allocation of GHG emissions related to the production and combustion of biofuels was done with a life cycle approach. A well-to-weel type of assessment, based on actual conditions of the case study, was conducted excluding local environmental impacts as anticipated in Section 3.2.
For the GHG emissions allocation, the process was considered as a refinery-type system since the digestate separation and recirculation of the liquid fraction was assumed. This allocation method implies that all the GHG emissions occurring