The Colorado Wine Industry Development Board commissioned a research project in 2012–2013 to assess the economic contributions the Colorado wine industry makes to the state. Conducted by Colorado State University, the research builds upon a similar 2005 study to better measure the wine industry’s growth in Colorado over the past several years.
Professor Dawn Thilmany, Ph.D., from CSU’s Department of Agricultural and Resource Economics (DARE) oversaw the study with support from Associate Professor Marco Costanigro, Ph.D., and members of the Colorado Wine Industry Development Board. DARE’s graduate research assistants, Eyosiyas Tegegne, Brett Hines and Allison Bauman, also helped with data collection and analysis.
www.coloradowine.com 720.304.3406 • Fax: 303.239.4122
The 2012 Economic
Contribution of
Colorado’s Wine Industry
The Role of Consumers,
Wineries, and Tourism
Total Economic Contribution of the Colorado Wine Industry
The Multiplier Effect of the Colorado Wine
Industry’s Economic Contribution
IMPLAN (Impact Analysis for Planning) software was
used and provided key economic results and relationships as outlined in the figure above. The data in an IMPLAN model is a combination of national averages and publicly available regional data from sources such as the Bureau of Labor Statistics (BLS) and the National Agricultural Statistical Service (NASS).For any analysis that uses IMPLAN as the key analytical tool, the contributions are laid out in three different parts: direct, indirect and induced contributions.
Direct contribution or effect is the economic activity that directly results from an industry, such as goods sold, people hired and salaries paid. Indirect effects are the secondary contributions (ripple effects) due to the spending on inputs to make the primary product. When a Colorado winery produces wine, it purchases inputs like wine bottles and winegrapes from suppliers. This stimulates suppliers’ businesses to purchase inputs for their own operations as well as hire labor.
Induced contributions are the economic activity associated with household spending (spillover) that is a result of households earning money from
www.coloradowine.com 720.304.3406 • Fax: 303.239.4122
Executive Summary
The wine industry continues to record robust sales growth both globally and
nationwide. In Colorado, wineries have attracted higher income, experience-seeking travelers who have an interest in local foods and beverages.
The following summarizes key findings of the study:
Wine Consumers are Boosting Demand Nationwide
Colorado’s wine consumers are not only drinking more local wines, they are outpacing wine consumption nationally:
• In the U.S., the industry reported $34.6 billion in retail value for 20121, or
approximately $110 per capita per year. In terms of volume, adults consumed 2.5 gallons of wine per capita as of 2010, which comprised more than 10 percent of all beverage sales.
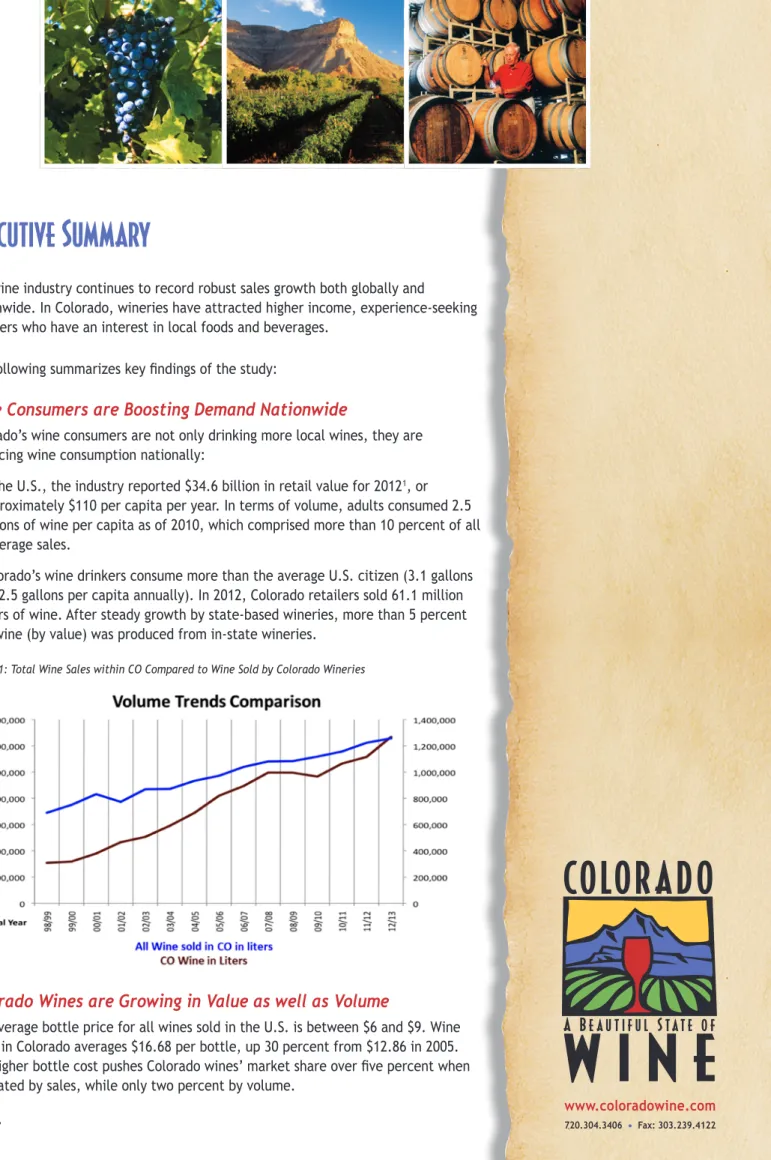
• Colorado’s wine drinkers consume more than the average U.S. citizen (3.1 gallons vs. 2.5 gallons per capita annually). In 2012, Colorado retailers sold 61.1 million liters of wine. After steady growth by state-based wineries, more than 5 percent of wine (by value) was produced from in-state wineries.
Figure 1: Total Wine Sales within CO Compared to Wine Sold by Colorado Wineries
Colorado Wines are Growing in Value as well as Volume
The average bottle price for all wines sold in the U.S. is between $6 and $9. Wine made in Colorado averages $16.68 per bottle, up 30 percent from $12.86 in 2005. The higher bottle cost pushes Colorado wines’ market share over five percent when estimated by sales, while only two percent by volume.
www.coloradowine.com 720.304.3406 • Fax: 303.239.4122 Nevertheless, an estimated 20 percent of Colorado wine consumers devoted 25
percent of their purchases to Colorado brands and another 18 percent bought a smaller share of Colorado wines. Yet 63 percent of consumers did not buy local wines. Frequent purchasers of Colorado wines were most likely to purchase bottles that cost between $16 and $25, which aligns with the Colorado wineries’ average bottle cost of $16.68.
The Growth in Wine Sales and Wineries Benefit Other Sectors
of the Economy
Since 1990, vineyard acreage has increased from 240 acres to about 1,200 acres to support the 96 Colorado wineries licensed as of 2010. Approximately 340,000 tons of grapes are grown or bought by Colorado wineries from other local vineyards (Sharp and Caspari, 2010).
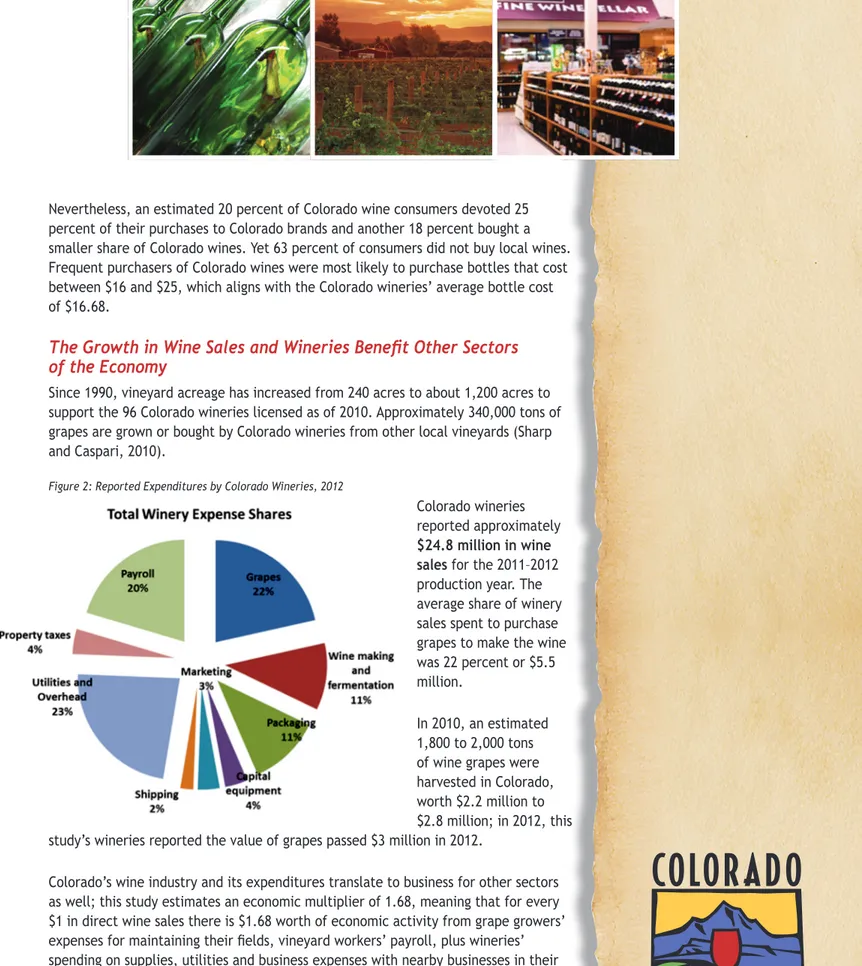
Figure 2: Reported Expenditures by Colorado Wineries, 2012
Colorado wineries reported approximately $24.8 million in wine sales for the 2011–2012 production year. The average share of winery sales spent to purchase grapes to make the wine was 22 percent or $5.5 million.
In 2010, an estimated 1,800 to 2,000 tons of wine grapes were harvested in Colorado, worth $2.2 million to $2.8 million; in 2012, this study’s wineries reported the value of grapes passed $3 million in 2012.
Colorado’s wine industry and its expenditures translate to business for other sectors as well; this study estimates an economic multiplier of 1.68, meaning that for every $1 in direct wine sales there is $1.68 worth of economic activity from grape growers’ expenses for maintaining their fields, vineyard workers’ payroll, plus wineries’ spending on supplies, utilities and business expenses with nearby businesses in their communities. Using this multiplier, the entire contribution of the industry to the state of Colorado expands to more than $41 million2.
2For standard economic analyses, the contributions are laid out in three different parts: direct, indirect and
induced contributions. The direct contribution is the economic activity that directly results from an industry. Indirect effects are the secondary contributions due to the increased input demand from directly affected businesses. The induced contribution is the economic activity associated with household spending. Together,
the direct, indirect and induced contributions estimate the total economic contribution of the wine industry, normally expressed as a multiplier of the direct sales.
www.coloradowine.com 720.304.3406 • Fax: 303.239.4122 Considering both wine-based events and visits to Colorado wineries by out-of-state
visitors, the industry contributed an additional $27 million of economic activity related to tourism in 2012 (in addition to wine purchases), and given economic activity within the tourism sector, this expands to $47 million once indirect effects are considered. This is nearly the same amount driven by wine sales but represents spending in nearby communities adjacent to the winery and is in addition to wine sales. The industry also has attracted more in-state residents to their events and wineries since 2005. This has generated almost $33 million in direct tourism activity, or more than $56 million when indirect effects are considered.
The following table presents the direct and total economic effects (including multiplier estimates of how industry activity circulates through the broader
economy). Conservative estimates demonstrate the wine industry contributed $87.8 million to the Colorado economy in 2012. This number grows to $144 million if it includes tourism dollars spent by out-of-state visitors and residents who spend money on transportation, meals and lodging to visit Colorado wineries.