Laser scanning of overbreak and
deformation for crosscuts at Malmberget
mine
uGPS Rapid Mapper™
Adam Alkayal
Mining and Geotechnical Industry, Higher Education Diploma 2021
Luleå University of Technology
i
ABSTRACT
Nowadays, new measurement technologies are being used in underground mining operations to increase the safety factors and solve several mining challenges to save time and improve the effectiveness of mining operations. One of the new tools is the uGPS Rapid Mapper, which has recently entered the market. LKAB is one of the companies looking to use modern technology to help solve problems in its Kiirunavaara and Malmberget underground mines. The operating mechanism of the uGPS Rapid Mapper was studied and some investigations were carried out with the device.
The first part of this thesis studied the repeatability and accuracy of the uGPS Rapid Mapper™ System during actual use. A number of tests were completed and data analysis via CloudCompare software was carried out. The result of these tests showed that the uGPS Rapid Mapper is an efficient device that can be counted on for future work with higher reliability in terms of output results.
The second part of this thesis determined the overbreak percentage caused by blasting and other factors. The uGPS Rapid Mapper was used to scan different parts of the mine (areas that have been developed more than three months ago and newly-developed areas). The percentage overbreak that occurred in these selected areas in the mine and the cause of the overbreak were analysed. The study indicated that the data collected by uGPS and analyzed using the Deswik.CAD (Reconciliation Tool) is a very effective method for calculating the overbreak. Most of the study areas in this study however showed an overbreak percentage of more than 16% with a varying form of percentage overbreak. The potential causes of this variation are as a result of geological structures or more pronounced mining activities, or operations such as drilling and blasting, scaling, charging and explosives parameters. The results also clearly indicated that underground deformation, rock support installation, especially the application of shotcrete plays a major role in filling the void after rock falls and reducing geometric crosscut entry size.
The final part of the work investigated the deformation that occurred in some parts of the mine where it is believed to have deformations exceeding 20 cm. These parts of the mine were scanned regularly for four months, and the data were analysed using CloudCompare and Deswik.CAD software. The result of the deformation studies showed that the uGPS Rapid
ii
Mapper can effectively recognize the changes underground where the recorded deformation has exceeded 40 cm.
The results confirmed that the uGPS Rapid Mapper can be used to effectively monitor underground changes in the mine through regular underground scanning and analysis of the scanned data.
iii
TABLE OF CONTENTS
ABSTRACT ... i
TABLE OF CONTENTS ... iii
CHAPTER 1 ... 1 Introduction ... 1 1.1 Problem Statement ... 1 1.2 Objectives ... 2 1.3 Scope ... 2 CHAPTER 2 ... 3 Background ... 3
2.1 Sublevel Caving Mining Method ... 3
2.2 Site Description ... 3
2.3 Geology ... 4
2.4 Overbreak ... 6
2.4.1 Survey and Measurement Methods ... 7
2.4.2 Previous Investigation for Overbreak ... 9
2.5 Deformation Measurement ... 11
2.5.1 Measurement Methods ... 11
2.5.2 Convergence Monitoring ... 12
CHAPTER 3 ... 15
uGPS Rapid Mapper™ ... 15
3.1 uGPS Rapid Mapper™ Laser Scanning System ... 15
3.1.1 Targets Deployment ... 16
3.2 Previous Investigation for uGPS Rapid Mapper™ System ... 17
CHAPTER 4 ... 22 Methodology ... 22 4.1 Underground Scanning ... 22 4.1.1 Scanning Preparation ... 23 4.1.2 Scanning Procedure ... 23 4.1.3 Data Processing ... 25
4.2 Accuracy and Repeatability Analysis ... 25
4.2.1 Target Location Repeatability- Target Tests ... 25
4.2.2 Convergence Accuracy Due to Target Spacing- Target Tests ... 27
4.2.3 Target location Accuracy- Target Tests ... 29
iv
4.2.5 Point Cloud Distance Measurement Accuracy-Measurement Tests ... 31
4.2.6 Accuracy - Deformation Test ... 32
4.3 Overbreak Measurement ... 34
4.3.1 Actual Overbreak ... 34
4.3.2 Overbreak and Shotcrete Thickness ... 35
4.4 As-Planned vs. As-Built - Measurement. ... 36
4.5 Geological Study ... 37
4.6 Deformation Calculation Method ... 44
4.6.1 uGPS Convergence Monitoring ... 44
4.6.2 Deswik.CAD Underground Convergence Measurement ... 45
CHAPTER 5 ... 49
Results and Discussion ... 49
5.1 Accuracy and Repeatability Results ... 49
5.1.1 Target Location Repeatability- Target Tests ... 49
5.1.2 Convergence Accuracy Due to Target Spacing - Target Tests ... 51
5.1.3 Target location Accuracy - Target Tests ... 54
5.1.4 Point Cloud Distance Measurement Repeatability-Measurement Tests ... 56
5.1.5 Point Cloud Distance Measurement Accuracy-Measurement Tests ... 57
5.1.6 Accuracy - Deformation Test ... 58
5.2 Overbreak Calculation Results ... 60
5.2.1 Actual Overbreak and Geological Study ... 60
5.2.2 Overbreak and Shotcrete Thickness ... 65
5.3 As-Planned vs. As-Built ... 69
5.4 Deformation Calculation Results ... 72
5.4.1 uGPS Convergence Monitoring ... 72
5.4.2 Deswik.CAD Underground Convergence Measurement ... 75
5.4.3 Comparison of the two methods ... 87
CHAPTER 6 ... 89
Summary, Conclusions and Recommendations ... 89
6.1 Summary and conclusions ... 89
6.2 Recommendations ... 91
6.2.1 Installing and Operating uGPS System ... 91
6.2.2 Scanning Data Analysis ... 92
6.2.3 uGPS System Usage ... 92
1
CHAPTER 1
IntroductionLKAB’s Malmberget Mine is an iron ore mine located in Gällivare municipality, about 70 km north of the Arctic Circle. The rich iron deposits in Malmberget are the reason why Luossavaara-Kiirunavaara AB, LKAB, carries out mining operations there. The company operates three surface mines in its Svappavaara field and two underground mines in Kiruna and in Malmberget. In the underground mines, the ore is extracted by using sublevel caving mining method with production occurring at more than 1000 meters depth below ground surface. Sublevel caving is an efficient mining method used for steeply dipping orebodies. As the mining continues at greater depth, several challenges such as high stress, seismicity, large deformation etc. are encountered in the mines. It was necessary to adopt new techniques and measurement methods to improve the understanding of stress changes and deformation development as a result of the mining process and its operations.
LKAB is one of several companies that is seeking to use emerging and new technologies to overcome the challenges encountered by its underground mine operations in Kiruna and Malmberget as it continues to mine for iron ore at greater depth.
1.1 Problem Statement
New technologies can benefit the mining industry and consumers by increasing safety factors, reducing problem-solving time and improving the effectiveness of mining operations. One of these new survey technologies is the mobile scanning system, such as the uGPS Rapid Mapper, a 3D laser scanning system specially designed for underground mining operations. The system, according to its specification, can provide a 3D model for the underground tunnels with less data collection time. The data can be collected easily and quickly with acceptable quality. The mapping could be done for both vertical and horizontal openings. The device is easy to install and use with no network required. The uGPS Rapid Mapper laser scanning system has not previously been tested at LKAB’s underground mines.
Keeping the excavated crosscut profile as the designed profile is one of the challenges that LKAB faces in its underground mines when using drilling and blasting excavation technique. Overbreaking is the excavation or caving that occurs outside the planned design excavation of a tunnel in an irregular pattern of rock. The consequences of the overbreaking are not
2
immediately noticeable after the blasting, but it becomes more pronounced over time in connection to underground instability and in cost perspective when applying rock support. Creep or time-dependent deformation is the tendency of the soft rock or fractured rock mass, manifesting a slow and permanent deformation under the influence of induced stresses. The understanding of time dependent deformation for underground excavations is becoming more important with increasing of in-situ stresses, opening size and temperature changes expected in underground environment. However, there is still lack of technology which can be used to measure the deformation in an easy and quick manner.
1.2 Objectives
The objectives of this thesis work are to
• Test the repeatability and location accuracy of the uGPS Rapid Mapper laser scanning system,
• Investigate the influential factors on the scanning system’s reliability for measuring deformation, and
• Analyze the overbreak and time-dependent deformation of underground crosscuts by using this scanning system.
1.3 Scope
The scope of this report is to study how the uGPS Rapid Mapper works by conducting scans of underground tunnels and by carrying out several tests to see both the accuracy and repeatability of the results taken. Also, the overbreak percentage due to blasting was calculated by using the uGPS scanner in newly developed areas. The data captured with uGPS Rapid Mapper was analysed to calculate the deformations that occurred over a four-month period. The studies conducted here were focused on generating a general understanding of the accuracy and repeatability in many different circumstances. While the testing was carefully conducted, only a small sample size was available for some of the tests.
Some testing, especially overbreak-related, was focused on determining potential use cases and a comparison with other new potential methods of measurement. The results are not statistically significant and are not representative of the whole mine in general.
3
CHAPTER 2
Background2.1 Sublevel Caving Mining Method
Sublevel caving (SLC) is an underground mining method used to extract massive orebodies. Malmberget mine uses sublevel caving as the mining method while maintaining a high degree of productivity and safety. The implementation varies in terms of mine design, ring design, and draw control strategy. The mine has dispersed ore bodies with varying mine design parameters. The mine also utilizes different opening techniques for production crosscuts (Gurmeet et al, 2017).
The whole rock mass where excavation is made is divided into three different parts; the valuable rock mass (Ore) from which minerals can be extracted economically, the rock mass overlying that ore (Hanging wall) and the rock mass underlying that ore (footwall). In the sublevel caving method, the ore body is divided into vertical sections by excavating horizontal crosscuts (production crosscuts). The method design is called longitudinal sublevel caving when the production crosscuts are along the length of the ore body, while it is called transverse sublevel caving when the crosscuts are across the orebody width (Cokayne, 1982).
2.2 Site Description
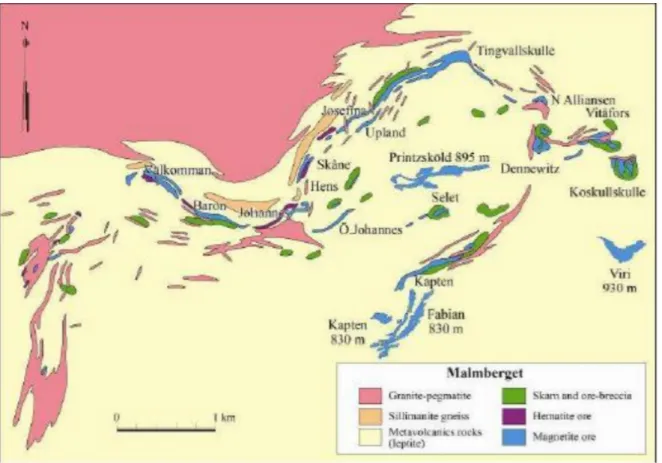
The iron ore region consists of 20 orebodies spread over an underground area of about 5 by 2.5 km, around half of which are in production today, with varying degrees of tonnage. Nowadays, mining ranges between 800 and 1200 m depth, and the orebody dip varies between 45 and 75 degrees, with an average dip 45 - 50 degrees (Jones et al, 2019). Fig. 2.1 shows the Malmberget deposit field. The largest deposits of iron are found in the Alliance, Hopper and Prinzsköld ore bodies zones.
4
Figure 2.1 A schematic 3D-picture illustrating the ore bodies at the Malmberget mine. Alliansen orebody is one of the largest orebodies in the mine and is located at the north of Malmberget orefield. The orebody strikes east to west with dips 60 degrees to the south with an average width of 50 m. Alliansen orebody interferes with the Printzsköld orebody at around 1000 m depth, creating an orebody of 2 km long (Jones et al, 2019).
Hoppet orebody is a narrow ore body that looks like a bridge and links the two larger and wider ore bodies Alliansen and Printzsköld. It is characterized by a much narrower ore width than the either Alliansen or Printzsköld (Sandberg, 2017). Printzsköld is located in the middle of Malmberget ore field. The orebody consists of magnetite and strikes 40 degrees towards the northeast and has a dip of approximately 60 degrees. The orebody starts at 600 m depth below the ground surface. The thickness of the orebody increases towards depth. In the upper parts, the orebody is about 400 m long and approximately 50 m thick. Deeper down, it gets longer, about 800 m, and also thicker. The thickness varies over the orebody between 50 - 80 m (Debras, 2010).
2.3 Geology
The geology of the Gällivare region contains two major sub-surface zones with rocks of volcanic origin at the eastern part, while volcanic rocks of moderate composition command the west. They are intruded between volcanic and sediment rocks at the southwestern sub-surface (Martinsson et al. 2013).
5
Aitik and Nautanen deposits are hosted in a series of sedimentary volcanic rocks linked within the Svecofennian rocks. Malmberget deposit is hosted inside Kiirunavaara's (kiruna group) metavolcanic rocks. The nature of the rocks varies from trachyandesitic to rhyolitic with sometimes basaltic interventions. Aitik deposit is hosted by Muorjevaara group (Jonsson, 2017).
Malmberget iron ore deposit consists of around twenty different-sized ore bodies as shown in Figure 2.2 The ore bodies cover an area of two kilometers from north to south and five kilometers from east to west. Underground mining operations are presently focused on about ten orebodies, which are massive magnetite ore bodies with a slight occurrence of hematite and contain 51% to 61% Fe with the various phosphorus content (Lund, 2013).
Figure 2.2 Geological map with the magnetite and hematite ore bodies in the Malmberget deposit (Bergman et al. 2001).
Printzsköld area is covered by irregular massive magnetite with minor hematite orebody and is located at the middle of the Malmberget deposit between the eastern and western parts. Hoppet orebody is considered as a part of Printzsköld. Alliansen orebody is bent into an open-closed synform with a surrounding surface, directed ENE-WSW with a dip to the south direction. The
6
ore body appears thick inside the bent hinge and shows a distinct orientation as a response to bending. The bent hinge at the ground level shows a distinct M-folding pattern (Jonsson, 2017). The mine geology in the area consists mostly of the magnetite ore (MGN), Grey Leptite (GLE) with biotite inclusions, Red grey Leptite (RGL), Grey-red Leptite (GRL), Biotite schist (BSF), Granite (GRA) and Red Leptite (RLE). RLE is quite good rock and has a similar rock character as the GRA. Also, RGL and GRL almost have a similar rock character as the GLE, whereas, GLE is the worst and leads to an underestimated rock strength. Table 2.1 shows the rock properties for the intact rock.
Table 2.1 Rock properties for the intact rock (LKAB, 2019).
Rock Material 𝑼𝑪𝑺 ⌈𝑴𝑷𝒂⌉ 𝑬⌈𝑮𝑷𝒂⌉ 𝑫𝒆𝒏𝒔𝒊𝒕𝒚 3𝒌𝒈/𝒎𝟑8 𝒎 𝒊 MGN 90 62 4700 24 BSF 77 47 2900 13 RLE 238 72 2900 34 GLE 144 57 2980 20 GRA 207 51 2660 - RGL 144 48 2876 GRL 199 67 2800 21
The meaning of the parameters used in Table 2.1 is defined as follows. • UCS: Uniaxial Compressive Strength
• E: Young’s modulus
• mi: material constant for the intact rock
2.4 Overbreak
Overbreak in tunnelling is defined as a part of the damaged area outside the planned profile of the support elements that collapsed during rock blasting and excavation. Overbreak caused by the blast damage during the tunnelling increases costs correlated with filling the fallen zones with shotcrete. This can increase the total cost of civil tunnelling by about 15% or even more of the planned construction cost (Daraei and Zare, 2018).
Monitoring the field blasting practice and the use of small-scale blasting provide a better understanding of the performance of the blast in general and help to determine which aspects
7
of blasting have a major impact on overbreak control. According to Singh (2018), the following are the aspects most able to help with overbreak control in underground mining:
• Drilling and blasting practice
• Explosive characteristics and distribution • Explosive products for perimeter control • Blast design
• The relevance of rock mass characterization to blasting results
Overbreak is seen as an indicator of the blast damage in the form of the failure zone. Overbreak from the planned tunnel profile is caused by several factors which includes: practical overbreak (drilling geometry) due to poor monitoring to maintain the required tunnel area, pre-blast overbreak (drilling inaccuracy) due to inaccurate collar placement and drill hole deviation and post blasting overbreak (blasting damage and geological structures) due to natural rockfalls and scaling (Van Eldert, 2017).
2.4.1 Survey and Measurement Methods
Overbreak is usually expressed in the average distance (m) or percentage (%) of the overbreak compared to the designed area of the tunnel. The mechanical distance is measured by using a telescopic rod method. The precision of this method is limited to the number of points measured in the zone. For comparison between the blasted area with the planned area, the Light Slot method is used. The overbreak calculation can be evaluated with a Planimeter or done by the Computer. The accuracy of light slot method is 2% better than the telescopic rod method. The Laser Beam can also be used to measure the distances. However, the accuracy of this method depends on the number of readings taken, in which the accuracy can be made as high as in the Light Slot method (Rustan, 2010).
According to Van Eldert (2017), there are two general methods of overbreak and excavation damage zone investigation (see details in Table 2.2):
• The indirect method: It is a method by which the wave amplitude of a pressure wave after blasting is measured, such as the Peak Particle Velocity method.
• The semi-direct and direct methods. Which uses mechanical and geo-mechanical measurements, such as Half Cast Factor, Scaling time, Scanning, and Loading time methods.
8
Table 2.2 Methods used for overbreak and excavation damage zone investigation (Van Eldert, 2017).
Method Advantages Limitations
Peak Particle Velocity
No production interruption, already recorded data (vibration)
Not a good picture, ignores many parameters, based on arbitrary
relationships, site specific Standardized
Blasting Tables
No production interruption, predicting damage based on
explosive charge
Based on PPV, based on arbitrary relationships, site specific
Half Cast Factor Limited interruption, simple, very
fast Only surface data, minimal depth
Scaling time No production interruption,
already recorded data
Indication only, depending on operator quality and skill
Scanning Accurate method, objective
Needs practical contour and drill hole location to establish over
break, time consuming (45 minutes)
3D
photogrammetry
Limited interruption, good indication
Shadowing, needs practical contour and drill hole location to
establish over break
Loading tonnage Clear tonnage of rock mass,
production-based data
Needs practical contour and drill hole location to establish over break and EDZ, needs accurate rock mass density and swell factor
Loading time Indication on amount of rock
mass, production data
Only indication, needs “loading tonnage”, highly influenced by fragmentation and loading issues
Tunnel mapping Clear picture of the surfaces,
fracture orientation etc
Only surface data, interruption of the production
Ground Penetrating
Radar
Micro fractures can be detected, limited interruption, 3D picture,
penetrated the rock mass
Not able to penetrate shotcrete, no difference in natural and blasting fractures, metal objects interfere,
9
calibration and interpretation is needed
Core drilling Fracture type and filling,
penetrated the rock mass
Time consuming (interruption), sparse data collection Rock Slicing
Fracture type and filling, penetrated the rock mass, 3D
picture
Very expensive and time consuming (interruption)
P-wave velocity Micro fractures can be detected,
standardized method
Need drill cores or hole-to-hole data
2.4.2 Previous Investigation for Overbreak
Oldhammer (2017) set up a measurement to investigate the overbreak in underground crosscuts and crosscuts at the Malmberget mine. Stereo photography and Shape MatriX software was used to create a 3D model of the field or cross-section. The 3D model volume was calculated using the 2D cutting section, which was then compared with the theoretical profile. The advantage and purpose of this type of 3D model was to reflect the current conditions when the photographs were taken. Stereo photography takes two photos on the same object with different viewing angles. Figure 2.3 shows the performance criteria for stereo photography performance.
10
MicroStation was used to calculate the area from the sections taken in ShapeMetriX. The sections are imported into MicroStation where each file contains the step before and after scaling. Figure 2.4 shows the two sections compared to the theoretical profile of the tunnel.
Figure 2.4 Tunnel profile before and after scaling compared to theoretical profile
The tunnel profile before scaling is shown with a blue line, after scaling with a yellow line and cross-section of theoretical profile with a red line. The step before scaling is compared with a theoretical profile to indicate how the drilling and blasting affect the tunnel cross-section and is reported as overbreak before scaling. The step after scaling indicates how drilling, blasting and scaling affect the cross-section. This is reported as overbreak after scaling.
The volume results were calculated using MicroStation for the crosscuts and crosscuts for both before and after scaling. The angle of drill holes was taken into account to get an idea of how the drilling pattern follows the actual drilling plans used (Oldhammer 2017). The calculation for the theoretical overbreak, and overbreak with regard to the angle of drill holes were carried out using equations 2-1, 2-2, 2-3, 2-4 and 2-5 respectively.
("#$%&' )'*#+' ,-.$/012 34'#+'5/-.$ 6#$%&')
34'#+'5/-.$ 6#$%&' × 100 = 𝑂𝑣𝑒𝑟𝑏𝑟𝑒𝑎𝑘 𝑇ℎ𝑒𝑜𝑟𝑒𝑡𝑖𝑐𝑎𝑙 𝑏𝑒𝑓𝑜𝑟𝑒 (%) Eqn. (2-1)
("#$%&' .*5'+ ,-.$/012 34'#+'5/-.$ 6#$%&')
11 ("#$%&' )'*#+'2 6#$%&' *#$$#8/01 9:;<< =><?@ ABCC?:D) E><FG? H><<I>;DJ BDJ<?9 9:;<< =><?@ ABCC?:D × 100 = 𝑂𝑣𝑒𝑟𝑏𝑟𝑒𝑎𝑘 of drill holes 𝑏𝑒𝑓𝑜𝑟𝑒(%) Eqn. (2-3) ("#$%&' .*5'+ ,-.$/012 K><FG? H><<I;DJ 9:;<< =><?@ ABCC?:D) E><FG? H><<>I;DJ BDJ<?9 9:;<< =><?@ ABCC?:D × 100 = 𝑂𝑣𝑒𝑟𝑏𝑟𝑒𝑎𝑘 of drill holes 𝑎𝑓𝑡𝑒𝑟(%) Eqn. (2-4) ("#$%&' .*5'+2 6#$%&' )'*#+') 6#$%&' )'*#+' × 100 = 𝑆𝑐𝑎𝑙𝑖𝑛𝑔(%) Eqn. (2-5)
According to Oldhammer (2017) when the documented blasts were compared with the theoretical crosscuts during the working period, about 30% of the overbreak for crosscut and crosscut was generated when compared to the theoretical profile. If the angle of drill holes is taken into account, the maximum overbreak is 10% for crosscut and slightly higher, 12-18%, for the drift. Scaling generated 1-10% of the overbreak.
2.5 Deformation Measurement
2.5.1 Measurement Methods
Deformation monitoring methods can be divided into two main categories. These include methods that measure the rock mass deformations that appear on the rock surface and methods that measure the deformation within a rock mass. The first category includes geodetic methods (total station), GPS measurements, radar-based measurements, and laser scanners which record the total induced displacement of the rock mass on the surface. The second category includes the use of extensometers and inclinometers installed in the rock mass.
Geodetical methods are a measurement of distance, angles and levels. They are used to record settlement or heaving on the ground surface and the rock response within the excavation. This type of measurement only measures point locations. Thus, if the same point is measured twice from a fixed location, then it can be determined if this point moves in three dimensions. Prisms are normally used to ensure that repetitive measurements are taken at the exact same point. This method is widely used in mines.
Monitoring takes place in underground openings related to mining projects for a few reasons: • To enhance the occupational safety of staff and equipment during construction.
12
• To confirm the performance of the underground opening within design limits during its operational and production lifetime.
• To identify irregular behavior that may be indicated to the instability of the underground opening.
There are some of the underground measurement technologies such as a strain gauged rock bolts, strain strips, potentiometric measurements, tunnel profile monitoring system, convergence sensors, rod/tape extensometers, and borehole extensometers (Jones and Beck, 2017).
2.5.2 Convergence Monitoring
Underground tunnels, shafts, and crosscuts are subjected to enormous stresses caused by the loads distributed in the surrounding rock. The stress field around these excavated openings creates plastic deformation that causes them to slowly close. This phenomenon is known as convergence. Measuring and understanding convergence is important for engineers and workers who operate in the underground tunnel. Large convergence in underground mining is a very serious concern and causes damage to equipment and infrastructure. In addition, it causes project delays and production losses, as well as posing a great risk to human safety (Lynch et al., 2018).
According to Jones and Beck (2017), the convergence monitoring is a broad term related to identifying positional changes in the excavation geometry over time. The excavation geometry either remains stable, diverges or converges with time. It is imperative that any analysis shows the magnitude of movement and recognize the difference between divergence and convergence. This is required to ensure that the alignment between the first and other scans is sufficiently accurate, and the final results represent the movement that occurred in the excavations. Figure 2.5 shows a cross-section of a deformed drive showing different directions of movement.
13
Figure 2.5 Cross-section of a deformed drive showing different directions of movement (Jones and Beck, 2017).
The distance between primary and secondary scanning can be calculated using various commercially available algorithms. It has been found that using a point-to-point calculation technique provides a quick appreciation for movement. However, more complex algorithms compute an average local surface of the first scan and then computes the vector displacement to the average local surface of the other scans. The visualization of the output file is best done in three-dimensions, such that the location and displacement magnitude can be appreciated along with whether convergence or divergence is occurring as presented in Figure 2.6.
14
15
CHAPTER 3
uGPS Rapid Mapper™
3.1 uGPS Rapid Mapper™ Laser Scanning System
uGPS Rapid Mapper™ System is a rapid 3D underground scanner which uses two individual laser scanners to create a point cloud of the scanned area. The system provides 3D data for many applications in an easy way and a short time for vertical and horizontal openings. The device is versatile and can be installed on different moving platforms in different orientations. The data is collected at typical vehicle speeds of 5 to10 km/h. The device is easy to install and use and does not require an underground network.
The uGPS scanner consists of two planar laser scanners with 270 ° field of view • The horizontal laser scans rib to rib and is used to estimate movement.
• The vertical laser scans the crosscut profile and is used to create a 3D cloud point. The vertical laser scans perpendicular to the direction of travel, resulting in a series of tomography scans, which sequentially produce a 3D scan for the environment. The spacing between the scans is related to the travel speed (Slower capture = higher point density). The horizontal laser scans the area in front of the scanner and helps locate the scanner in the space by identifying the walls of the tunnel.
The dimensions of the device are 20 x 30 x 30 cm with about 12 kg of weight. The device's core components are sealed against dust and moisture. The device has about 10 to 30 V DC input range power supply with -30 to +60 °C operating temperature. Only one power cable is required (Curtis and Andrew, 2017). see Figure 3.1.
16
Figure 3.1 uGPS Rapid Mapper device (Curtis and Andrew, 2017).
3.1.1 Targets Deployment
High reflectivity targets are installed at survey control stations, with a minimum of 2 targets necessary to conduct automatic georeferencing of the point cloud. These targets are identified within uGPS scans and provide known reference points that are used for georeferencing and alignment. Target accuracy: 1-3 cm typical. see Figure 3.2
17
The targets are compatible with Leica prism rods existing hardware (see Fig. 3.3). Targets are installed at fixed underground points. Each target has an ID, axes, offset, zone, level, panel and orientation. The targets are inexpensive and rugged.
Figure 3.3 Leica prism rods (Peck-Tech, 2016).
The benefits of using these targets are that they improve the scan accuracy, simplify referencing of the scans for the same area with different times and to be used as underground geographic references. A minimum of two targets are required for automatic scan alignment. These targets are identified automatically within the uGPS scans and are automatically extractable from point clouds (Peck-Tech, 2016). The targets' coordinates are saved in a human readable file, the Control Points (CP) File which is used by the uGPS software for automatic georeferencing.
3.2 Previous Investigation for uGPS Rapid Mapper™ System
Lindsay, (2016) prepared an experiment in an underground mine with major convergence issues by collecting the data from uGPS scanner and analysed these surveyed results. The experiment was conducted using uGPS Rapid Mapper™ System. The preparation was done by installing the uGPS scanner in front of a vehicle and connected to a laptop via Wi-Fi. Before start scan, the scanner was calibrated each day when it was removed to ensure that the x, y and z coordinates are well defined.
18
When the scan was started, uGPS machine created point clouds as its default output (X, Y, Z) for each point in the area. Each crosscut and crosscut were scanned regularly to obtain more useful convergence monitoring data. The sensor data from the uGPS machine was used to create a primary crosscut map. This map takes the form of an occupancy grid. All scans that have been taken in the same area should match the expected location using the expected range values based on their estimated location. Knowing the position of the scanner allows a comparison of sections for subsequent scans. Four forms of convergence mode were used in the experiment which included;
a. Concentric convergence mode, similar to regular shear failure. b. Oval convergence mode, simulating buckling crosscut failure. c. Arch crosscut convergence mode, similar to plane's sliding failure.
d. Toe spalling convergence mode, tending to occur underground without following any of convergence mechanisms listed above.
The convergence monitoring algorithm was run on data sets for each month of 2016, from August 25 to December 1 while the uGPS unit was on loan to the mine site. The August 25 data was used as the baseline for comparison with the other four data sets (see Figure 3.9).
19
The convergence monitoring algorithm was tested on these convergence modes. Convergence index responses were recorded for the convergence of an incremental crosscut from 0 to 0.5 meters of diameter change. Figures 3.10 – 3.13 shows the indicator response from simulation of each convergence modes.
Figure 3.10 Indicator response from simulated oval convergence.
20
Figure 3.12 Indicator response from simulated concentric convergence.
Figure 3.13 Indicator response from simulated arch crosscut convergence.
The result showed the convergence response using the oval convergence mode, in which it was stretched horizontally and then compressed vertically through a small gradual change (Over 100 increments). The oval shape led to change to 0.5 m of convergence.
The convergence response using the toe spalling convergence mode resulted in a similar correlation with respect to convergence magnitude and the resultant indicator values.
The convergence response using the concentric convergence mode resulted that cross-sectional area change is the most correlated indicator of this type with no other closely related responses. As for the response using the arch crosscut, convergence mode showed a strong correlation with all of the convergence indicators. Thus, changes in the crosscut cross-section can be inferred from the convergence indicators.
21
During the study of the deformations at LKAB’s Malmberget mine, a somewhat similar method was used which is called "Underground Convergence Measurement". However, convergence was not classified according the four modes during the study due to time constraints.
22
CHAPTER 4
Methodology4.1 Underground Scanning
The uGPS Rapid Mapper™ System was used to scan specific areas of LKAB Malmberget underground mine. The data was collected over four months’ time. Each area was scanned several times with similar time intervals to study the overbreak and the deformation during the scanning period.
The first part of this work focused on the repeatability and accuracy of the uGPS Rapid Mapper™ System by conducting several tests, to improve understanding of the performance of the machine and increase the accuracy of the interpretation of results. The collected data were analysed using CloudCompare software.
The scan areas were selected at the mine to carry out the repeatability and accuracy tests for different reasons. First, the areas were safe to move around and install the targets needed for these tests. Second, the areas were almost free of traffic. Thus, fewer disturbances during scanning.
Most of the tests were carried out by scanning the area facing south direction due to the orientation of the orebody.
During the scanning process, the vehicle was driven in the middle of the crosscut or crosscut with a speed of 3 km/h. The scan was repeated in case of any person or vehicle showed up during the scan process (moving objects in the scan can impart error).
Start and end scan points were marked on the wall to start and end the scan at the same locations each time the scan was repeated.
The second part of this work studies the usefulness of the uGPS system scans for calculating the overbreak and attempts to determine the causes of the overbreak compared to the geology of the region. This part was analysed using Deswik.CAD software.
The third part of the work studies the deformations that occurred during the four-month scanning period and compares two different deformation analysis methods. Determining the cause of the deformation is outside the scope of this work. The two different methods used were "uGPS Convergence Monitoring" and "Deswik Underground Convergence Measurement."
23
4.1.1 Scanning Preparation
In the beginning, targets were deployed around some specific zones in the main transportation drive on Alliansen level 992m, and in production areas on Printzsköld levels 996m, 1023m, and 1051m, Hoppet level 1023m, 1051m, and 1080m, and on Alliansen level 1052m and 1082m.
After installing the targets, the coordinates for all targetse were surveyed. Each characteristic of the target and initial position were input into the control point file. Before starting the scan, the uGPS Rapid Mapper base was fixed in front of the vehicle to securely install the device on to it. The device was then connected to the electricity in the vehicle. Also, the device was connected to a laptop via WiFi. After that, the device page was accessed through standard web browser (Google Chrome). Finally, the machine was calibrated on a flat ground with the vehicle turned off to avoid any vibration effect on the calibration process. These steps were repeated anytime the machine was removed from the base installed onto the vehicle before starting the scan.
4.1.2 Scanning Procedure
The scan was started 5m before the first target (the initial position) and ended at 5m after the last target. This was to ensure that all the targets are included or covered within each scan. The initial position was marked at the wall such that rescanning can be carried out again at the same point at a different time. The vehicle was positioned in the middle of the tunnel to ensure approximately equality in point-cloud density. The scanning was then started by clicking on “start recording” on the device page (see Figure 4.1). The vehicle speed was 3 km/h during the scanning to ensure an accurate scan with ideal point-Cloud density.
24
Figure 4.1 uGPS Rapid Mapper page.
After the scanning was stopped (stop recording), description information about the area was added as shown in Figure 4.2.
25
4.1.3 Data Processing
When the scan was completed, the data was downloaded as a .dtz point cloud file with an accompanying text document for each scan and saved with a new name and date specific to that scan. The data was processed via uGPS Rapid Mapper Scan File Converter software in several steps. First, the .dtz file with .csv file (control point file) was converted to a georeferenced .las file, at the same time convergence monitoring reference file (.pcd) was saved. The convergence calculation was then completed by comparing the reference file with the new scan’s .dtz file for the same area.
4.2 Accuracy and Repeatability Analysis
4.2.1 Target Location Repeatability- Target Tests
Six targets were installed in the entry crosscut number 2590. Only the first and last of them had been surveyed and input into the CP file (T91and T92), while the other four targets were installed in the entry between two Control Points (CP91 and CP92).
This test measures repeatability using the uGPS system, through investigating the repeatability of algorithms that estimate the location of things within the entry at each of the four targets (T1, T2, T3 and T4). The processing algorithm identifies and lists in a target output file the coordinates of every target that it identifies whether or not those targets are control points being used. This allowed a clear understanding of exactly where (XYZ coordinates) the system thought each target was located within the mine’s coordinate system.
Because some of the georeferencing error is due to crosscut relative to the distance between the control points, the calculated distance between each target is presented in Table 4.1. Figure 4.3 also shows the target locations in the crosscut where the test was carried out.
26 Table 4.1 Distance between targets
Target Distance (m) From To T91 T1 11.8 T1 T2 11.4 T2 T3 11.6 T3 T4 12.6 T4 T92 13.9
Figure 4.3 Locations in crosscut for the repeatability test.
The area was scanned five times in a row from T91 to T92 using the uGPS. The driving speed was uniformly maintained to avoid any change in density of each scan model. The five scans’ data in a .dtz format were converted using the Scan File Converter. One of the .dtz conversion outputs is a CVS file called TargetsLog. This file has the X, Y and Z coordinates for each target.
The SFC reads the point cloud and identifies any targets that it sees within the scan. The system then uses the scan starting location and Zone/Level/Panel/Orientation tags to determine if any of the Targets identified in the scan are also control points by cross-referencing with the CP_File. Once the CPs are identified, their locations are used in order to estimate the locations of all other targets identified by SFC and the locations of all Targets, whether or not they are CPs, is input into the TargetsLog.
The values from each scan were used to calculate the difference between each scan for the same target along the x-axis plane. The calculation was repeated for both the Y and Z axis respectively using equations 4.1 to 4.3 below.
27 𝑥,-.0L5ML − 𝑥 ,-.0N5ML ……… (Eqn. 4.1). 𝑦,-.0L5ML − 𝑦 ,-.0N5ML ………. (Eqn. 4.2). 𝑧,-.0L5ML − 𝑧 ,-.0N5ML ………….……… (Eqn. 4.3).
The standard deviation of the five scans was then calculated for each target on the X, Y and Z axes using equation 4.4 below. This shows the precision or spread of the target locations.
H∑(P2P̅)!
(02L) ... (Eqn. 4.4)
4.2.2 Convergence Accuracy Due to Target Spacing- Target Tests
This test was carried out at Hoppet 1080m/ Drift 1 to highlight the importance of having well-spaced surveyed targets at the monitoring site. Using the an internal flag in the control point file each target can effectively be “turned off” or “turned on”, so that it is or is not ignored during processing of the data. By turning the targets off or on this investigation looks at the impact of target spacing.
The convergence monitoring software will tend to crosscut during driving, depending on the level calibration conducted when the scanner was installed. Error is reduced by using periodically installed surveyed targets. The greater the distance between the closest Control Point and the location being measured, the greater the error. In order to reduce the error, the distance between the targets should not be too large but having too many targets will increase processing time. To investigate this, four targets selected along the drift 1 drive are presented in Figure 4.4 and the distance between each target is also presented in Table 4.2. Scanning in this test started at T51 and drove towards T62.
Table 4.2 Distance between targets. Target Distance (m) From To T62 T53 111.7 T53 T52 56.9 T52 T51 85.2
28
Figure 4.4 Hoppet 1080m/ Drift 1 crosscut with targets as reference model.
The scan data .dtz file was converted to .las file, where all the targets were given locational attributes in the control point (CP) file. The .las file with all targets turned on was then set as a reference model. The same scan data .dtz file was converted different five times to a new .las file with five difference model names outlined below.
• Model (1). Target T62 has no locational attributes in the control point (CP) file (i.e. the target was turned off). The rest of the targets were assigned locational attributes in the control point (CP) file (i.e. the targets were turned on).
• Model (2). Target T53 has no locational attributes in the control point (CP) file (i.e. the target was turned off). The rest of the targets were assigned locational attributes in the control point (CP) file (i.e. the targets were turned on).
• Model (3). Target T52 has no locational attributes in the control point (CP) file (i.e. the target was turned off). The rest of the targets were assigned locational attributes in the control point (CP) file (i.e. the targets were turned on).
• Model (4). Target T51 has no locational attributes in the control point (CP) file (i.e. the target was turned off). The rest of the targets were assigned locational attributes in the control point (CP) file (i.e. the targets were turned on).
• Model (5). Target T52 and T53 have no locational attributes in the control point (CP) file (i.e. the targets were turned off). The rest of the targets were assigned locational attributes in the control point (CP) file (i.e. the targets were turned on).
The difference between the reference model and each of the five (1, 2, 3,4 and 5) models was calculated for the same target along the x-axis plane. The calculation was repeated for both the Y and Z axis respectively using equations 4.5 to 4.7 below.
𝑥:?H?:?DR? G>9?<3SN − 𝑥
T>9?< L3SU ……….. (Eqn. 4.5)
𝑦V?H?:?DR? G>9?<3SN − 𝑦
29 𝑧V?H?:?DR? G>9?<3SN − 𝑧
T>9?< L3SN ...(Eqn. 4.7)
CloudCompare was again used to compare each of the five different models to the initial or original reference model to investigate the apparent deformations (error) that occur with each target when the target it turns off, thus simulating having varying linear distances between surveyed targets.
4.2.3 Target location Accuracy- Target Tests
This test was conducted in order to investigate how correctly the uGPS system actually locates the scanned control points within the 3D point cloud when conducting processing of the data. Ideally each Control Point Target should be located exactly at the location of the coordinates as surveyed and input into the CP file. However, due to the need to adjust the point cloud to best fit the entire dataset, offsets can occur.
This test was carried out at the areas that were scanned, and where all the targets were assigned locational attributes in the control point (CP) file. In this case, two different types of the coordinates were used for each target, namely;
• CP file target coordinates (according to the surveyed locations)
• uGPS point cloud coordinates (calculated locations by the computer during processing of scanned data).
The coordinates are presented in Table 4.3 for each CP ID for the surveyed target location and the calculated location by the computer (uGPS).
Table 4.3 Coordinates for each target location
ID Surveyed Coordinates
Calculated coordinates by the computer (uGPS) X Y Z X Y Z CP 51 1589.958 -93.307 -1076.45 1589.937 -93.316 -1076.45 CP 52 1497.084 -137.788 -1078.09 1497.069 -137.85 -1078.08 CP 53 1448.955 -168.163 -1077.27 1448.97 -168.215 -1077.27 CP 62 1385.393 -224.895 -1076.61 1385.393 -224.904 -1076.61
30
This test measured the error at each target and analysed how the difference in coordinates affects the accuracy of the scan. It was carried out at Hoppet 1080m/ Drift 1. The difference between the two coordinates presented in Table 3.7 for each target on the x, y, and z axes was calculated. The knowledge about how performance varies in each dimension can be valuable for better understanding the source of the error.
4.2.4 Point Cloud Distance Measurement Repeatability-Measurement Tests
This test was also carried out at Hoppet 1051m, crosscut number 4090 to study the repeatability of making measurements within a point cloud collected by the uGPS. This test was done by using CloudCompare to measure the distance between two points within the point cloud. The repeatability of this test is not dependent upon the convergence algorithms of the uGPS system but is rather a function of the data collection capabilities of the laser scanners incorporated into the system. It is also dependent upon the ability of a user to select the identical point within the point cloud for measurement within the software.
A specific area in the crosscut was selected and the walls were marked with two white spray-painted points opposite each other on the walls. The distance between the two points was measured with a laser distance meter. The measurement was repeated three times, and the average value was determined.
The crosscut was scanned several times and the distance between the points was manually measured from each scan’s 3D point cloud using CloudCompare software. The average value from the laser distance meter was compared with the results from CloudCompare. Figure 4.5 shows the test setup with the two points in cloud compare.
31
Figure 4.5 Measurements distance between two points with CloudCompare.
4.2.5 Point Cloud Distance Measurement Accuracy-Measurement Tests
The goal of this test was to gain information about the accuracy of the measurements taken by the uGPS scanner using a handheld laser distance meter as a reference. The results of this test are not dependent upon the system’s convergence measuring algorithms and as such are dependent upon the laser scanners themselves, not the data processing methods.
This test was conducted to study the accuracy of the laser scanner when measuring distances within the scan. The test was done at Hoppet 1051m, crosscut number 4090. A specific crosscut area was selected, and the crosscut geometry was marked with paint to make the measurement points visible in the ClouldCompare software. The distance from one point to the other was measured with a laser distance meter. The measurement was repeated three times and the average value was determined. The average distances from one point to the other (lines A through G) are presented in Figure 4.6.
32
Figure 4.6 Distance measurement for crosscut geometry.
Mapper. The scan data was converted from .dtz file to .las file, and the data were analysed using 3D point cloud software (CloudCompare). In CloudCompare, the "point picking" feature was used to determine the length of each line, which was then compared vs the laser distance meter measurements. This is shown in Figure 4.7.
Figure 4.7 Distance measurement with CloudCompare
4.2.6 Accuracy - Deformation Test
The main purpose of this test was to investigate the capabilities of the uGPS system during calculation of detected convergence underground. Accuracy and resolution of the convergence measurement were both of interest. The test was also carried out at Hoppet 1051m, crosscut number 2090. In this test, three wooden frames were built in the form of triangles with varying
33
heights (see Figure 4.8). The first, second and third wooden triangles were 80, 45, and 25 cm high respectively.
Figure 4.8 Wooden bases with different height.
Prior to the installation of the wooden bases to the wall, the crosscut was scanned, and this scan was considered as a reference model. The wooden bases were then fixed directly to the wall, as presented in Figure 4.9.
Figure 4.9 Wooden bases installed to the crosscut wall.
The crosscut with the installed wooden bases was scanned again, and this scan was named as "scan 1." The scanning process was repeated five times in total. For each subsequent scan metal washers were added on the mounting bolts between the wooden frame and the wall to control how far the frame was from the wall (Figure 4.10). The frames were moved outwards from the wall in 2 cm intervals each time to generate scans where the frame was 0, 2, 4, 6, and 8 cm from the wall. This created controlled artificial “convergence” in that location that could be
34
measured with the scanning system. Finally, each of the scans (1, 2, 3, 4 and 5) were compared with the reference model without wooden bases using CloudCompare software.
Figure 4.10 Increased distance between wooden bases and crosscut wall.
4.3 Overbreak Measurement
4.3.1 Actual Overbreak
The calculation of overbreak was carried out by comparing the existing opening size with the planned one. Factors such as the blast design, structure and geology that affect the overbreak were also considered. The study was carried out at Fabian 1005 level, (1310, 1330, 1350, and 1490 crosscut s) and Kapten 930 level, (5940 crosscut). The studied areas are presented in Figure 4.11. These areas are fresh rock (newly developed areas) without any support but scaled for safety reasons. The purpose of studying these selected areas was to calculate the overbreak caused by entry construction (including both blasting and the scaling).
35
The scans were carried out one day after the selected areas were developed and the data was analysed using Deswik CAD software. First, the data was imported to the software in .dtz format. The planned design was then drawn and created with the software. A reconciliation was then run for the planned designed and the scan model to calculate the overbreak percentage of the on the roof, sidewall 1, and sidewall 2. The overbreak on the floor was ignored, to avoid any waste rocks on the floor could give unreal results, the scan model was divided into several sections as shown in Figure 4.12.
Figure 4.12 As-built solid sections.
4.3.2 Overbreak and Shotcrete Thickness
At Fabian zone level 1005m, the crosscut numbers 1270 and 1430, scans were completed one day after the areas were developed and scaled, to calculate the overbreak percentage caused by blasting and the scaling. After some period, these two areas were scanned again, after they were supported by shotcrete. The aim was to find out the thickness of the shotcrete that was added in each area around the crosscut geometry and how it impacted entry size.
The data was analysed using Deswik CAD software. A reconciliation was run between "as-planned designed" and the "as-built solid after blasting" to calculate the overbreak percentage, along two meters length for the newly blasted area of the crosscut. Two meters was used because only a very short distance of the unsupported rock could be scanned without entering the unsupported area.
36
Another reconciliation process was run between "as-built solid after blasting" and "as-built solid after shotcrete" to calculate the volume and the thickness of shotcrete was added along two meters length for the newly developed area of the crosscut. See Figure 4.13.
Figure 4.13 (a) as-planned designed. (b) as-built solid after shotcrete. (c) as-built solid after blasting.
4.4 As-Planned vs. As-Built - Measurement.
At Printzsköld, level 1080, crosscuts 4000 and 3960 were scanned during the study period. these two crosscuts were developed, and support was installed more than four months prior to the date of the scanning in each crosscut.
The volume difference between the crosscut as-built and as-planned was calculated. See Figure 4.14
Figure 4.14 Selected areas at Printzsköld 1080m.
The scan was done for the selected areas and the data was analysed using Deswik CAD software. First, the data was imported to the software as .dtz format. The planned design was
37
then drawn and created with the software. A solid location was created around the model to show the crown, floor, sidewall 1 and sidewall 2. The purpose of creating a solid location (crown, sidewall 1, and sidewall 2) was to determine the overbreak in each separate location around the crosscut geometry.
A reconciliation was then run for the planned designed and the scanned model to calculate the volume difference percentage on the roof, sidewall 1, and sidewall 2. The difference in volume on the floor was ignored, to avoid any waste rocks on the floor could give unreal results, see Figure 4.15.
Figure 4.15 3D solid location model.
4.5 Geological Study
The geological information was collected for all the selected areas where the overbreak was calculated. The information about the rock type, GSI value, surface condition and the joint set are presented in Table 4.4.
38 Table 4.4 Geological information of overbreak zones.
Zone
Level/Crosscut number
Rock type Date of
develo ped Area length GSI value Surface Condition Joint set Fabian 1005/1270 Red-Grey Leptite with Granite inclusions 20-05-11 2m 50 FAIR: BLOCKY-well interlocked un- disturbed rock mass consisting of cubical blocks formed by three intersecting discontinuity sets Fabian 1005/1310 Red-Grey Leptite with Skarn, and Granite inclusions 20-05-11 2m 45 FAIR: VERY BLOCKY-interlocked, partially disturbed mass with multi-faceted angular blocks formed by 4 or more joint sets Fabian 1005/1330 Red-Grey Leptite with Skarn, and Granite inclusions 20-05-11 2m 55 FAIR: BLOCKY-well interlocked un- disturbed rock mass
39 consistion of cubical blocks formed by three intersecting discontinuity sets Fabian 1005/1430 Red-Grey Leptite with Granite inclusions 20-05-07 2m 45 FAIR: VERY BLOCKY-interlocked, partially disturbed mass with multi-faceted angular blocks formed by 4 or more joint sets
Kapten 930/5940 Red-Grey Leptite with Skarn, and Granite inclusions 20-05-09 2m 50 GOOD: VERY BLOCKY-interlocked, partially disturbed mass with multi-faceted angular blocks formed by 4 or more joint sets Printzsköd 1080/3960 A (Red-Grey Leptite with Biotite inclusions 20-01-22 2m 50 FAIR: VERY BLOCKY-interlocked, partially disturbed mass
40
with multi-faceted
angular blocks formed by 4 or more joint sets
B Red-Grey Leptite with Granite inclusions 20-01-28 2m 50 FAIR: VERY BLOCKY-interlocked, partially disturbed mass with multi-faceted angular blocks formed by 4 or more joint sets
C Red-Grey Leptite with Granite inclusions 20-02-03 2m 50 FAIR: VERY BLOCKY-interlocked, partially disturbed mass with multi-faceted angular blocks formed by 4 or more joint sets
D Red-Grey Leptite with Granite inclusions 20-02-11 2m 50 FAIR: VERY BLOCKY-interlocked, partially disturbed mass with multi-faceted angular blocks
41
formed by 4 or more joint sets Printzsköd 1080m /4000 A Red-Grey Leptite with Biotite inclusions 19-11-13 4m 45 FAIR: VERY BLOCKY-interlocked, partially disturbed mass with multi-faceted angular blocks formed by 4 or more joint sets
B Red-Grey Leptite with Biotite inclusions 19-11-19 4m 45 FAIR: VERY BLOCKY-interlocked, partially disturbed mass with multi-faceted angular blocks formed by 4 or more joint sets
C Red-Grey Leptite with Granite inclusions 19-11-26 4m 45 FAIR: VERY BLOCKY-interlocked, partially disturbed mass with multi-faceted angular blocks formed by 4 or more joint sets
42 D Red-Grey Leptite with Granite inclusions 19-12-03 4m 45 FAIR: VERY BLOCKY-interlocked, partially disturbed mass with multi-faceted angular blocks formed by 4 or more joint sets
E Red-Grey Leptite with Granite inclusions 19-12-09 4m 45 FAIR: VERY BLOCKY-interlocked, partially disturbed mass with multi-faceted angular blocks formed by 4 or more joint sets Fabian 1005m 1350 Magnetite 20-05-11 2m 45 FAIR: VERY BLOCKY-interlocked, partially disturbed mass with multi-faceted angular blocks formed by 4 or more joint sets
43 1490 Magnetite 20-05-11 2m 60 GOOD: BLOCKY-well interlocked un- disturbed rock mass consistion of cubical blocks formed by three intersecting discontinuity sets
To calculate the percentage of the overbreak on the roof, sidewall 1, and sidewall 2, three types of measurement were considered. These include:
• Overbreak (areas are newly developed and do not contain any kind of support), • Entry size after shotcrete (newly developed areas and supported with shotcrete). • Entry size after shotcrete, older than three months.
From Figure 4.16 the first part of the crosscut with green color is the part with shotcrete and the other part with blue color is without shotcrete.
44
4.6 Deformation Calculation Method
4.6.1 uGPS Convergence Monitoring
The study areas were scanned every 15 days for a period of four months, and the first scan was selected as a reference to compare the rest of the scans that were carried out later. The primary purpose of carrying out the underground deformation study was to investigate the capacity of the uGPS Rapid Mapper to recognize real changes that occur over time. These changes have multiple causes that can include stress increases, time-dependent deformation, or seismic events. Determination of the reason for the changes in deformation were not within the scope of this study. The areas in which the study was carried out were:
• Hoppet level 1051 crosscut numbers 2550 and 2570. • Hoppet level 1080 crosscut numbers 2740 and 2760. • Printzsköld level 1023 crosscut number 4080. • Printzsköld level 1051 crosscut number 4070.
These were believed to be most vulnerable to deformation. The data of these scans were used to create a convergence monitoring model for each area by using the uGPS Rapid Mapper scan file converter software. See Fig. 4.17.
Figure 4.17 uGPS Rapid Mapper scan file converter software (Run Convergence Monitoring).
Then the CloudCompare was used to analyze the convergence monitoring models and monitor the changes that occurred during each stage of the scan.
45
The main objective of this analysis was to study the uGPS’s ability to recognize deformations taking place underground and how realistic these deformations can be. As well as studying the effect of the offset in each scan operation on the results of deformations.
4.6.2 Deswik.CAD Underground Convergence Measurement
The Underground Convergence Measurement tool is a new feature developed for Deswik.CAD software to monitor the changes over time to determine the amount of convergence that is taking place underground (tunnel development). This analysis method is included here as a comparison to the standard uGPS convergence monitoring tool.
Initially, a number of stations were added along the centerline of both solids (An unlimited number of stations can be added within the Deswik software). Each station serves as a locator for later cross-sectional analysis of convergence. The distance between the stations was a maximum of 5 m or less. See Figure 4.18.a. The red solid represents the oldest scan (the reference), while the green solid represents the newest scan for the same area. See Figure 3.17.b.
Figure 4.18 (a) Centreline with the stations. (b) Oldest and newest scan solids.
The drive dimensions of the solids were measured to create a suitable station template. The station template is a set of polylines placed relative to a fixed point in an underground opening in order to measure the distance between solid intersections, see Figure 4.19. Convergence is measured along the length of each polyline, based on where that line crosses the crossection of the opening.
46
Figure 4.19 (a) Drive dimensions of the solids. (b) station template.
During the data processing, an offset between the two scan solids was observed. This offset was corrected before processing the data, to avoid any unreal deformation, see Figure 4.20.
Figure 4.20 Offset between two scan solids.
The offset between two solids was corrected by selecting one of two solids and then using the tool "translate" on Deswik, then the selected solid was moved with very small distances along the axes X, Y and Z, (transport was done on each axis separately) until the two solids become matched somewhat, and the deformations between them become clarified. Most of the correction in offset was on the axis on which the vehicle was travelling through during the scanning process. As it was observed that the largest amount of offset occurred on this axis, see Figure 4.21 and 4.22. After that, the measurement tool was set up and the first solid was measured, see Figure 4.23.
47
Figure 4.21 Translate tool on Deswik.CAD.
48
Figure 4.23 Measure First solid.
The final step, measures the second solid (no need to re-insert blocks), see Figure 4.24.
49
CHAPTER 5
Results and Discussion5.1 Accuracy and Repeatability Results
5.1.1 Target Location Repeatability- Target Tests
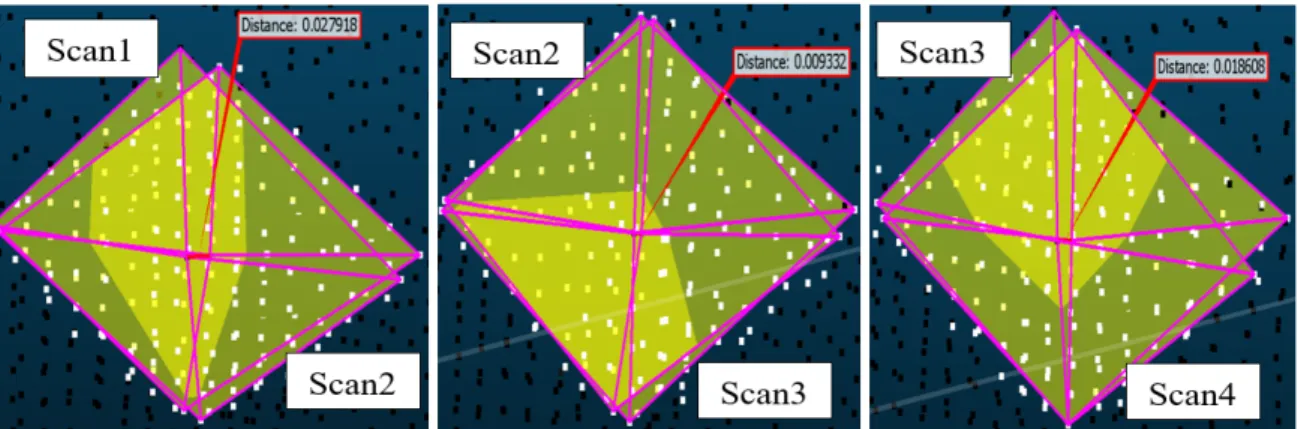
Figure 5.1 shows the distance difference between the coordinates given by the SFC for the same target which was scanned four different times. The target was not surveyed (target was not given locational attributes in the control point CP file). After processing and georeferencing each scan pair (Scan 1&2, 2&3 and 3&4) it was possible to put them into the same space using CloudCompare and then measure the apparent distance between the two target scans. Perfect repeatability would have located the two targets at the same exact spot.
The same procedures were done for three other targets (targets were not given locational attributes in the control point CP file).
Figure 5.1 The distance difference in location between two scans of the same target. (without control point on CP file).
Figure 5.2 shows the distance difference between the coordinates given by the SFC for the same target, which was scanned four different times, where the target is a surveyed target (target was given locational attributes in the control point CP file). After processing and georeferencing every two scans (1-2, 2-3 and 3-4) it was possible to put them into the same space using CloudCompare and then measure the apparent distance between the two target scans.
These procedures were carried out for first and last targets that are located in the entry (targets were given locational attributes in the control point CP file).
50
Figure 5.2 The distance difference in location between two scans of the same target. (with control point on CP file).
Figure 5.3 further presents the estimated standard deviation for the four scans at x, y, z and overall repeatability (x, y and z) at each target of the targets in Hoppet region on level 1051m, crosscut number 2590.
Figure 5.3 The estimated standard deviation of four scans along the x, y, z axes and overall repeatability for each target.
Figure 5.4 presents the average of the values for four scans at x, y and z axes at each target. 0 0,05 0,1 0,15 0,2 0,25 0,3 T91 T1 T2 T3 T4 T92 Re pe at ab ili ty (m ) Targets numbers
3D Standard Deviation of Target Location
51
Figure 5.4 The average values of four scans along the x, y and z axes for each target. Through the results shown in the standard deviation and average values of four scans, the biggest difference in the algorithm repeatability of the same target is on the X-axis, then the Y-axis, and less on the z-axis. As the X-axis is the axis that gets the most travel through it during the scanning process, and therefore it is the axis that is most vulnerable to changes due to speed and location.
The targets that do not have control point CP file (T1, T2, T3 and T4), obtained a large part of the difference in the algorithms during the process of repeating the scan four times compared to the targets that have control point CP file (T91 and T92).
5.1.2 Convergence Accuracy Due to Target Spacing - Target Tests
Fig. 5.5 presents the displacement results between the initial or original reference model and model 1 where target T62 was turned off on the x, y and z axes.
-0,050 -0,040 -0,030 -0,020 -0,010 0,000 0,010 0,020 T91 T1 T2 T3 T4 T92 Re pe at ab ili ty (m ) Targets numbers
Average Values of Target Location