ADVANCED CHARACTERIZATION TECHNIQUES IN UNDERSTANDING THE ROLES OF NICKEL IN ENHANCING STRENGTH AND TOUGHNESS OF
SUBMERGED ARC WELDING HIGH STRENGTH LOW ALLOY STEEL MULTIPLE PASS WELDS IN THE AS-WELDED CONDITION
by Kin-Ling Sham
c
Copyright by Kin-Ling Sham, 2014 All Rights Reserved
A thesis submitted to the Faculty and the Board of Trustees of the Colorado School of Mines in partial fulfillment of the requirements for the degree of Doctor of Philosophy (Metallurgical and Materials Engineering).
Golden, Colorado Date Signed: Kin-Ling Sham Signed: Dr. Stephen Liu Thesis Advisor Golden, Colorado Date Signed: Dr. Michael Kaufman Professor and Head Department of Metallurgical and Materials Engineering
ABSTRACT
Striving for higher strength along with higher toughness is a constant goal in mate-rial properties. Even though nickel is known as an effective alloying element in improving the resistance of a steel to impact fracture, it is not fully understood how nickel enhances toughness. It was the goal of this work to assist and further the understanding of how nickel enhanced toughness and maintained strength in particular for high strength low al-loy (HSLA) steel submerged arc welding multiple pass welds in the as-welded condition. Using advanced analytical techniques such as electron backscatter diffraction, x-ray diffrac-tion, electron microprobe, differential scanning calorimetry, and thermodynamic modeling software, the effect of nickel was studied with nickel varying from one to five wt. pct. in increments of one wt. pct. in a specific HSLA steel submerged arc welding multiple pass weldment. The test matrix of five different nickel compositions in the as-welded and stress-relieved condition was to meet the targeted mechanical properties with a yield strength ≥85 ksi, a ultimate tensile strength ≥105 ksi, and a nil ductility temperature ≤-140oF.
Mechan-ical testing demonstrated that nickel content of three wt. pct and greater in the as-welded condition fulfilled the targeted mechanical properties. Therefore, one, three, and five wt. pct. nickel in the as-welded condition was further studied to determine the effect of nickel on pri-mary solidification mode, nickel solute segregation, dendrite thickness, phase transformation temperatures, effective ferrite grain size, dislocation density and strain, grain misorientation distribution, and precipitates. From one to five wt. pct nickel content in the as-welded condition, the primary solidification was shown to change from primary δ-ferrite to primary austenite. The nickel partitioning coefficient increased and dendrite/cellular thickness was refined. Austenite decomposition temperatures into different ferrite products were also sup-pressed to refine the effective ferrite grain size with increasing nickel. Finally, dislocation density and strain increased and a more preferred orientation behavior was observed. At five
wt. pct nickel, a precipitate in the form of MnNi3 or FeNi3 was observed. Its presence in
both inter and intragranular regions enhanced strength and toughness by limiting the ferrite grain size and precipitation strengthening.
TABLE OF CONTENTS
ABSTRACT . . . iii
LIST OF FIGURES . . . viii
LIST OF TABLES . . . xvii
ACKNOWLEDGMENTS . . . xix
DEDICATION . . . xx
CHAPTER 1 INTRODUCTION . . . 1
1.1 Research Objectives . . . 2
CHAPTER 2 LITERATURE REVIEW . . . 4
2.1 Submerged Arc Welding Fluxes and Basic Concepts Related to Welding Fluxes . 4 2.2 High Strength Low Alloy Multiple Pass Welds . . . 7
2.2.1 Macro-Alloying Additions . . . 7
2.2.2 Second Phase Particles in Weld Metal . . . 8
2.3 Fundamental Metallurgical Principles . . . 10
2.3.1 Basic Solidification Concepts . . . 10
2.4 Austenite Decomposition in Steel Weld Metals . . . 13
2.4.1 Ferrite Morphologies . . . 14
2.4.2 Bainite . . . 18
2.4.3 Martensite . . . 20
2.5 Effect of Nickel . . . 21
3.1 Preliminary Research Experimental Procedures . . . 26
3.1.1 Welding and Sample Preparation . . . 26
3.1.2 Chemical Compositions for Filler Metal Wires, Base Metal (Comp F), and Weld Metal . . . 27
3.1.3 Metallographic Procedures for Macrophotographs . . . 27
3.1.4 Metallographic Procedures for Microphotographs . . . 31
3.1.5 Identification and Development of Microstructural Key – Light Optical Microscopy . . . 31
3.1.6 Procedure for Quantitative Microstructural Analysis – Light Optical Microscopy . . . 32
3.1.7 Law of Mixture for Estimating Weld Zones . . . 34
3.2 As Received Material Compositions for Fabricating Test Matrix . . . 35
3.3 Testing Matrix and Nickel Additions . . . 35
3.4 Metallographic Examination and EBSD . . . 39
3.5 Mechanical Testing . . . 40
3.6 Electron Probe Micro-Analyzer (EPMA) . . . 41
3.7 Computational Software Simulation . . . 42
3.8 Differential Scanning Calorimetry . . . 44
3.9 X-Ray Diffraction . . . 45
CHAPTER 4 RESULTS AND DISCUSSION . . . 48
4.1 Initial Research . . . 48
4.1.1 Macrophotographs and Law of Mixture . . . 49
4.1.2 Microstructural Key . . . 51
4.1.4 Correlation Between Weld Composition and Microstructure . . . 61
4.2 Strategy for Analysis for HSLA Steel Multiple Pass Weld Mockups . . . 74
4.2.1 Mechanical Properties: Vickers Microhardness, Charpy V-Notch Testing, and Tensile Testing . . . 75
4.3 Electron Probe Micro-Analyzer . . . 91
4.4 Differential Scanning Calorimetry . . . 96
4.5 Simulated Continuous Cooling Transformation Curves . . . 105
4.6 X-Ray Diffraction (XRD) . . . 110
4.7 Electron Backscatter Diffraction (EBSD) . . . 116
4.8 Descriptive Model . . . 125
CHAPTER 5 CONCLUSIONS . . . 133
CHAPTER 6 FUTURE WORK . . . 136
REFERENCES CITED . . . 138
APPENDIX A - ADDITIONAL CHARPY V-NOTCH RELATED GRAPHS AND IMAGES . . . 144
APPENDIX B - ADDITIONAL STRESS-STRAIN GRAPHS . . . 153
APPENDIX C - ADDITIONAL INSTANTANEOUS STRAIN HARDENING GRAPHS . . . 157
APPENDIX D - TIME-TEMPERATURE TRANSFORMATION DIAGRAMS . . . . 164
APPENDIX E - DIFFERENTIAL SCANNING CALORIMETRY GRAPHS . . . 167
APPENDIX F - DIFFERENTIAL SCANNING CALORIMETRY DECONVOLUTION PYTHON CODE . . . 170
LIST OF FIGURES
Figure 2.1 Solid solutions strengthening of ferrite . . . 9 Figure 2.2 Effect of temperature gradient, G, and growth rate, R, on the dendrite
morphology and size of solidification microstructures . . . 12 Figure 2.3 Epitaxial and competitive growth in the bulk weld metal fusion zone . . 12 Figure 2.4 Nucleation mechanisms during welding: (a) top view; (b) side view . . . 13 Figure 2.5 Schematic diagram of grain boundary ferrite and Widmanst¨atten
ferrite . Reprinted from Krauss, 2005. . . 15 Figure 2.6 Continuous-cooling transformation diagram for HSLA 80 plate steel .
Reprinted from Krauss, 2005. . . 16 Figure 2.7 Acicular ferrite in low-carbon weld metal. Nital etch, light micrograph
at 500x. Courtesy of S. Liu, Colorado School of Mines. Reprinted from Krauss, 2005. . . 16 Figure 2.8 Schematic diagram of intragranular acicular ferrite (IAF), polygonal or
primary ferrite (PF), bainitic ferrite (BF) or Widmanst¨atten ferrite (WF), and inclusions as nucleation sites in weld metal . Reprinted
from Krauss, 2005. . . 17 Figure 2.9 Schematic drawings of the six morphologies of bainite according to
Aaronson et al.: (a) nodular bainite, (b) columnar bainite, (c) upper bainite, (d) lower bainite, (e) grain boundary allotriomorphic bainite,
and (f) inverse bainite . Reprinted from Krauss, 2005. . . 19 Figure 3.1 Halved, angled aerial view of the submerged arc multiple pass weld
mockup with ESAB flux (˜18 cm [˜7 inches] in width and length ˜10
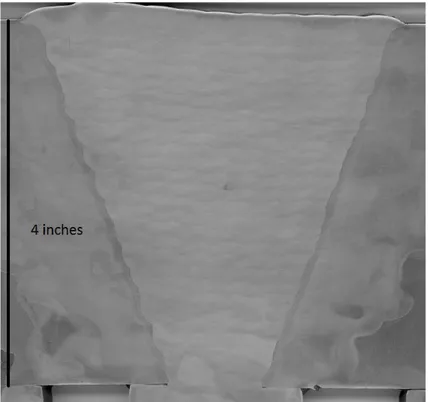
cm [˜4 inches] in length). . . 29 Figure 3.2 Cross sectioned view of the submerged arc multiple pass weld mockup
Figure 3.3 Schematic representations of microstructural constituents: a)
Imaginary boundary joining ends of second phases (indicated by dotted line); bi) Ferrite under crosswire ≤ 3x average lath width; bii) Ferrite under crosswire ≥ 3x average lath width; ci) Two or more parallel laths and aspect ratio ≥ 10:1; cii) Two parallel laths with aspect ratio ≤10:1 or non-aligned laths or isolated high aspect ratio laths; di) Area of FC colony under crosswire less than individual ferrite lath area; dii) Area of FC colony under crosswire greater than individual ferrite lath area;
Note: aspect ratio = major axis: minor axis . . . 33
Figure 3.4 Macrophotograph of the submerged arc multiple pass weld mockup with ESAB flux stress-relieved. . . 34
Figure 3.5 Enlarged area of macrophotograph where lighter regions are as-solidified weld metal and the darker outlining of the each individual welds are the reheated as-solidified weld metal. . . 35
Figure 3.6 Second Wire Feeder . . . 36
Figure 3.7 EPMA calibration curve 1. . . 42
Figure 3.8 EPMA calibration curve 2. . . 43
Figure 4.1 Macro-photograph of the submerged arc welding mockup using ESAB flux after etching using nital. . . 49
Figure 4.2 Macro-photograph of the gas-tungsten arc welding mockup after etching using nital. . . 50
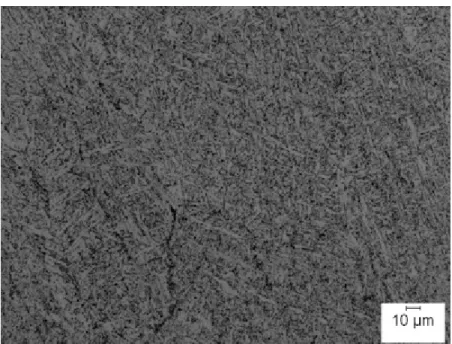
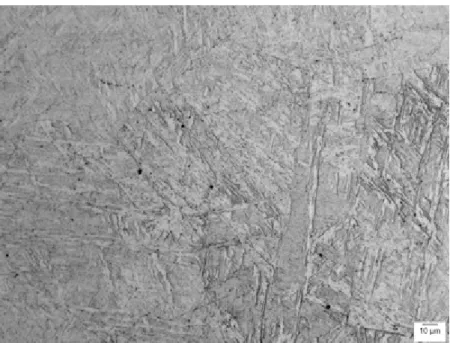
Figure 4.3 MIL-105S gas-tungsten arc weld cap micrograph with a key shown in Table 4.2 that identifies all the major constituents present. Acicular ferrite is virtually absent in this micrograph. . . 52
Figure 4.4 MIL-105S submerged arc as-solidified weld with Oerlikon flux displaying acicular ferrite as a major constituent. The percent acicular ferrite in this micrograph easily exceeds 90 pct. . . 53
Figure 4.5 Example of ferrite carbide aggregates and equiaxed ferrite from the MIL-105S gas-tungsten arc weld at 500X. . . 54
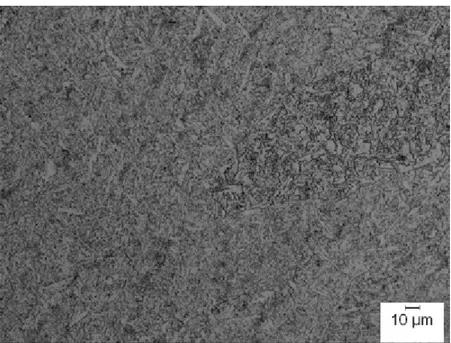
Figure 4.6 LOM micrograph of the as-solidified weld metal of a submerged arc weld mockup using ESAB flux in as-welded condition. . . 56
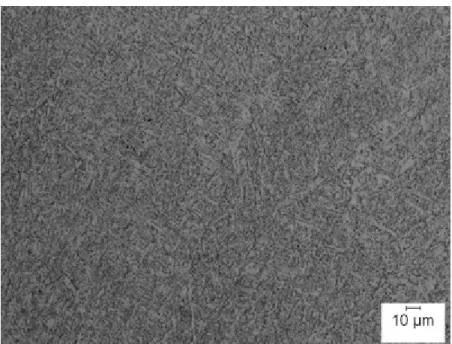
Figure 4.7 LOM micrograph of the reheated weld metal of a submerged arc weld mockup using ESAB flux in stress-relieved condition. . . 57
Figure 4.8 LOM micrograph of the as-solidified weld metal of a submerged arc
weld using Oerlikon flux in as-welded condition. . . 57 Figure 4.9 LOM micrograph of the as-solidified weld metal of a submerged arc
weld mockup using Oerlikon flux in stress-relieved condition. . . 58 Figure 4.10 LOM micrograph of the as-solidified weld metal of a W11/W12 weld in
as-welded condition. . . 58 Figure 4.11 LOM micrograph of the reheated weld metal of a W11/W12 weld in
stress-relieved condition. . . 59 Figure 4.12 LOM micrograph of the as-solidified weld metal of a W13/W14 weld in
as-welded condition. . . 59 Figure 4.13 LOM micrograph of the as-solidified weld metal of a W13/W14 weld in
stress-relieved condition. . . 60 Figure 4.14 LOM micrograph of the as-solidified weld metal of a gas-tungsten arc
weld mockup in as-welded condition. . . 60 Figure 4.15 Acicular ferrite as a function of manganese content. . . 62 Figure 4.16 Lath martensite as a function of manganese content. . . 63 Figure 4.17 Effect of nickel on as-deposited microstructure of C-Mn steel welds
with a) 1wt. pct. manganese; b) 1.8 wt. pct. manganese . . . 64 Figure 4.18 Articular ferrite as a function of nickel and manganese steel weld
composition. . . 65 Figure 4.19 Ferrite with second phase aligned (FS(A)) as a function of nickel and
manganese steel weld composition. . . 66 Figure 4.20 Ferrite with second phase non-aligned (FS(NA)) as a function of nickel
and manganese steel weld composition. . . 67 Figure 4.21 Effect of nickel and manganese on strength of welds, as-deposited and
after stress relief at 580oC: a) Yield strength; b) Tensile strength . . . . 68
Figure 4.22 Effect of nickel on 100J Charpy transition temperature of weld metal of varying manganese level: a) As-welded; b) Stress relieved at 580oC . . . . 69
Figure 4.24 Effect of molybdenum on as-deposited microstructure of welds with
one wt. pct. manganese . . . 71
Figure 4.25 Effect of molybdenum and manganese on strength of welds as-welded and after stress relief at 580oC: a) Yield strength; b) Tensile strength . . 72
Figure 4.26 Effect of molybdenum on 100J Charpy transition temperature of weld metals of varying manganese level: a) As-welded; b) Stress-relieved at 580oC ). . . 73
Figure 4.27 NDT35f t−lbs as a function of molybdenum weld composition. . . 73
Figure 4.28 Weld mockup of five wt. pct. nickel. . . 75
Figure 4.29 Illustration of locations where hardness data were acquired. . . 76
Figure 4.30 Vickers microhardness profiles. . . 77
Figure 4.31 Average vicker hardness number as a function of nickel content (wt. pct.) . . . 78
Figure 4.32 Charpy v-notch curve for one wt. pct. nickel as-welded (left) and stress-relieved (right). . . 79
Figure 4.33 Charpy v-notch curve for three wt. pct. nickel as-welded (left) and stress-relieved (right). . . 79
Figure 4.34 Charpy v-notch curve for five wt. pct. nickel as-welded (left) and stress-relieved (right). . . 80
Figure 4.35 Determined transition temperatures in the as-welded condition. . . 82
Figure 4.36 Transition temperature curves for one through five wt. pct. in as-welded condition. . . 83
Figure 4.37 Stress-strain curves of one wt. pct. nickel in as-welded condition. . . 84
Figure 4.38 Stress-strain curves of three wt. pct. nickel in as-welded condition. . . . 85
Figure 4.39 Stress-strain curves of five wt. pct. nickel in as-welded condition. . . 86
Figure 4.40 Average YS and UTS values for one through five wt. pct. nickel. . . 87
Figure 4.42 Instantaneous strain hardening for one through five wt. pct. nickel in the as-welded condition Set 1 (left) and respective true stress-strain
curves (right). . . 90 Figure 4.43 EPMA line scans for 1 wt. pct. (left) and 2 wt. pct. (right) nickel in
the as-welded condition in as-solidified weld metal. . . 93 Figure 4.44 EPMA line scan four wt. pct. nickel in the as-welded condition in
as-solidified weld metal. . . 93 Figure 4.45 EPMA line scan for five wt. pct. nickel in as-welded condition in
as-solidified weld metal. . . 94 Figure 4.46 Cell/Dendrite Substructure in LOM for five wt. pct. nickel at 200X. . . . 95 Figure 4.47 DSC for one and five wt. pct. nickel using Netzsch equipment. . . 97 Figure 4.48 DSC one and five wt. pct. nickel for high temperature events using
Netzsch equipment. . . 98 Figure 4.49 DSC one and five wt. pct. nickel for high temperature events using
Setaram equipment. . . 99 Figure 4.50 DSC one, three, and five wt. pct. nickel for last curve upon cooling
using Netzsch equipment. . . 102 Figure 4.51 DSC one, three, and five wt. pct. nickel for last curve upon cooling
using Setaram equipment. . . 103 Figure 4.52 Energy percentage of high and low temperature ferrite transformations.
. . . 104 Figure 4.53 LOM image of cellular dendritic structure of five wt. pct. nickel in the
as-solidified weld metal in the as-welded condition. . . 104 Figure 4.54 Ferrite temperature range for high and low ferrite transformation. . . 105 Figure 4.55 Continuous cooling transformation curves for one wt. pct. nickel in
as-welded condition with VHNs. . . 107 Figure 4.56 Continuous cooling transformation curves for three wt. pct. nickel in
as-welded condition with VHNs. . . 108 Figure 4.57 Continuous cooling transformation curves for five wt. pct. nickel in
Figure 4.58 XRD profiles for one wt. pct. nickel. . . 111
Figure 4.59 XRD profiles for three wt. pct. nickel. . . 111
Figure 4.60 XRD profiles for five wt. pct. nickel. . . 112
Figure 4.61 Williamson Hall plot for one wt. pct. nickel. . . 113
Figure 4.62 Modified Williamson Hall plot for one wt. pct. nickel. . . 113
Figure 4.63 Dislocation density of bainite as a function of the transformation start temperature. . . 115
Figure 4.64 Example of orientation image map for one wt. pct. nickel in the as-solidified region. . . 116
Figure 4.65 Example of orientation image map for three wt. pct. nickel in the as-solidified region. . . 117
Figure 4.66 Example of orientation image map for five wt. pct. nickel in the as-solidified region. . . 117
Figure 4.67 Examples of KAM map for one wt. pct. nickel in the as-solidified region. . . 118
Figure 4.68 Example of KAM map for three wt. pct. nickel in the as-solidified region. . . 119
Figure 4.69 Example of KAM map for five wt. pct. nickel in the as-solidified region. . . 120
Figure 4.70 Effect of nickel in wt. pct. in as-solidified region on effective ferrite grain size. . . 121
Figure 4.71 Example of KAM map with high angle grain boundaries (red) and coincidence site lattice (green) for one wt. pct. nickel in the as-solidified region. . . 122
Figure 4.72 Example of KAM map with high angle grain boundaries (red) and coincidence site lattice (green) for three wt. pct. nickel in the as-solidified region. . . 123
Figure 4.73 Example of KAM map with high angle grain boundaries (red) and coincidence site lattice (green) for five wt. pct. nickel in the as-solidified region. . . 124
Figure 4.74 Effect of nickel in wt. pct. in the as-solidified region on HABGs. . . . 125 Figure 4.75 Bar graph for misorientation distribution for one pct. nickel in
as-solidified region from Figure 4.64. . . 126 Figure 4.76 Bar graph for misorientation distribution for three pct. nickel in
as-solidified region from Figure 4.65. . . 127 Figure 4.77 Bar graph for misorientation distribution for five pct. nickel in
as-solidified region from Figure 4.66. . . 128 Figure 4.78 EBSD orientation maps and distribution of the misorientation angles of
ferritic grains in (a) granular bainite, (b) upper bainite, and (c) lower
lath-bainite . . . 129 Figure 4.79 Misorientation distribution for lower bainite, upper bainite, and
granular bainite . . . 129 Figure 4.80 SEM images for one (left) and five (right) wt. pct nickel in the
as-solidified region. . . 130 Figure 4.81 Descriptive model for low and high nickel content. . . 132 Figure A.1 Charpy v-notch curve for two wt. pct. nickel as-welded (left) and
stress-relieved (right). . . 144 Figure A.2 Charpy v-notch curve for four wt. pct. nickel as-welded (left) and
stress-relieved (right). . . 145 Figure A.3 Charpy v-notch specimens for one wt. pct. nickel as-welded (left) and
stress-relieved (right). . . 145 Figure A.4 Charpy v-notch specimens two wt. pct. nickel as-welded (left) and
stress-relieved (right). . . 146 Figure A.5 Charpy v-notch specimens three wt. pct. nickel as-welded (left) and
stress-relieved (right). . . 146 Figure A.6 Charpy v-notch specimens four wt. pct. nickel as-welded (left) and
stress-relieved (right). . . 146 Figure A.7 Charpy v-notch specimens five wt. pct. nickel as-welded (left) and
Figure A.8 Transition temperature curves for one through five wt. pct. nickel in
stress-relieved condition. . . 147 Figure A.9 Determined transition temperatures in stress-relieved condition. . . 148 Figure A.10 Ratio of stress-relieved over as-welded condition of NDT35f t−lbs, T4, as
a function of nickel content in wt. pct. . . 149 Figure A.11 Ratio of stress-relieved over as-welded condition of NDT, T5, as a
function of nickel content in wt. pct. . . 150 Figure A.12 Lateral expansion for one through five wt. pct. nickel in the as-welded
condition. . . 151 Figure A.13 Lateral expansion for one through five wt. pct. in the stress-relieved
condition. . . 152 Figure B.1 Stress-strain curves of one wt. pct. nickel in stress-relieved condition. 153 Figure B.2 Stress-strain curves of three wt. pct. nickel in stress-relieved condition.
. . . 154 Figure B.3 Stress-strain curves of five wt. pct. nickel in stress-relieved condition. 155 Figure B.4 Stress-strain curves for two wt. pct. nickel in both as-welded (left) and
stress-relieved (right) condition. . . 155 Figure B.5 Stress-strain curves for four wt. pct. nickel in both as-welded (left) and
stress-relieved (rig) condition. . . 156 Figure C.1 Instantaneous strain hardening for one through five wt. pct. nickel in
the as-welded condition Set 2. . . 157 Figure C.2 Instantaneous strain hardening for one through five wt. pct. nickel in
the as-welded condition Set 3. . . 158 Figure C.3 Instantaneous strain hardening for one through five wt. pct. nickel in
the as-welded condition Set 4. . . 159 Figure C.4 Instantaneous strain hardening for one through five wt. pct. nickel in
the stress-relieved condition Set 1 (left) and respective engineering
stress-strain curves (right). . . 159 Figure C.5 Instantaneous strain hardening for one through five wt. pct. nickel in
Figure C.6 Instantaneous strain hardening for one through five wt. pct. nickel in
the stress-relieved condition Set 3. . . 161 Figure C.7 Instantaneous strain hardening for one through five wt. pct. nickel in
the stress-relieved condition Set 4. . . 162 Figure C.8 Average values for instantaneous strain hardening in stress-relieved
condition versus nickel content. . . 163 Figure D.1 Time-temperature transformation curves for one wt. pct. nickel in
as-welded condition. . . 164 Figure D.2 Time-temperature transformation curves for three wt. pct. nickel in
as-welded condition. . . 165 Figure D.3 Time-temperature transformation curves for five wt. pct. nickel in
as-welded condition. . . 166 Figure E.1 Differential scanning calorimetry one wt. pct nickel in as-welded
condition using Netzsch (left) and Setaram (right). . . 167 Figure E.2 Differential scanning calorimetry three wt. pct nickel in as-welded
condition using Netzsch (left) and Setaram (right). . . 168 Figure E.3 Differential scanning calorimetry five wt. pct nickel in as-welded
condition using Netzsch (left) and Setaram (right). . . 168 Figure E.4 Differential scanning calorimetry one, three, and five wt. pct nickel in
as-welded condition using Netzsch (left) and Setaram (right) for 1st
curve upon heating. . . 169 *Figures with A, B, C, D, and E denotes figures from the Appendices.
LIST OF TABLES
Table 1.1 Target mechanical properties . . . 3
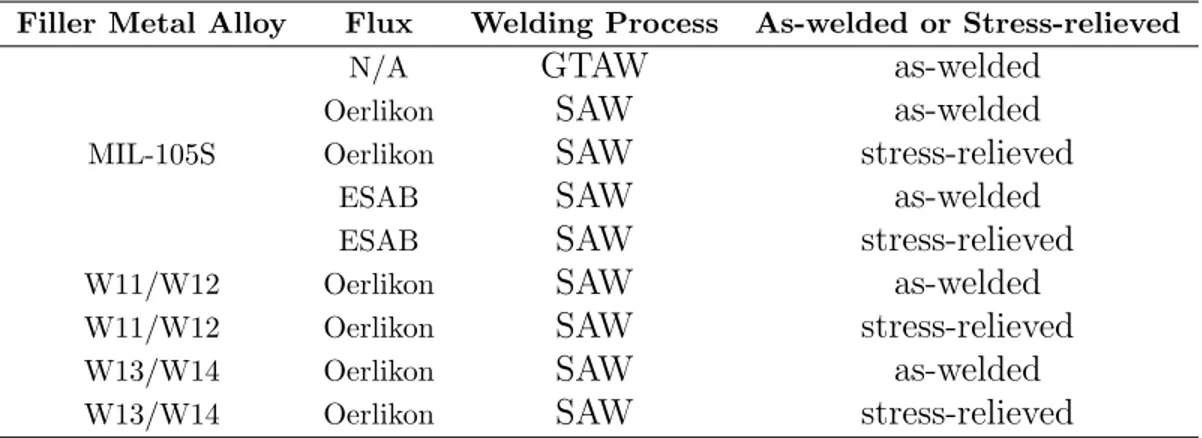
Table 3.1 Alloys/welds studied during the first year of this research program. . . 27
Table 3.2 Welding parameters for the nine alloys/welds studied during first year of this research program. . . 28
Table 3.3 Gas-tungsten arc welding using MIL-105S filler metal wire in the as-welded condition . . . 28
Table 3.4 Submerged arc welding using MIL-105S filler metal wire and Oerlikon flux in the as-welded/stress-relieved conditions . . . 28
Table 3.5 Submerged arc welding using MIL-105S filler metal wire and ESAB flux in the as-welded/stress-relieved conditions . . . 29
Table 3.6 Submerged arc welding using W11/W12 filler metal wire and Oerlikon flux in the as-welded/stress relieved conditions . . . 29
Table 3.7 Submerged arc welding using W13/W14 filler metal wire and Oerlikon flux in the as-welded/stress-relieved conditions . . . 30
Table 3.8 Flux composition of Oerlikon OP121TT (in wt. pct.) . . . 30
Table 3.9 Flux composition of ESAB OK 10.62 (in wt. pct.) . . . 30
Table 3.10 Submerged arc welding parameters . . . 36
Table 3.11 Average values per weld in submerged arc welding multipass fabrication . 38 Table 3.12 MIL-105S multipass weld metal composition without nickel additions (in wt. pct.) . . . 38
Table 3.13 Second wire feeder settings and compositions (in wt. pct) . . . 38
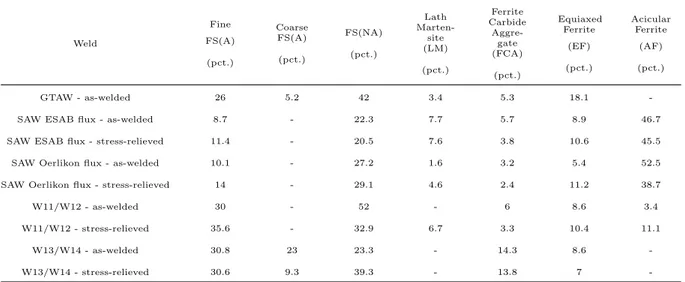
Table 4.1 The percentages of as-solidified weld metal and reheated weld metal used for the application of the law of mixture in microstructural quantification. . . 51
Table 4.2 Microstructural key for Figure 4.3. . . 53 Table 4.3 Summary of the quantitative microstructural analysis in percentage. . . . 56 Table 4.4 Vickers hardness numbers (VHN). . . 77 Table 4.5 Five transition temperatures for one, three, and five wt. pct. nickel in
as-welded (AW) and stress-relieved (SR) condition. . . 81 Table 4.6 Percentage reduction of area for one through five wt. pct. nickel in both
as-welded and stress-relieved conditions. . . 88 Table 4.7 Average values for instantaneous strain hardening in as-welded
condition. . . 90 Table 4.8 Measured cellular dendritic spacing from EPMA data. . . 92 Table 4.9 Python deconvolution for one, three, and five wt. pct. nickel in
as-welded condition using the Setaram equipment. . . 102 Table 4.10 Transformation temperatures from JMatPro simulations. . . 108 Table 4.11 Average strain using the modified WH plot. . . 114
ACKNOWLEDGMENTS
I would like to thank Dr. Stephen Liu along with my committee members Dr. David Olson, Dr. Bajendra Mishra, Dr. Kip Findley, and Dr. John Steele for advising and supporting me through the PhD process. I would also like to thank Dr. George Young for his help and input throughout the process. I would also like to acknowledge my sponsor Knolls Atomic Power Laboratory - Bechtel Marine Propulsion Corporation for their financial support. I would like to express great gratitude to Joe Scott for providing raw materials and equipment for this research. I would also like to thank my friends, CWJCR peers, and fellow peers within the department of Metallurgical and Material Engineering at the Colorado School of Mines for all their support and help throughout this process. Finally, I would like to express my deepest gratitude to my parents for supporting me through this endeavor.
This thesis is dedicated to the people of the world that lack the opportunities and resources to pursue an education. It was a privilege to receive a great education from the Colorado
CHAPTER 1 INTRODUCTION
Improvement in high strength low alloy (HSLA) steel weld metal mechanical properties could be achieved by controlling the type and amount of constituents within the microstruc-ture of the weld metal. The microstrucmicrostruc-ture of weld metal could be affected by weld metal composition, weld metal solidification and cooling rate, prior austenite grain size, and post weld heat treatment. The main factors that affect weld metal composition would be dilu-tion of the weld wire, base metal composidilu-tion, transfer of elements between the slag-metal interface, and minor contamination from the environment. Many aspects could be altered to achieve desired mechanical properties. Previous research has improved mechanical prop-erties of low carbon structural steel welds via microstructural control by promoting acicular ferrite (AF) and minimizing Widmanst¨atten side plate ferrite (WF) and bainite.
Since the 1960s, gas tungsten arc welding of HSLA steels has been performed to produce welds with both good strength and toughness. With the growing demand for high strength steel welding in various applications, shielded metal arc welding (SMAW), fluxed cored arc welding (FCAW), and submerged arc welding (SAW) have been used to process flexibility and productivity. The demand for welds with higher strength (yield strength ≥85 ksi (586 MPa) and ultimate tensile strength ≥105 ksi (723 MPa) using submerged arc welding has pushed toward more stringent criteria for toughness while maintaining the strength. Submerged arc welding is an advantageous and cost effective process with deposition rates four to ten times greater than SMAW when using high heat inputs with no spatter and minimal skill required to operate.
An HSLA-100 steel system was developed through an improvement program by the U.S. Navy in the 1980s through the early 1990s. Today, the continuation of improving shipbuild-ing materials and joinshipbuild-ing techniques to obtain enhanced mechanical properties endures. In
HSLA steels, toughness is achieved by designing alloys with selected combinations of alloy-ing additions, for example, nickel, manganese, chromium, and molybdenum. Other minor additions such as titanium, aluminum, niobium, and vanadium are also used. Elements such as manganese and nickel have typically been added in controlled ratios to achieve the desired strength and impact properties. There are also accepted ratios for titanium and nitrogen re-ported in the literature. The continuous search for a better combination of alloying elements that minimizes cost and maximizes both weld strength and toughness was the driving force of this proposed research. Since there was no clear picture as to the effect of nickel additions between three to five wt. pct., the multiple pass weld metal based on the MIL-105S HSLA steel submerged arc welding was used to investigate the effects of nickel from one to five wt. pct. nickel at increments of one wt. pct.
1.1 Research Objectives
The goal of this research was to gain a fundamental understanding of the effects of nickel as an alloying agent on the strengthening and toughening mechanisms in specific HSLA steel submerged arc welding multiple pass welds. Nickel is known to improve toughness through empirical data with an unclear understanding [5, 17, 22–26, 38, 67]. Literature states one mechanism for nickel improving toughness was that it increases the stacking fault energy and allows for easier cross slip in body-centered cubic iron [3, 8]. This work used a variety of analytical techniques to further study the effects of nickel to improve mechanical properties of current HSLA steel submerged arc welding multiple pass welds. To assist in achieving this goal, an understanding in the relationships of the weld composition, weld microstructure, and mechanical properties was to be developed. The desired outcome of this program is to be able to better match the weld metal to a specifically designed pressure vessel base metal. Target mechanical properties set forth by the research program are as follows: yield strength (YS) ≥ 85 ksi (586 MPa), ultimate tensile strength (UTS) ≥ 105 ksi (724 MPa) and a nil-ductility temperature at 35 ft-lbs (NDT35f t−lbs) ≤ -140oF (-95.6oC). A more complete
understand the effects of nickel on the strengthening and toughening mechanisms in HSLA steel submerged arc welding multiple pass welds. To understand the effects of nickel, this research looked at the following aspects:
• Primary solidification mode • Nickel solute segregation • Dendrite thickness
• Phase transformation temperatures • Effective ferrite grain size
• Dislocation density and strain • Misorientation distribution • Precipitates
For comparison purposes, the mechanical properties of HSLA-100 steel have a YS of 100 to120 ksi (690-827 MPa) with a 17 pct. elongation and a Charpy v-notch toughness of NDT28J (NDT21f t−lbs) at -18oC (0oF). Thus, a YS ≥ 85 ksi achieving a NDT35f t−lbs≤-140oF
(-96oC) would be a difficult task.
Table 1.1: Target mechanical properties
Yield Strength (ksi) Ultimate Tensile Strength (ksi) Pct. Elongation Pct. Reduction of Area NDT35f t−lbs
CHAPTER 2 LITERATURE REVIEW
This section will give some general background information regarding fluxes used in submerged arc welding, some basic concepts related to welding flux studies, the significance of oxygen, nitrogen, sulfur, and phosphorous in submerged arc welding, and the austenite decomposition behavior in steel weld metals. In addition, this Section will also give a brief fundamental review of some basic theories in solidification, thermodynamics, grain boundary energies, and energetic effects in microstructural development in research.
2.1 Submerged Arc Welding Fluxes and Basic Concepts Related to Welding Fluxes
A brief discussion on some fundamental aspects of submerged arc welding fluxes will be presented in this Section. If nickel is increased in the weld composition for mass production, the preferred methodology would be alloying through the submerged arc welding flux. There are three major types of submerged arc welding fluxes depending on the method of produc-tion: fused, bonded, and agglomerated. Fused welding fluxes are first crushed to ensure that all the mineral components are two to four millimeter in particle size. Dry mix is then melted in a furnace and quenched, crushed, sieved, dried, and packaged. Due to the manu-facturing process, fused fluxes typically do not contain ferroalloys and deoxidizers. Bonded welding fluxes are ground to size and dry mixed together. Using a binder (usually potassium or sodium silicate), dry mix is bonded together and pelletized. The wet pellets are often contained and then dried at temperatures between 370oC and 800oC [6]. Flux is then sized
and packaged. The low baking temperatures of bonded fluxes do contain ferroalloys and deoxidizers. Moisture is a problem for bonded and agglomerated fluxes thus a temperature and humidity controlled room should be used for storage of these fluxes.
Major flux ingredients are manganese oxide, silica (silicon dioxide), lime (calcium oxide), magnesium oxide, alumina, and calcium fluoride. The formulation of submerged arc welding fluxes are typically some complex combination in the form of the major flux ingredients listed above and may include various minor flux constituents such as titanium dioxide, barium oxide, iron oxide, potassium oxide, and sodium oxide. The main functions of the welding fluxes are to provide protection for the molten weld pool from the atmosphere, refine the weld pool, stabilize the plasma arc, and add alloying additions to the weld metal.
The basicity index (BI) is used to calculate whether the slag formed in submerged arc welding is basic or acid. Basicity of a flux can be described as the ratio of the total weight percent of the basic components over the total weight percent of the acid components. Silicate fluxes are considered acidic. Alkali and alkali-earth metal oxide fluxes are termed basic. Commonly used oxides in fluxes are listed from acidic to basic as follows: SiO2, P2O5,
Al2O3, TiO2, FeO, MgO, MnO, CaO, Na2O, and K2O [20]. The most widely accepted and
used BI equation is given in Eq: 2.1 [55]:
BI = CaO + CaF2+ M gO + K2O + N a2O +
1
2(M nO + F eO)
SiO2+ 12(Al2O3+ T iO2+ ZrO2)
(2.1) Even though the basicity concept originated from the iron and steel making industry to describe the sulfur refining behavior of a slag and it is not rigorous, it is still popular to use. A BI value of less than one is acidic, between 1.0 and 1.3 is neutral, and greater than 1.3 is basic. Higher welding flux basicity should produce cleaner welds with respect to sulfur, phosphorous, and non-metallic inclusions. Increasing flux basicity should cause decreasing silicon and oxygen contents [55]. However, basic fluxes have a greater tendency to absorb moisture.
Submerged arc welding fluxes used during the welding process affects the physical and chemical properties of weld metal. Improved welding fluxes can enhance the welding process thereby producing improved properties in weld metal. The ability of the welding flux to minimize gas and impurity pick up is critical to microstructural development and mechanical
properties of weld metal. Thus, it is essential that certain characteristics be met by the welding flux. The melting temperature of the welding flux should be 200oC lower than that
of the filler metal and base metal [18]. The viscosity of the molten slag must be adequate to cover the molten weld pool to prevent atmospheric contamination, control slag-metal interactions, prevent weld porosity, retain alloying additions, and provide good weld bead morphology. Even though a low viscosity flux will allow for a greater bulk diffusion rate of chemical elements, i.e. a greater reaction rate at the slag-metal interface to absorb atoms and molecules into the molten slag and diffuse these species away from the slag-metal interface, the slag must still be viscous enough to protect the molten weld pool from the atmosphere [47]. The molten slag should be less dense than the molten weld metal to prevent slag inclusions.
Welding flux should also limit spatter during welding, refine the weld pool by removing impurities, and create a molten slag that is easily detachable. The arc stability of the welding process should be enhanced by the welding flux because of deliberate introduction of the ingredients that are easily ionized. The weld penetration is dependent on flux properties such as viscosity, arc stability, and capillarity [47]. SiO2 is a flux addition used to increase
viscosity and current capacity. CaO and MgO are similar in functionality which is to improve arc stability, but they can also decrease the viscosity of the molten slag. CaO is a better arc stabilizer than MnO [16]. Lighter fluorides such as MgF2 and CaF2 in fused submerged arc
welding fluxes produces unstable arcs that may result in varied penetrations and irregular bead shape [43]. CaO, MgO, and Al2O3 additions increase the sensitivity of the welding
fluxes to moisture pick up which can cause porosity in welds. MnO increases arc stability and therefore penetration but decreases sensitivity to porosity. MnO also decreases current capacity [16, 41].
The chemical interactions between molten slag and molten weld metal need to be con-sidered because of oxygen control, loss of alloying elements via oxidation, and unfavorable elemental pickup from the molten slag. There are three major stages in the submerged arc
welding process where these chemical reactions are of importance: the electrode tip stage, the droplet stage, and the weld metal stage. Slag-metal reactions are most prevalent at the molten electrode tip because of the high surface-to-volume ratio of the molten metal and the intense stirring caused by the Lorentz force. The stirring motion induced by the Lorentz force brings the reactants in the molten slag and metal towards the slag-metal interface whereby diffusion through boundary layers in the slag and metal causes slag-metal reactions to occur. The extent of diffusion is determined by activity gradient which is a function of the thermodynamics of the reaction. Thus, a thermodynamically favorable reaction will have a high concentration of the reaction product at the interface with a high diffusion rate [43]. 2.2 High Strength Low Alloy Multiple Pass Welds
The development of HSLA steels and welds has been driven by the need to reduce costs and the enhanced mechanical properties, specifically strength for certain applications. High strengths and high toughness can initially be achieved by refining the grain size.
2.2.1 Macro-Alloying Additions
Ferrite in HSLA steels is strengthened by grain refinement, precipitation hardening, and some solid solution strengthening. Alloying additions in HSLA steels assist in strengthening the ferrite by grain refinement, precipitation strengthening, and solid solution strengthening. Solid solution strengthening is related to alloying content whereas precipitation hardening and grain refinement is related to the interdependent relationship of the alloy design and the thermomechanical treatment. Alloying additions also lower the transformation temperatures from austenite to ferrite to produce finer microstructure to enhance strength. Some austenite stabilizers are given in the following in order of decreasing effectiveness: carbon, nitrogen, manganese, nickel, and copper. Higher carbon content decreases weldability and impact toughness, but at controlled amounts this deleterious effect can be minimized. In amounts greater than 1 wt. pct., manganese is the main strengthening element in HSLA steels [40]. As a mild solid solution strengthener in ferrite, manganese also decreases the transformation
temperature from austenite to ferrite. In high strength steels, manganese content greater than 1.6 to 1.8 wt. pct. degrades toughness [13]. Manganese also forms manganese sulfide inclusions.
Silicon is a deoxidizer in molten steel. It increases the strength of HSLA steels and is an effective solid solution strengthener, Figure 2.1. Silicon oxides can form as weld metal inclusions thus decreasing hardness. Chromium is a relatively strong hardenability agent. Controlled amounts of chromium, copper, and phosphorous can enhance the corrosion resis-tance of steels. Nickel is also added into HSLA steels to enhance corrosion resisresis-tance to the atmosphere. It is also a mild solid solution strengthener of ferrite and an austenite stabilizer which improves toughness in HSLA steels. Molybdenum is essential to increasing deforma-tion resistance at elevated temperatures. Another carbide stabilizer also a carbide former, molybdenum is primarily added to HSLA steels to improve hardenability when transforma-tion of microstructures other than ferrite-pearlite is required, i.e. acicular ferrite and bainite. In HSLA steels, molybdenum additions (0.15 to 0.30 wt. pct.) increase the solubility of nio-bium in austenite [40], which enhances the nionio-bium carbide precipitates in ferrite. These precipitates also pin austenite grain boundaries thereby retarding grain growth. Nickel, chromium, and molybdenum are all effective substitutional hardeners [7]. Aluminum is added to control austenite grain growth and is also a deoxidizer. Aluminum has been shown to increase strength and decrease toughness in high strength steel weld metal.
It is generally accepted that nickel and manganese additions in controlled ratios in low carbon structural steels increase toughness. However, HSLA steel systems differ in compo-sition, there is no clear picture as to the effect of nickel additions between two to five wt. pct., a range within which falls the specific HSLA steel system proposed for this research. 2.2.2 Second Phase Particles in Weld Metal
Second phase particles in HSLA steel submerged arc weld metal include sulfides, nitrides, carbides, carbonitrides, and oxides. These particles are complex in chemical and structural nature. They typically take the general form of MC, M C, M C , MN, M N, M N , and
Figure 2.1: Solid solutions strengthening of ferrite [44].
CNx. Microalloying additions of vanadium, niobium, and titanium are all strong carbide,
nitride, and carbonitride formers [19]. Chromium, molybdenum, iron, and zirconium also form carbide and nitrides. Silicon nitrides are sometimes formed. The origin of non-metallic inclusions can be divided into two groups: indigenous and exogenous. Indigenous inclu-sions form by precipitation as a result of homogeneous reactions in the steel and are mostly composed of oxides and sulfides. Exogenous inclusions are a result of slag and other contam-ination which contact the molten steel. Some features of exogenous inclusions are large in size, random in occurrence, irregular in shape, and complex in structure. The main mech-anism for formation of non-metallic oxides inclusions is deoxidation [27]. Most exogenous inclusions are complex oxides of manganese, silicon, aluminum, and titanium along with manganese sulfides. In submerged arc welding with the basic Oerlikon OP121TT flux on steels with yield strength less than 690 MPa (100 ksi), twenty-one different inclusion types were identified and the nine major types are as following in highest to lowest occurrence [33, 34]: MnO-SiO2-FeO-Al2O3-TiO2, SiO2-FeO-Al2O3, MnO-SiO2-Al2O3-TiO2,
MnS-MnO-SiO2-Al2O3-FeO-TiO2, SiO2-Al2O3, MnO-SiO2-FeO-Al2O3, MnO-Al2O3-SiO2,
2.3 Fundamental Metallurgical Principles
In this section, a brief background on some fundamental theories needed for the under-standing of the weld metal development sequence conveyed in this research will be presented. 2.3.1 Basic Solidification Concepts
As uniform liquid solidifies, solute atoms in the liquid are redistributed. This redistribu-tion depends on both the thermodynamic and kinetic condiredistribu-tions. The partiredistribu-tioning coefficient of an element can be determined by Eq: 2.2 where CS and CL are the solid and liquid
com-positions determined from the initial composition of the alloy of interest, CO. The value of
k depends on temperature but if the solidus and liquidus lines are assumed to be linear then k can be assumed to be constant.
k = CS CL
(2.2) When k is less than one, the content of alloy of the solid is less than the composition of the liquid thereby causing the solute to be rejected into the liquid. During solidification the solute content of the liquid continues to rise. The solute content of the solid also continues to rise during solidification since the solid grows from the higher solute liquid. Composition of a solidified alloy weld is not uniform. Concentrations of impurities and alloying elements are different in different parts of the weld. These differences are a result of different solubility of impurities in liquid and solid phases at the equilibrium temperature, thereby resulting in segregation.
During solidification, the S/L interface can be planar, cellular, columnar, and equiaxed dendritic depending on the processing condition and material involved. The thermodynamic aspect that quantifies constitutional supercooling is defined by the difference between the equilibrium liquidus temperature minus the actual liquidus temperature. As constitutional supercooling increases, the solidification mode transforms from planar to cellular, to colum-nar dendrite, and then equiaxed dendrite. At a high temperature gradient and low growth
rate, the solidification front will be planar. When growth rate increases and temperature gradient decreases, the planar solidification front breaks down. With perturbations in the planar solidification front, cellular mode which is characterized by elongated cells in a dense-packed pattern results. In a weldment, both elongated cells and honeycomb-like structures are termed cellular growth and a cross-sectioned specimen can contain both. In a planar front, the undercooling of the melt ahead of the interface is the driving force for solidifica-tion. The temperature distribution in the melt, which controls the solidification process and the stability of the interface is a function of position and distance from the interface. As undercooling increases with the distance from the interface, a temporary faster growth will occur at the interface forming a perturbation. The planar interface will now become unsta-ble allowing the perturbation to grow until steady state is achieved. The concentration of solute around the base of the perturbation is higher than at the tip of the perturbation thus retarding solidification in the base minimizing the radial growth. The magnitude of the con-stitutional undercooling will dictate the structures with strong undercooling corresponding to honeycomb-like structures or hexagonal cells.
Solidification microstructure of alloys are affected by the temperature gradient, G, and the growth rate, R, as seen in Figure 2.2. A high G/R forms a planar solidification whereas a low G/R forms an equiaxed dendrite solidification microstructure. At higher cooling rates, the morphologies of solidification structure become finer since there is less solidification time. The slower the cooling rate during solidification, the coarser become the solidification structures since there is more time available for coarsening. Note that the morphology of solidification is determined by the ratio G/R while the size of the solidification structure is dictated by the product G*R [29].
During fusion welding, base-metal grains at the fusion line are the substrate for nucleation and epitaxial growth. While new grains can nucleate at random orientations, epitaxy occurs in the same crystallographic orientation of base-metal grains. For FCC and BCC crystal structures, the epitaxial growth continues in the <100> direction. In multiple pass welding,
this phenomenon can be observed at the fusion line of each new bead. As grain growth continues away from the fusion line, the mechanism known as competitive growth dominates in the bulk weld metal. In Figure 2.3, it can be seen that the solidifying grains will continue to grow in the preferred direction typically perpendicular to the weld pool (the melting temperature isotherm) and out-grow the less favorably oriented grains.
Figure 2.2: Effect of temperature gradient, G, and growth rate, R, on the dendrite morphol-ogy and size of solidification microstructures [29].
Figure 2.3: Epitaxial and competitive growth in the bulk weld metal fusion zone [29].
The nucleation of new grains during welding can occur via four different mechanisms: dendrite fragmentation, grain detachment, heterogeneous nucleation, and surface nucleation,
Figure 2.4. Dendrite fragmentation can occur due to weld pool convection where dendrite tips are broken off in the mushy zone along the back of the weld pool and carried into the bulk weld pool to act as nuclei for new grain formation. Grain detachments occur when partially melted grains detach from the S/L interface of the weld pool to act as new nuclei for new grain formation. Heterogeneous nucleation occurs when foreign particles in the weld pool provide substrate with favorable crystallography that can act as a nucleus. The last mechanism for nucleation of new grains during welding occurs at the weld pool surface that can be thermally undercooled to create nuclei. During welding these nucleation sites on the surface can grow new grains downward into the liquid metal in the weld pool [29].
Figure 2.4: Nucleation mechanisms during welding: (a) top view; (b) side view [29].
2.4 Austenite Decomposition in Steel Weld Metals
The main factors that influence microstructure of a steel weld are the following: weld chemical composition, austenite grain size, and cooling rate from 800oC to 500oC. The weld
composition is determined from three contributing parts in submerged arc welding: sub-merged arc welding flux, filler metal wire, and base metal. The microstructure of steel weld metal is produced by weld metal solidification and subsequent austenite
decompo-sition. Products of austenite decomposition that can form include grain boundary ferrite (GBF), Widmanst¨atten ferrite (WF), acicular ferrite (AF), bainitic, martensite, and retained austenite (RA).
2.4.1 Ferrite Morphologies
During austenite-to-α-ferrite transformation, the austenite parent phase decomposes into the transformation products. These transformations continue until adjacent transforma-tion products impinge neighboring transformatransforma-tions. By a nucleatransforma-tion and growth process, different morphologies of pro-eutectoid ferrite forms along austenite grain boundaries and interfaces. Using the Dube classification, for a small undercooling, allotriomorphic ferrite0 forms along the austenite grain boundaries. During nucleation, the allotriomorphic ferrite crystals exhibit a preferred orientation relationship with one of the austenite grains which is usually of the Kurdjumov-Sachs (KS) type: {111}γ //{110}α and <1¯10>γ //<1¯11>α.
The KS relationship shows that the closed-packed planes and directions of austenite and ferrite are parallel to each other. Sometimes, ferrite orientation relationship may alter and not have close-packed parallel directions such as the one given by the Nishiyama-Wasserman (NW) type: {111}γ//{110}αand <101>γ//<001>α. The ferrite can grow into the adjacent
austenite grain with no specific orientation. A grain boundary allotriomorph, grain bound-ary ferrite, or equiaxed ferrite is described as a crystal that is nucleated on and grows along the parent phase grain boundary, Figure 2.5(top). Allotriomorphic ferrite is often described as blocky ferrite nucleating on high angle boundaries. Grain boundary ferrite is not desirable for weld metal toughness because it provides a continuous crack path along the parent phase boundary through the ferrite [45].
Idiomorphic ferrite (ID) can also form within the austenite grains. For larger under-cooling, the pro-eutectoid ferrite that forms from the austenite grain boundaries is WF. Needle-like or plate-like ferrite is termed WF or Widmanst¨atten sideplates that grow near the {111}γ octahedral planes on a habit plane [10][45], Figure 2.5 ( left and
high as 20:1 [62]. Through a displacive transformation mechanism, WF growth occurs by a para equilibrium (PE) mode. Paraequilibrium transformation is when the substitutional alloying elements cannot partition while carbon, the fast diffusing interstitial element, re-distributes between phases until uniform chemical potential is reached. The growth rate is carbon diffusion controlled in the austenite ahead of the WF plate formation. Widmanst¨atten ferrite is also characterized by the K-S orientation relationship given above and grows with a habit plane close to {111}γ.
Figure 2.5: Schematic diagram of grain boundary ferrite and Widmanst¨atten ferrite [1]. Reprinted from Krauss, 2005.
At high cooling rates, HSLA steel welds can form acicular ferrite. Figure 2.6 shows a continuous–cooling-transformation (CCT) diagram for HSLA 80 steel plate where the amount of AF decreases with decreasing cooling rates along with increasing microhardness. The transformation temperature of acicular ferrite is close to that of Widmanst¨atten ferrite but the morphology differs. Acicular ferrite in HSLA steel welds are described as short, non-parallel arrays of ferrite laths that are arranged in an interlocking pattern, basket weave with a large number of laths growing close to each other and therefore impinging upon one another. The laths are typically 1 to 2 micron thick with an aspect ratio ranging from 4:1 to 10:1 [62]. Ferrite laths are shown to have high dislocation densities separated by high angle grain boundaries. The fine intragranular acicular ferrite morphology found in low-carbon steel welds are known to improve notch toughness, Figure 2.7.
Figure 2.6: Continuous-cooling transformation diagram for HSLA 80 plate steel [54]. Reprinted from Krauss, 2005.
Figure 2.7: Acicular ferrite in low-carbon weld metal. Nital etch, light micrograph at 500x. Courtesy of S. Liu, Colorado School of Mines. Reprinted from Krauss, 2005.
Acicular ferrite has been shown to nucleate on oxide particles in weld metal [34, 63]. Figure 2.8 shows a schematic of different ferrite morphologies that develop during the so-lidification of steel weld metal including acicular ferrite nucleation from intergranular and intragranular inclusions. Larger volume fraction of acicular ferrite increases strength and toughness due to the interlocking nature of the laths [62]. Thus, acicular ferrite is desirable ferrite morphology in HSLA steel submerged arc welding specifically to enhance lower shelf notch toughness.
Figure 2.8: Schematic diagram of intragranular acicular ferrite (IAF), polygonal or primary ferrite (PF), bainitic ferrite (BF) or Widmanst¨atten ferrite (WF), and inclusions as nucle-ation sites in weld metal [31]. Reprinted from Krauss, 2005.
It is well documented that the formation of acicular ferrite is associated with the distri-bution of non-metallic inclusions in steel weld metal since they provide preferential sites for nucleation. The efficiency of a nucleation site is related to the lattice disregistry between nucleating phase and the inclusion [42]. Research suggests that low mismatch between the inclusion and ferrite will promote acicular ferrite formation since the inclusions with the best lattice matching with acicular ferrite should be most effective in its nucleation [39]. This observation suggests that the specific phases with their respective lattice parameters within inclusions are responsible for nucleating acicular ferrite. Inclusions with galaxite (Al O ·MnO), a spinel in face-centered cubic (FCC) structure with a lattice parameter of
0.82 nm, and TiO in a FCC structure with a lattice parameter of 0.42 nm seem to promote nucleation of acicular ferrite [36]. Sulfides have been debated as nucleation sites. Some researchers have dismissed MnS, but some think that sulfides play a critical role in acicular ferrite formation.
It has also been suggested that stress/strain fields around inclusions from differences in the thermal expansion coefficients between the inclusion and the matrix can promote nucleation of acicular ferrite at inclusion sites [11]. This suggestion of the difference between the coefficients of thermal expansion was contradicted by research that calculated resultant strain energy and found it minor relative to the transformation energy required for nucleation [9]. Being heterogeneous nucleation always more favorable than homogeneous nucleation, intragranular nucleation sites are always more favorable in developing acicular ferrite [34]. Other factors that affect the formation of acicular ferrite are the quantity and size distribution of the non-metallic inclusions.
In weld metal of low alloy steel, the average nucleus size is around 0.5 micron. Non-metallic inclusions with a distribution between the ranges of 0.4 to 0.9 micron are better nucleation sites for acicular ferrite. Inclusions with a bell curve size distribution from 0.1 to 0.5 micron are poor nucleation sites for acicular ferrite [32]. Studies have also shown that with weld metal oxygen content between 200 to 350 ppm with inclusion size ranging between 0.3 to 0.9 micron, acicular ferrite nucleation is favorable. At lower weld metal oxygen content (15-30 ppm), the inclusion sizes decrease to 0.35 to 0.75 micron: acicular ferrite nucleation is still shown to be favorable [66]. Even though refined acicular ferrite is used widely in industry to enhance toughness in steel weld metal, a clear understanding of the mechanism of acicular ferrite nucleation is not complete.
2.4.2 Bainite
Bainitic microstructure is composed of various phases, typically a mixture of ferrite and cementite morphologies. There are two distinct ferrite-cementite morphologies identified as upper bainite and lower bainite. In upper bainite, cementite forms between ferrite laths at
temperatures below 500oC. In lower bainite, cementite forms within ferrite laths at
tem-peratures below 300oC. Aaronson et al. identified six morphologies of bainite, Figure 2.9
[1].
Figure 2.9: Schematic drawings of the six morphologies of bainite according to Aaronson et al.: (a) nodular bainite, (b) columnar bainite, (c) upper bainite, (d) lower bainite, (e) grain boundary allotriomorphic bainite, and (f) inverse bainite [1]. Reprinted from Krauss, 2005.
It is believed that the bainite transformation is more displacive in nature where a ferrite forms from austenite with complete supersaturation of carbon through displacive transforma-tion. Note that the ferrite in bainite is termed bainitic ferrite. Carbon diffusion to austenite occurs through a post-transformation event. The overall transformation kinetics originates from the bainitic ferrite and should show surface relief, no substitutional partitioning, an incomplete reaction phenomenon because of subsequent carbon diffusion, and a KS and NW orientation relationship.
The bainite structure is transformed as aggregates of ferrite plates separated by thin films of austenite, martensite, or cementite. These aggregates of plates are called sheaves or subunits. The platelets within the sheaves tend to adopt a consistent orientation rela-tionship. As each sheaf grows, new subunits will nucleate near the tips of the existing sheaf
where austenite is unstable and carbon concentration is low. The incomplete transformation is described by two different mechanisms: composition-invariant growth and solute drag. For the composition-invariant growth using the displacive transformation model, initially bainitic ferrite and the parent austenite begin with the same composition and the carbon then partitions to austenite or forms carbides. Thus, the formation of bainitic ferrite is possible when a certain region of austenite has a lower carbon content than initial compo-sition. Once the initial compositional temperature is reached again, bainitic ferrite growth stops. This process gives an incomplete reaction since ideally the reaction should continue to metastable equilibrium, Ac3. Using a diffusional model, bainite transformation is incomplete
due to alloying elements at the transformation interface reducing mobility and creating an energy barrier requiring additional driving force to overcome the solute drag effect [10].
For this research, a combination of bainite morphologies will be considered: lower bainite (LB), upper bainite (UB), granular bainite (GB), and coalesced bainite (CB). Lower bainite has fine needle-like features at lower transformation temperatures. The carbides form in a single habit plane oriented approximately 55-60oto the γ − α habit plane. A high dislocation density should exist for LB. Upper bainite has a coarser needle-like structure at higher trans-formation temperatures and forms cementite as the carbide. For cementite, the orientation relationship in LB is {001}θ//{211}α, <110>θ//<0¯11>α, and <010>θ//<1¯1¯1>α. For GB,
its ferrite laths are acicular in nature and possess martensite-austenite (M-A) constituents and retained austenite (RA) along with martensite [10]. Coalesced bainite are bainitic ferrite grains that have coalesced together with small carbides dispersed within the coarser bainitic ferrite grains [23, 24].
2.4.3 Martensite
Martensite is a diffusionless transformation from austenite due to a shear mechanism. The fast cooling rate does not allow for diffusion of carbon atoms but instead traps the carbon atoms within octahedral sites of a body-centered cubic (BCC) structure producing the martensitic phase. Due to the arrangement of carbon atoms in BCC, martensite takes on
a body-centered tetragonal (BCT) structure which is a distorted BCC structure where the c/a ratio is greater. There are two major morphologies in martensite, plate and lath. Plate martensite can be identified by its random arrangement of martensite plates and is limited in ductility and more crack-susceptible. Lath martensite occurs in low and medium carbon steels whereas plate martensite is formed in high carbon steels. In HSLA steel weld metal, only lath martensite will develop because of the lower carbon content. Lath martensite is transformed in large numbers whereby the individual laths are separated by low angle boundaries allowing them to align themselves parallel to each other known as packets [30].
The martensite transformation involves a shear parallel to the habit plane (interface between austenite and martensite phase) with expansion normal to the habit planes. In-variant plane strain (IPS) surface relief or tilt occurs due to the volume and shape change. The habit plane for low carbon (0-0.4 pct.) for steels is {111}γ with orientation
relation-ships as {111}γ//{011}α0, <10¯1>γ//<1¯11>α0 [45]. The martensite transformation kinetics
is nucleation-controlled rather than growth controlled with the internal structure either high in dislocation density (lath) or large amount of twins (plate).
2.5 Effect of Nickel
The literature review presented below demonstrates that past research has examined the effects of nickel on mechanical properties through microstructural characterization and mechanical testing without providing any clear explanation as to the mechanisms that dictate the formation of these microstructural constituents.
Research studies on HSLA steel systems with nickel contents between one to three wt. pct. has been conducted quite extensively for quantitative microstructural characterization and mechanical testing. For as-welded conditions, Evans and Bailey concluded that at one wt. pct. manganese, increasing nickel content increased the amount of acicular ferrite. Yield strengths for one wt. pct. manganese and increasing nickel amounts of 1, 2.25, and 3.5 wt. pct. were approximately 450, 460, and 475 MPa, respectively. Ultimate tensile strength for those same alloys gave values of approximately 525, 550, and 575 MPa, respectively.
Correspondingly, the ductile-brittle transition temperatures for 100 J (73.6 ft-lbs) for these alloys were approximately -60, -65 and -50oC, respectively. At 1.8 wt. pct. manganese,
increasing nickel content up to 2.25 wt. pct. increased acicular ferrite. Above 2.25 wt. pct. nickel, martensite began to form and ferrite with second phase increased at the cost of acicular ferrite, which also reduced the impact toughness of the weld.
Yield strengths for alloys that contained 1.8 wt. pct. manganese and increasing nickel amounts of 1, 2.25, and 3.5 wt. pct. were approximately 550, 600, and 650 MPa, respectively. Ultimate tensile strengths for those alloys gave values of approximately 630, 675, and 725 MPa, respectively. Charpy v-notch temperatures for 100 J (73.6 ft-lbs) for 1.8 wt. pct. manganese alloys were approximately -40, -10, and 20oC, respectively. An increase in nickel
generally increased the amount of acicular ferrite at the expense of both primary ferrite and ferrite with second phase. With the high manganese level of 1.8 wt. pct. and nickel above 2.2 wt. pct., the formation of martensite and increasing amounts of ferrite with second phase occurred at the expense of acicular ferrite and primary ferrite. The aspect ratios of acicular ferrite were increased with the addition of nickel and grain boundary carbides precipitated after stress relief. At low manganese content of 0.65 wt. pct., toughness improved as nickel additions increased. At high manganese content of 1.8 wt. pct., toughness decreased as nickel content increased above 0.5 wt. pct. Toughness was improved with low manganese content with nickel additions up to 3.5 wt. pct. For similar nickel content, Evans and Bailey also found the welds with 1 wt. pct. manganese have acceptable toughness [15].
Wang and Liu [60] demonstrated that increasing nickel content increased the amount of acicular ferrite and decreased grain boundary ferrite. Martensite formed at high nickel contents. Nickel additions initially decreased prior austenite grain size but additional nickel rapidly coarsened grain size. The best weld toughness had a composition of 1.6 wt. pct. manganese and 1 wt. pct. nickel or 0.7 wt. pct. manganese and 2.5 to 3.5 wt. pct. nickel. Welds with higher nickel contents (2.5 wt. pct. for 1.6 pct. manganese and 5.5 wt. pct. for 0.7 to 0.3 wt. pct. manganese) exhibited poor toughness from an increased presence of
martensite [60].
For nickel contents of 3.14, 7.23, and 9.23 wt. pct. with a constant two wt. pct. man-ganese, Keehan et al. [23, 24, 26] have done extensive characterization and testing to examine the detrimental effect of the formation of coalesced bainite on mechanical properties. At two wt. pct. manganese and 3.14 wt. pct. nickel, the microstructure solidified predominately as δ-ferrite which allowed less segregation and the microstructure was more homogenous with an absence of coalesced bainite. The microstructure of 7.23 and 9.23 wt. pct. nickel at two wt. pct. manganese was not much different from each other. The overall microstructure was very fine with a mixture of bainite, martensite, and films of retained austenite.
These welds solidified as austenite which resulted in significant segregation of manganese and nickel to interdendritic regions and promoting coalesced and upper bainite in the dendrite core regions with martensite at interdendritic regions. The reheated regions were a mixture of tempered bainite and martensite. Yield strength for the varying amounts of nickel of 3.14, 7.23, and 9.23 wt. pct. were determined as 756, 795, and 848 MPa, respectively. Ultimate tensile strength for those same compositions were determined as 945, 1006, and 1051 MPa, respectively. The impact toughness as a function of temperature was given for those same compositions as 50, 31, and 11 J at -40oC and 80, 38, and 17 J at 22oC, respectively. The
optimal microstructure presented by Keehan et al. showed that a predominant mixture of upper and lower bainite with some martensite and no coalesced bainite gave the best combination of strength and toughness [22, 25].
Keehan et al. [22] demonstrated that in high manganese welds, high resolution mi-croscopy showed that dendritic core regions consisted of a mixture of mostly upper bainite and some coalesced bainite. Interdendritic regions displayed mostly martensite. Additions of carbon content encouraged martensite formation and reductions of manganese promoted upper bainite in the microstructure. The mechanical properties and the neural networking predictions were often parallel. High manganese and high nickel improved strength but nega-tively impacted toughness while a decrease in manganese increased impact toughness greatly.
Mechanical properties can be related to the relative amounts of the different microstructural constituents. Martensite provided high strength and tolerable toughness, whereas upper and lower bainite gave both good toughness and strength. The combination of coalesced bainite and martensite gave the least desirable properties. Ac1 was lowered by the increasing
con-tents of manganese and nickel which does not allow for tempering in the reheat regions and contributed to undesirable microstructural changes that lead to poorer impact toughness. The optimal strength and impact toughness possessed a fine mixture of upper and lower bainite with some martensite at the combined 0.5 wt. pct. manganese, 7 wt. pct. nickel, and intermediate carbon level which also gave a higher Ac1 for more tempering of reheated
regions [22].
Additional research from Keehan et al. [23, 24, 26] showed that using both shielded metal-arc welding and submerged metal-arc welding processes, a constant 7 wt. pct. nickel content with varying manganese content from 2 to 0.5 wt. pct. improved toughness which is explained by an increase in the amount of upper and lower bainite instead of coalesced bainite. At this high level of nickel, decreasing amount of manganese decreased the presence of coalesced bainite. From a microstructural standpoint, a higher proportion of upper and lower bainite provided good strength and great toughness whereas coalesced bainite was determined as a negative contribution to toughness. In addition, good strength and toughness can also be found in a martensite microstructure with coalesced bainite dispersed homogeneously throughout [23, 24, 26].
Research from Keehan et al. also used neural networking models that have predicted a loss in toughness with nickel additions for manganese content greater than 1.5 wt. pct and a gain in toughness for nickel additions for manganese content below 1.5 wt. pct. Increasing nickel additions at two wt. pct. manganese increased strength by solid solution hardening and increased amounts of martensite due to nickel and manganese segregation to interdendritic regions. For higher manganese content welds described above, the toughness decrease was attributed to the formation of coarse grained coalesced bainite [23, 24, 26].
Muruganath et al. [37] also used mathematical models to demonstrate improvement in toughness and strength using nickel as the primary alloying addition to ferritic weld metals. When manganese content is high, nickel is detrimental to toughness. However, when nickel is added to low manganese content impact toughness is increased. These findings through neural network modeling were confirmed with shielded metal-arc welding low-manganese and high-nickel consumables in physical experiments. It is still not understood why there are opposing effects of nickel with varying manganese content [37].
Bhole et al. [5] performed a literature review stating the confusion of the effects of nickel in HSLA steels. It is known that nickel and molybdenum play pivotal roles in microstructural control with no optimal nickel content established. Molybdenum additions in the range of 0.817-0.881 wt. pct. increased the impact toughness and decreased the fracture appearance transition temperature (FATT). An increase in acicular ferrite and granular bainite was also observed. Combined nickel (2.03-2.91 wt. pct.) and molybdenum (0.7-0.995 wt. pct.) in the weld metal increased acicular ferrite and toughness. Increasing only nickel resulted in lower weld metal toughness and higher FATT. A decrease in acicular ferrite and increase in ferrite with second phase aligned were observed [5].
Kim et al. [28] showed that there are two main ways to enhance mechanical properties: grain refinement and the control of alloying elements. For Steel A (0.193 C, 1.350 Mn, 0.482 Mo, 0.922 Ni), coarse cementite particles precipitated along the lath boundaries with a small number of fine M2C carbides distributed within the laths. In Steels B (0.099 C, 0.701 Mn,
0.962 Mo, 2.500 Ni) and C (0.060 C, 1.550 Mn, 1.000 Mo, 1.460 Ni) where carbon content was reduced dramatically and molybdenum and nickel content were increased, the number of fine M2C carbides was increased and the number of coarse cementite particles decreased.
In Steels B and C, M-A constituents were formed but decomposed to carbides and ferrite after tempering. The tensile and fracture properties of B and C steels were better than those of Steel A [28].
![Figure 2.9: Schematic drawings of the six morphologies of bainite according to Aaronson et al.: (a) nodular bainite, (b) columnar bainite, (c) upper bainite, (d) lower bainite, (e) grain boundary allotriomorphic bainite, and (f) inverse bainite [1]](https://thumb-eu.123doks.com/thumbv2/5dokorg/4334873.98372/40.918.187.731.229.589/schematic-drawings-morphologies-according-aaronson-columnar-boundary-allotriomorphic.webp)
![Figure 3.1: Halved, angled aerial view of the submerged arc multiple pass weld mockup with ESAB flux (˜18 cm [˜7 inches] in width and length ˜10 cm [˜4 inches] in length).](https://thumb-eu.123doks.com/thumbv2/5dokorg/4334873.98372/50.918.238.683.148.551/figure-halved-submerged-multiple-inches-length-inches-length.webp)
![Figure 3.2: Cross sectioned view of the submerged arc multiple pass weld mockup with ESAB flux (˜10 cm [˜4 inches] in depth).](https://thumb-eu.123doks.com/thumbv2/5dokorg/4334873.98372/51.918.148.771.136.539/figure-cross-sectioned-submerged-multiple-mockup-esab-inches.webp)