,1-1
~
c,t;
C
ER,
~2-19~
CODY
2
HYDRAULIC MODEL STUDY OF THE
KREMASTA DAM SPILLWAY
KREMASTA HYDROELECTRIC PROJECT ACHELOOS RIVER DEVELOPMENT
GREECE
ADDENDUM I
FLIP BUCKET RELOCATION
Colorado State University Research Foundation Civil Engineering Section
Hydraulics Laboratory Fort Collins, Colorado
AUG 16
'71
f O THlLLS
rl
Ia
KOO
/
i
I
I
HYDRAULIC MODEL STUDYM
ASTEa
FILE
~OPY
OF THE
KREMASTA DAM SPILL\VAY
-K·REM.ASTA HYDROELECTRIC PROJECT
AC HE LOOS RIVER DEVELOP~;IENT
GREECE
ADDEr-.TDUM I
FLIP BUCKE f RELOCATION
Colorado State University Research Foundation
Civil Engineering Section
Hydraulics Laboratory
Fort Collins, Colorado
September 1962 CER62SSK19a
I 1\\1\ 111\\111\\1
Ill\
\
\
\
\\\\
\\
l\\i\\ \\\\\\\\I\\\\\ \\\H\1\\1
u
1 84D1 0593534.
,
KINGDOM OF GREECE PUBLIC POWER CORPORATION
A THENS. GREECE
FINAL REPORT ON A MODEL STUDY
OF THE
KREMASTA DAM SPILLWAY
KREMASTA HYDROELECTRIC PROJECT ACHELOOS RIVER·DEVELOPMENT
GREECE
ADDENDU1vl I
FLIP BUCKET RELOCATION
Prepared for
Engineering Consultants Inc. Denver. Colorado
by S. S. Ka.r&..ki Hydraulics Laboratory Colorado State University
Colorado State University Research Foundation
CivH
Engineering SectionList of Figures Introduction . • • Flip Bucket CONTENTS
.
.
.
.
.
.
.
.
. .
.
.
.
.
.
.
.
.
.
.
.
.
.
.
.
.
.
.
.
.
. .
.
.
.
.
.
.
.
.
.
. .
l l 1 Slope Protection • • . . • . . . • • • . • • • 4 River Bed Erosion and Power Plant TailFigure
/
I
FlGU.RES
63(a) through (j) Flow conditions from flip bucket in
revised location
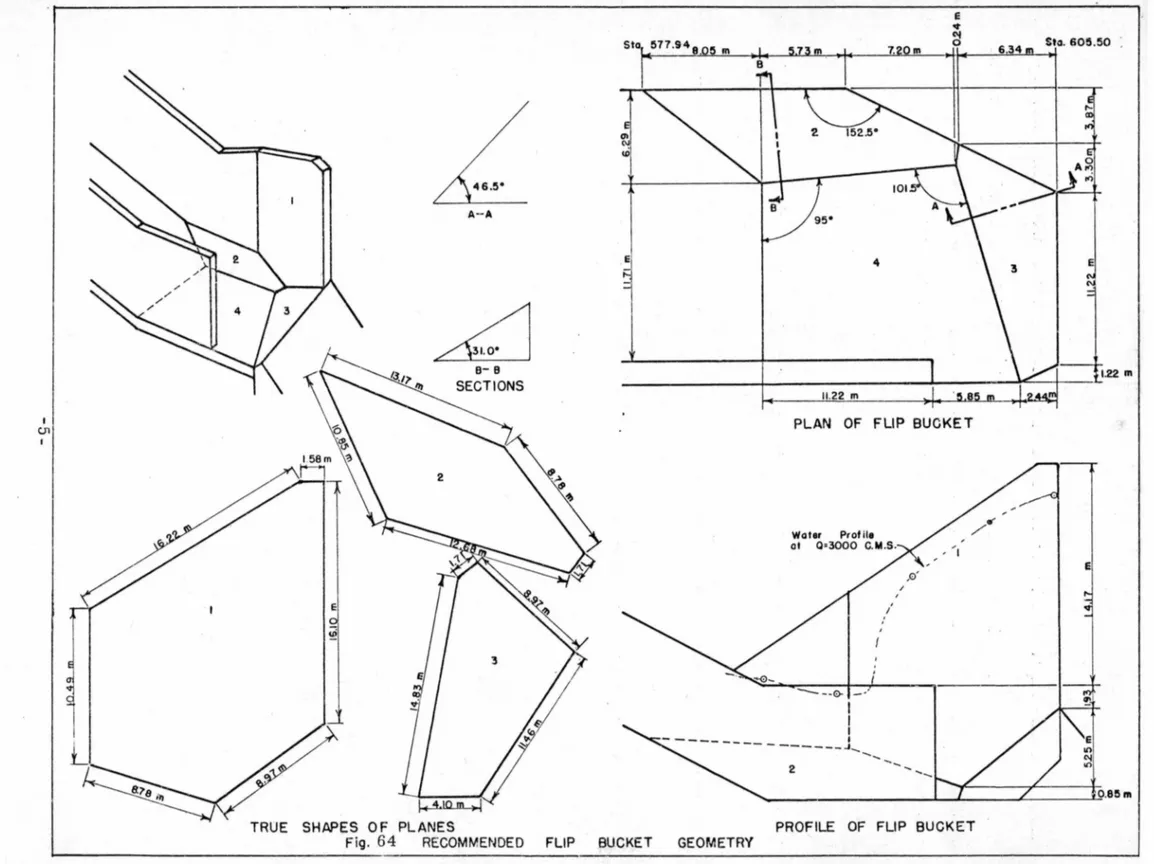
64 Recommended flip bucket geometry
65 Water su~face profiles and pressure heads in flip bucket
66 Slope protection, preliminary design
67 Preliminary slope protection below
fiip bucket
68(a) through (c) Flow over preliminary paved protection
Q = various ems
69 Flip bucket jet clears paving edge and cliff
70 Slope protection, recommended design
71 Recommended paved slope protection
72
73
7
4
75
Vertical section to left wall at the
down-stream end of paving
Recommended paving, Q. = 100 ems
.Recomrnended p3.ving. Q = 150 ems
Stage discharge rating cu:.'ves at
model gaging station
-i-z
5 6 1 8 3 9 11 1010
12 12 13Figure
/
I
,-•
FIGURES-Continued
76(a) and (b) Scour pattern '\vith 3/8-inch gravel
Q s 1000 ems. power plant Q = 400 ems 14 77(a) and (b) Scour pattern with 3/8-inch gravel
Q = 2000 ems. power plant Q = 400 ems 15
78(a) and (b) Scour pattern with 3/8-inch gravel
Spillway Q = 3000 ems, power plant
Q = 400 cm~ 16
79 Step Hydrograph 17
80(a) Scour pattern with hydrograph of Figure 79 18
80(b) Power plant tailwater level 18
80(c) Power plant tailwater level
No power plant discl13.rgc 19
81 River stage studies 20
82(a) through (c) Scour patterns with 3/·1-inch gravel 21
83(a) through (c) Scour patterns with bed roe'· at
elevation 139. O m .21
84 Power plant tail water levels,
bed rock at elevation 139. 0 22
-ii-INTRODUCTION
Subsequent to the publication of "Hydraulic Model Study of the
Kremasts Dam Spillway" in 'larch, 1962, additional foundation investigations revealed the advisability of relocating the spillway flip bucket. It was pro-posed that the chute spillway be shortened a horizontal distance of 25 meters with no change in slope so that the floor oi the flip bucket would be at eleva-tion 195.21 meters and the flip bucket would terminate at station 0+580.56
meters.
The general model of the Krem.asta Dam spillway which had been
constructed in the hydraulics laboratory at Colorado State University was altered to meet the above conditions. Additional model tests were performed
to
check the flip bucket performance in the revised location. Specifically, the objectives of the study were to:1. Determine the jct impact area of the flip bucket in the revised location and modify the flip bucket if necessary.
2. Determine the effect of the jet impact on the river bed and on the water level in the power plant tail race.
3. Determine the slope protection necessary at the flip bucket
to
prevent erosion of the hillside.
Flip Bucket -- The chute spillway of the general model was
shortened a horizontal distance of 23 meters with no change in the spillway
slope so that flip bucket terminated at station O + 580, 56 meters and the bucket floor was at elevation 195, 21 meters.
The recommended flip bucket described in "Hydraulic :Model Study
of the Kremasta Dam Spillway" was tested in the revised location on the model
-
.
discharges greater than approximately 200 cms1 the flip bucket performed
satisfactorily. The resulting flow conditions are shown in Figures 63(a) through (j) . Figure 63(a) Figure 6 3( c) -2-t
r
.
/
I ,("""~ ... -~' ..;..:. ·: •,:' ....-
.. \!._ ... L Figure 63{b),
.
6[.IJ: G ,, .. .,'.
-c
'
;'..,l!.
1/
. ",,
vi
,-. ' ,:~ . • '1 -(/ I t. ;,,' I Figure 63( d)-
.
•.., -.~ ' ' ...,,
. , / - I <'¥,
>
_1
,
...-
·
.
I...
I
I
Figure 63(e) --.-~-'
-· .,.. . ,. Figure 63(g} Figure 6 3( i) Figure 6 3( f) _,.
·
.~·,,
--r\
.
Figure 63(h) Figure 6 3(J)-3-..
•.
Discharges less than 200 . ems impacted on the hillside before
,
cascading into the river below. The recommended measures
to prevent
erosion are discussed in the section on slope protection.Due to a slightly lower velocity or flow through the flip bucket in the revised location and the resulting greater flow depth, the left wall height of the recommended flip bucket has been increased. A higher flow line along the left was -also caused by interception of the standing wave at a different point from the original flip bucket location. The pertinent dimensions of the recommended flip bucket are shovvn in Figure 6·1.
Dynamic pressure heads were measured at selected points in
the model flip bucket at a prototype discharge of 3000 ems. The pressure point locations and measured pressure heads are shown in Figure 65. No negative pressures were recorded. Figure 65 also shows the water surface profile along the right wall of the flip bucket for discharges of 1000, 2000. and 3000 ems.
Slope Protection -- At spillway discharges less than approxi-mately 200 ems. the jet emerging from the model flip bucket irr:.pacted on
the hillside before falling to the river below. Because spill'way discharges
of this magnitude will occur frequently in the prototype. some preventative
pleasures should be taken to protect the hillside impact area from erosion.
The preventive measures consisted of slope protection by paving with
retaining walls.
The first method investigated, as proposed by Engineering
Consultants Inc .• consisted of a paved area bounded by the flip bucket, two
curved training walls and the cliff edge as shown in Figures 66 and 67. The flow at the right was contained by a wall tapering in height from 2. 0 meters at the flip bucket to 4. 5 meters at the edge of the cliff. A freeboard of
-I CJ1
,
46.5° A··A~
E <DTRUE SHAPES OF PLANES
B- B SECTIONS Sta. 577.9 4 8.05 m .E e
...
~ Sta. 60~.50 e~~~~d=i2.22m
PLAN OF FLIP BUCKET
- - - 0 - 1 -· I I I I
---
-
---J-....
2 .... __--PROFILE OF FLIP BUCKET
e
I C1)
'
I
- \..l.J' ' r \..J' - I1
,
·
.
II
,v'
~
,.'~--q,
3.S:Ja/
it
~
4 r, " d')2! 1. R ::, 1 - . 1 I PIEZOMETER LOCATIONS~
"-WATER SURFACE PROFILE ALONG RIGHT WALL OF FLIP BUCl<ET
FLOW DEPTH ABOVE FLIP
j
BUCKET FLOOR IN METERS
~
1000 2000 . 3000C
M
S
CMS CMS 0 2.55 4.25 6,.33 I 2.30 3.76 5.84 · ') 2.78 4.38 6.21..
3 3.03 4.75 6.94-
, 3.65 _ L3.65 I :3.65~
I
I
_JI
3000---'"'"" -
-
-+---_t~_-:_- ---+----0 2 3RIGHT WALL PROFILE
PRESSURE HEADS IN FLIP BUCKET IN METERS OF WATER PROTOTYPE
PROTO-
PIEZOMETER NUMBERSTYPE Q CMS I 2 3 4 5 6 7 8 9
l
10 II 12 13 14 15 16 17 18 19 20 21 22 23 -1000 2000 I I 3000 35.432.6 26.t 31.0 41.2 33.3 10.1 27.1 26.€ 2.9.5 f46.3 - 3.3 9.6 2.6-
33.3 12.1 26.C 33.8 340 15.6 11.8I -J I Flow
I
0 0 (\//
Flip Bucket _ _ _ _ _ S_p1_·11_wa1_ CenterlineFlip Bucket Floor Elevation= 195. 21 m.
~
/~
/~o
Upstream Troinin<J Woll U) lO 0 co lOJ
N
Area Downstream Woll,t>
... PLAN SCALE: 1:300CONTOUR INTERVAL: 5 METERS ON NATURAL GROUND
I METER ON PAVED SURFACE
.
..
' t ~ . -.
\ . . . '...
\I \ •(' ' _.';.;:_t..~~~ /...
Figure 67 Preliminary slope protection below flip bucket.
Figure 68(b) Flow over prelimi -na.ry paved protection.
Q = 100 ems.
/
-8-Figure 68(a) Flow over
pre-r
liminary paved protection
at Q = 50
e
m
s.
Figure 68{c} Flow over
pre-liminary paved protection.
Q = 150 ems.
I
/
.:;_.
1. O meter is afforded by this. wall hdght. A fillet at the base of the wall
was provided. Although this fillet is not required for hydraulic reasons
it
might be used to structurally stabilize the w~ll. The left wall was4.0 meters in height which contained discharges up to 50 ems, but w:is
not adequate for higher discharges. Discharges above 50 ems , bul less
than 200 ems impacted on the hillside dovrnstream of the wall. Figures 68(a) through G8(c) illustrate the flow conditions for discharges of 50 •
100, and 150
ems.
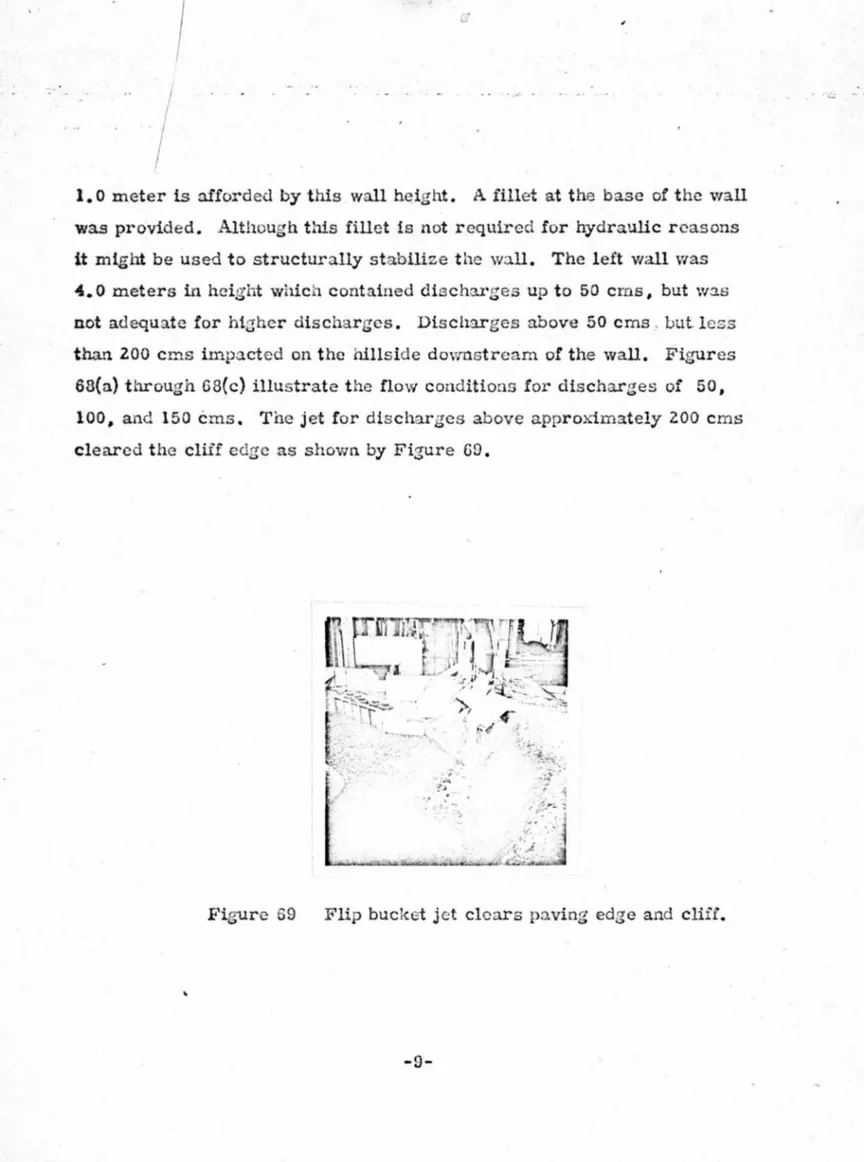
The jet for discharges above approximately ZOO emscleared the cliff edge as shown by Figure 69.
Figure 69 Flip bucket jet clears paving edge and cliif.
-9-Downstream walls of various heights and alignments were tested to
determine a.'1 economical and effective solution to the problem. The
recommended slope protection consists of a large paved area bounded by
the upstream curved wall described above~ the flip bucket. the cliff edge,
and a straight vertical wall 2. 0 meters in height extending along the left
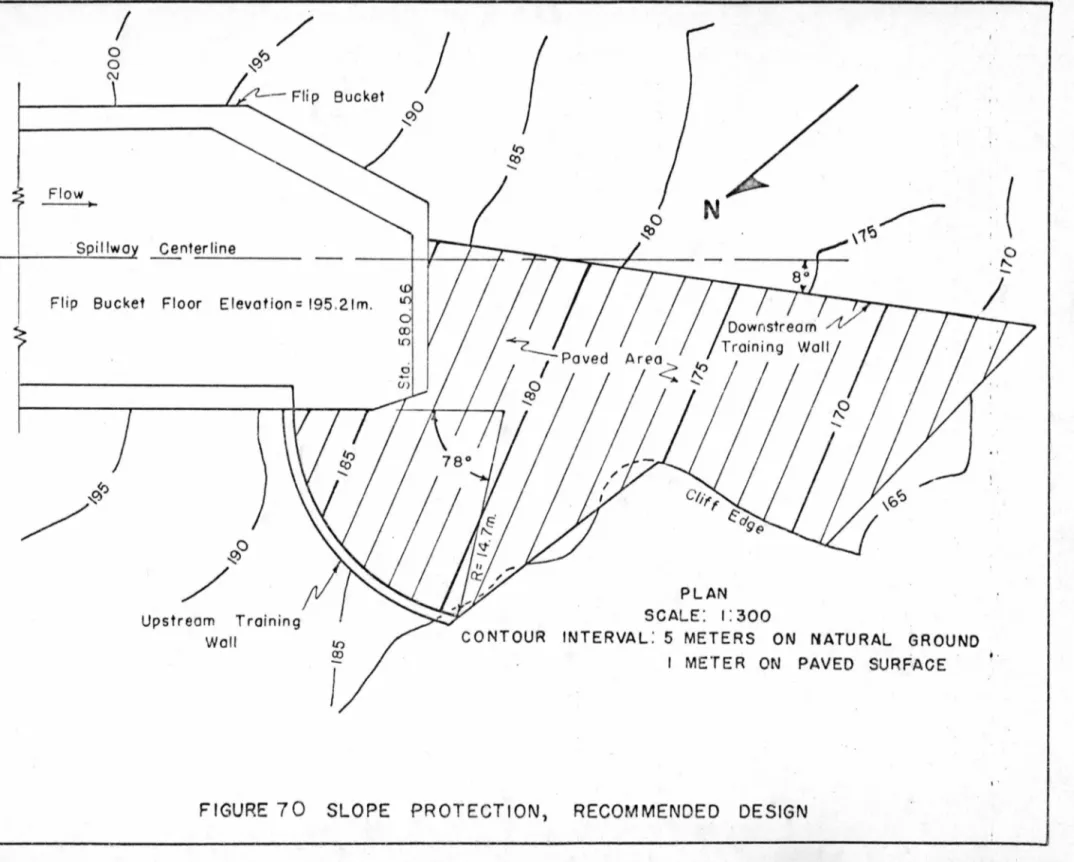
edge of the paving from the flip bucket to the cliff edge as shown in Figures
70 and 71. In order to prevent overtopping near the downstream end of the
left wall without increasing the wall height,
it
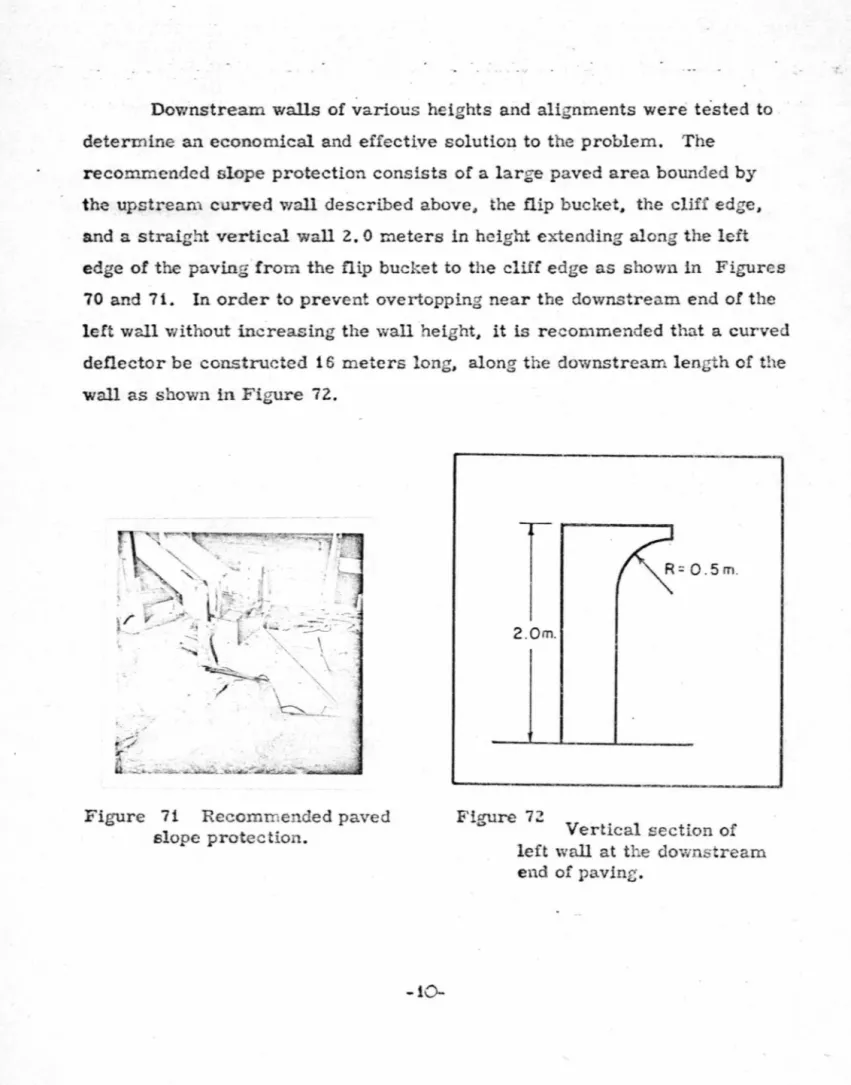
is recommended that a curved deflector be constructed 16 meters long, along the downstream length of the wall as shown in Figure 72.Figure 71 Recommended paved
slope protection.
-10-T
R= 0.5 m.I
2.0m._____
_____
,_
_
_
___
_, Figure 72 Vertical section of left wall at tl e downstream end of paving.I ... ... Flow
I
0 0 C\J Spillwo Centerline/
~V) Flip Bucket/
N
Flip Bucket Floor Elevation= 195.21m.
!r:,
/ ~
9:,0/"
Upstream Training WollI
PLAN SCALE: 1: 300CONTOUR INTERVAL: 5 METERS ON NATURAL GROUND
I METER ON PAVED SURFACE
FIGURE 70 SLOPE PROTECTION, RECOMMENDED DESIGN
.
.
(
0 ,..,_. :~
·
-
";.Figure 7 3 R ,ecommended paving
Q = 100 ems , (
-'
~ -11~~ ~ ) . ' .. "k. ;< ,;.,
~
·
ir
, -
.
·
. ._
·
.
-
..
r
Figure 74 Recommended paving
Q = 150 ems
Figures 7 3 and 7-4 show model flow conditions over the paving with discharges
of 100 and 150 ems rcsp.ectively.
River Bed Erosion and Power Plant Tail V./ater Levels
The stage-discharge curves at the location of the model gaging
station are reproduced as Figure 75 which coincides 1.vith Figure 53 of the
parent report.
To provide a range of possible c.:)nditicns of the river bed in the
prototype, as was done in the parent study, the model tests included two
dif-ferent bed material sizc6 and the elevation of the ''bed rock11
was studied at
two levels ( 115. 0 meters and 139. 0 meters). Description of the model
river bed materials can be found on page 30 of the original report.
2-. . . .
•
~ CD -;;; ~.:
> CD w -'J' --~.:--t:.-::-···--
. --
.-
·•-
-·-~
'~---
~l---·
-
1,.,-~ L---I--
---
L--- ·- i..--[ _ _ . ~ k,..---""
i..--~ r--10· yr Dec;irc ded E ed
-
,-
·-1,.--:--_;.-::::::-
I:::="-k
L--
i-Do, nlitrear, Re.sE Vcif' QI
~
~~ ~mu:r.,,,, ,rlntia~ evaticll ~ ---
-
,-EztiStir q Bed--
v.,..
---L.---...
~
/--
,,"' / ~ ~•V?
V
V
~
v
--/
,., / /V
'no..,
stream Rese voir at Normbl Poe -- / Afte, Oegr ~do lion·-
/V
I Existin~ ing Bed Levie! = 140.E m
I /
Cln-' ""' CV /I.ft ,,. ,n-. r,.,,,, ln,<n+ln~ : l">.7 I m
~·
I
·--t 21DO 4)0 6<DO aipo IOPQ 1200 14bO IEKlO 1800 2C 00 22
po
2400 26~o
28100
jo
:t)ischcr ie in C.M.!.
Figure 75 STAGE DISCHARGE RATING CURVES AT MODEL GAGING STATION
The development of scour in the river bed with the 3/8~inch
gravel and spillway discharge of 1000 ems is shown in Figure ?6{a). The
tailwater levels at the power plant are shown in Figure 76(b) with
pro-gressive stages of scour beginning with the existing river bed level at
ele-vation 140. 6 m. The white lines in the photograph are contour lines. The
:minimum elevation in the scour hole was 128. Om. Test results for dis
-charges of 2000 and 3000 ems are shown in Figures 77 and 78 respectively.
The power plant wall was not overtopped in any of the tests.
Scour development after a flow cycle, the hydrograph of which is shown in Figure 79. is shown in Figure 30(a). The scour area was more
ex-tensive and a greater amount of river bed material was transported down
-stream. Variatio. of tail water levels with discharge are shown in Figure 80{b).
The maximum tailwater level was 153. 1 m providing 2. 9 meters cf freeboa.rd
to the top of the wall. On the recession cycle of the hydrograph the power
plant was shut down and tailwater levels were measured with only the
spill-way flows. The result is shown in Figure eO(c).
-13-' . (J) a:: w r-w
I
151 ~ 150 z _J w > w _i 149 a:: w r-<! 3 148 0I
I
-
·
~-
r
·
/Figure 76(a) Scour pattern with 3/8-inch gravel
Q =. 1000 ems
Power Plant Q = ,.~00 ems
Model time = 23 min.
Maximum scour= Elevation 128. 0 m
.
I I . . . , /
RIVER LEVEL AT MODEL GAGING STATION
---
\POWER PLANTTAILWATER LEVEL
-<--MAXIMUM SCOUR
DEVELOPMENT
2 3 4 5
TIME IN HOURS PROTOTYPE
Figure 76(b)
-1
4-6 7
I
(/) er w I--w ~ z _J w > w _J er w I--<l: 3';
I
II
154 153 152 ~ - - - · - --- - - --Figure 77(a) Scour pattern with 3/8-in. gravel
Q = 2000 ems
Power plant Q = 400 ems Model time = 30 min.
Maximum scour El. = 130 m
RIVER LEVEL AT
MODEL GAGING STATION
'
~
L---'"
\ POWER PLANT TAIL WATER LEVEL151 0 2 3 4 5 TIME IN HOURS 6 7 PROTOTYPE Figure 77(b) -15 -8 9 -10
•
Figure 78(a) Scour pattern with 3/8-in. gravd
Spillway Q = 3000 ems
Power plant Q = 400 ems
Model time = 40 min.
Maximum scour El. = 124 m
~
177 METERSI ./
FLIP BUCf<ET .FLOW Figure 78(b) -16-RIVER LEVEL AT GAGING STATION 155. 7I
-(/) ::i: 3000 o 2000 ...J z I w (.9 cc <! :r 1000 0 (/) 0 0I
' - -0I
_j . l 2 3 i-I
-I
-
,.
I
I-I
I
' 11
I I :J
J 4 5 6 7 8 9 10 11 12 13 14 15 16 TIME IN HOURS PROTOTYPE·,. . ' . ·~ . -. .Ii> ·, '
"i
f
~
):
'
. \ ~ J:ih'~~~ I . : ~ /t,.,\~"d, :r .:
.'.
--·,~
;:-
·
,
~
:(
·-
;
i
i
·
~ ~
~, .,
'·.
(L/
:'.f:.:.
~
~, - -~ ~ - . -· . -.~ :~ :: i•-t • • -!-.- ~~ ' t , , : : . "~ ~, . . . J. .. .,.,• ' ~-~ 1-7:~.JM.f ...ardi ~Figure 80{a) Scour pattern with hydrograph of Fig-ure 79.
156
g?
154TOP OF POWER PLANT WALL:"\_
w ~ 152 ~ 150 z _Jl48 w
G'j
146 . _J cr144 w f- 142 <t~
140 0 A '1/' 500 Figure 80{b)1
Il
---RIVER L E V E V ---- 1----GAGING STATION i _ _ - -.__-- ~
~
PLANT TAILWATEF-< LEVEL , 1000 1500 2000 2500 3000 DISCHARGE IN CMS POvVER PLANT Q = 400 -CMSPo,Her plant tailwater level. -18
-I
I
If.€ CJ> 154 0:: ~ 152 w :ii: 150 z 148 _J ~ 146~
144 0:: ~ 142 <! ---/ .:··:TOP OF POWER PLANT WALL
- ~
I
I
I
---
l.---RIVER LEVEL A ~ GAGING STATION _,,,----
~~--
°lpoWER PLANT / TAILWATER LEVEL //
~ 140 0 500 !000 15CO 2CvC 25C C 3COC Figure 80( c) DISCHARGE IN CMSPower plant tailwater level. No power plant discharge
Because of the gravel bar formed downstream of the scour area., the tailwater levels at discharges less than 2000 ems were higher than at
corresponding discharges during the ascending cycle of the hydrograph.
T?ere was sufficient freeboard to the top of the power plant wall at all discharges.
To determine at what river stage the power plant wall would be overtopped, tests were run at several discharges with imposed hi~h-river levels to cause overtopping. The tests were made with maxin1um dis
-charges through four turbine units. Results are shown in Figure 81. There was at least 5. 5 meters of allowance in depth between the calculated stage and that which would cause overtopping.
-19-U) 0 8 16 15 156
ffi
154 ~ w 152 ~ z 150 ...1 148 w > 146 ~ er: 144 w?;i
142 ~ 1400 --
I
'F:~
"L -RIVER LEV AT WHICHPOWER PLANT WALl.::1
'WAS OVERTOPPED ~
---
L--" ~ -_,/ '¥-_CALCULATED RIVERl /
STAGE AT MODEL -/ '>AGING STATIONV
~ ; 500 1000 1500 2000 2500 3000 DISC~ARGE IN CMSFigure 81 River stage studies
The results of tests with 3/ ~-inch gravel L'1 the n~odel river
bed arc shown in Figures 82(a) through (c) for discharges of 1000~ 2000.
and 3000 ems. The power plant tailwater levels were the same as tests
with the 3/8-inch gravel bed.
Tests results with river bed rocks located at elevation 139. 0 m
are shown in Figures 83(a) through (c) for discharges comparable to
Figure 82. Measured tailwater levels at the power plant are sho · n in
Figure 84. The tailwater at the power plant ,vas lower for corresponding
discharges during tests with the bed rock at elevation 139. Om than during
tests with the bed rock at elevation 115. O m. This was because of the draw -down effect of the flip bucket jet. No apparent tailwater problem will arise
if bed rock is near the present river bottom.
-20-)
Figure 82(a.) ~-' / _/r
Figure 82( c)Scour patterns with
3/
4-inch gravelQ = 1000 ems
Scour patterns with
3/4-inch ·gravel Q = 3000 ems Figure 82(b) -, ' I Figure 83{a}
-21-Scour patterns with
3/4-inch gravel
Q = 2000 ems
j
Scour patterns with
bed rock at elevation
139. 0 m
Q = 1000 ems
.
..
)
I
ry
V • r-· Figure 83(b) 160 158 (f) ~ 156 1--~ 154 2 152 ..J 150 w ~ 148 ..J 146 er ~144 <t ~ 142 140 0 ., . I -~ ,>-,,.--
~
~ -
7
-:m
- ~~~ / . I 1 "1
..JCOUl' patt<:!rl.1S with
bed rock at
cl~V'.:i-tion 139. O ·m
Figur·e 83(c) Scou, p~-itte.rns with
bed 1·oc': at
eleva-tion 130. 0 m
Q • 2000 ems Q
=
3000 crnsI I I I
TOP, OF PO,WER PLANT WALL~
I r I I
_,,.,.-RIVER LEVEL AT MODEL _.,--,
GAGING STATION POWER PLANT .• TAILWATER . / ' ~~UNITS_-~00 ~MS __
v
. /--
··-v
-
I. / POWER PLANT TAILWATER
-NO FLOW THROUGH TURBINES
500 1000 1500 2000 2500 3000
DISCHARGE IN CMS
FIGURE 84 POWER PLANT TAILWATER LEVELS
BED ROCK AT ELEV. 139.0