The effect of target, catchment, and comparison site
operationalization on CCTV impact evaluations:
methodological considerations from a case study
Karl Kronkvist1
Accepted: 13 April 2021/ # The Author(s) 2021
Abstract
Objectives To examine the extent to which different operationalizations of target, displacement, and comparison sites affect the interpretation of a CCTV impact evaluation.
Methods Different operationalizations are used to examine change in property and violent crime before and after CCTV was introduced in a residential neighbourhood in Malmö, Sweden, using paired t tests, odds ratio effect sizes and weighted displacement quotients. Results Despite most results being non-significant as a result of low statistical power, different operationalizations appear to produce varying results. This issue is most prominent for target sites and property crime while it is less so for catchment and comparison sites, and violent crime outcomes.
Conclusion Valid operationalizations of research areas are highly important for CCTV impact evaluations and may affect the study outcome. Future research with access to larger data sets is encouraged to elaborate on these findings and further analyse the impact of measurement choices on experimental outcomes.
Keywords Camera surveillance . CCTV . Construct validity . Intervention . Impact evaluation . MAUP . Operationalization . Place
Introduction
The number of impact evaluations on the crime preventive effect of camera surveillance, or closed-circuit television (CCTV), is steadily growing. In the updated systematic review and meta-analysis by Piza et al. (2019), the number of publications included was almost
https://doi.org/10.1007/s11292-021-09468-9
* Karl Kronkvist karl.kronkvist@mau.se
1
twice as large as in its forerunner published a decade earlier (Welsh & Farrington,2009). While a large amount of research has been devoted to studying the impact of CCTV on crime, and rightly so, there has also been an increase in the attention focused on methodological issues pertaining to this endeavor. One such issue concerns the way research areas and units of analysis are defined, including the operationalization of target, catchment, and comparison sites. As was accurately noted by Waszkiewicz (2013:157), “[t]he choice of methods and research areas is crucial and strongly influences the results of each study.” Similarly, Caplan et al. (2011) note that different operationalizations of, for instance, target sites in CCTV research may lead to either under- or over-estimations of CCTV’s impact on crime. These issues are closely related to the modifiable areal unit problem, which essentially states that different operationalizations of place may impact the results of any studied spatial outcome (Openshaw,1984; see also Tita & Radil,2010). In addition, the operationalization of target sites in particular is also sensitive to issues of construct validity, i.e., the extent to which an operationalization reflects the theoretical construct researchers are looking to examine (Shadish et al.,2002).
While this may come as no surprise to some scholars, the amount of empirical research dedicated to operationalizations of target, catchment, and comparison sites and their significance for impact evaluation outcomes is rather scarce (however, see Caplan et al., 2011; Ratcliffe et al., 2009; see also Ratcliffe & Breen, 2011). Against this background, the aim of this study is to examine the extent to which different operationalizations of target, displacement, and comparison sites affect the results and interpretation of a CCTV impact evaluation. This issue is empirically examined using a case study in which police monitored CCTV has been implemented in a residential neighborhood located in the central part of Malmö, Sweden.
Previous research
In addition to outcome data and information on when the intervention was introduced, CCTV impact evaluations usually include three main components. The first, and most important, is the target site, which represents the spatial area expected to be affected by the cameras. While Ratcliffe et al. (2009) suggest two theoretically relevant operationalizations of these sites—either as a potential offender’s awareness space or the actual coverage area of any particular camera—there is no commonly agreed approach in previous CCTV research. In turn, a variety of different operationalizations have been used, which include, for instance, geographical administrative units such as police districts (e.g., Farrington et al.,2007a; Prenzler & Wilson,2019) or other census-based units (e.g., Park et al.,2012; Vilalta et al.,2019), buffer zones surrounding the location of each studied camera (e.g., King et al., 2008; Lim et al., 2016), and viewsheds representing the actual line-of-sight of the cameras (e.g., Ratcliffe et al., 2009; Piza, 2018).1 The use of the latter involves a process in which researchers 1
Another common operationalization of target sites is by means of facilities, an operationalization which is used when camera surveillance has been implemented within clearly delineated localities such as garages or parking lots (La Vigne & Lowry,2011) or subway stations (Priks,2015). In addition, some studies have operationalized target sites as streets or street segments that are under camera surveillance (e.g., Munyo & Rossi,2020) or as a spatial area that, on the basis of information provided by implementers, is covered by camera surveillance (Gill & Spriggs,2005; Waples et al.,2009).
observe live camera feeds to digitalize precise individual viewsheds using geographic information system (GIS) software (Ratcliffe et al., 2009). This procedure includes specifying a detailed camera distance capacity (e.g., at what distance a car license plate can be distinguished) and also a precise area of surveillance, by taking physical obstructions that block the camera viewshed, such as buildings or foliage, into account (Piza et al.,2014,2015; Ratcliffe & Groff,2019; Ratcliffe et al.,2009). One limitation with this approach, however, is that many researchers lack access to live camera feeds. Therefore, Caplan et al. (2011) suggest an alternative approach using aerial photogra-phy and GIS software to draw camera viewsheds while still taking photogra-physical constraints into account.2While a similar approach to defining viewsheds has been used in other studies (Lim & Wilcox,2017; Park et al.,2012), they have also been produced using specific GIS viewshed analysis tools (Ways & Pearson,2018) or by drawing viewsheds based on documentation from the local police agency (Gerell,2016).
The second main component of the CCTV impact evaluation is a counterfactual to infer what would have happened without the intervention (e.g., Braga,2012; Farrington & Painter,2003). Although counterfactuals have been extrapolated from target site pre-intervention crime trends using a time-series design (e.g., Priks,2015), they are usually defined by crime trends at comparison sites. While these can be produced by means of random allocation to treatment and comparison conditions (La Vigne & Lowry,2011; Piza et al.,2015), such randomized controlled research designs are rather rare in place-based crime prevention research (Welsh et al., 2011). This is why the quasi-experimental approach is much more common, with scholars in this case attempting to minimize any pre-existing differences between target and comparison sites by matching them on a number of variables thought to be correlated to the outcome (Braga, 2012).3 Regardless of research design, however, the operationalization of comparison sites in previous research does not differ notably from that of target sites. For instance, crime trends in administrative units in which CCTV has been implement-ed are usually comparimplement-ed to crime trends in equivalent administrative units without any CCTV (e.g., Park et al.,2012; Prenzler & Wilson,2019; Vilalta et al.,2019). Similarly, when target sites are operationalized as buffer zones surrounding camera locations, comparison sites may be comprised of an additional buffer zone surrounding the target (or catchment) site (King et al.,2008; Lim et al.,2016; Ways & Pearson,2018), or as buffer zones created at comparable street intersections without CCTV (Papazian,2012; Robin et al.,2020; Waszkiewicz,2013). A special case of comparison sites involves the operationalization of pseudo-viewsheds, which are produced at hypothetical camera locations (e.g., street intersections) without any actual CCTV (Caplan et al.,2011; Piza, 2018). While this approach is exclusively employed when using the viewshed meth-odology for target sites, there are nonetheless a number of studies that use one operationalization for target sites and another for comparison sites (e.g., Jang et al., 2018; Lim & Wilcox,2017; Ratcliffe & Groff,2019).
2
One shortcoming of this approach compared to the observation of live camera feeds is that the actual observation distance may not be established in a similarly valid manner. Instead, Caplan et al. (2011) suggest that viewsheds should be delimited by behavioral settings (represented by twice the median block length) from which the cameras are noticeable to passers-by.
3
To name a few, these include land use (e.g., Farrington et al.,2007a; Gerell,2016; La Vigne et al.,2011), sociodemographic composition (e.g., Jang et al.,2018; Robin et al.,2020; Waszkiewicz,2013), and pre-intervention crime rates (e.g., Circo & McGarrell,2020; La Vigne et al.,2011; Waples et al.,2009).
The third component of the CCTV impact evaluation is a catchment site. Although a pre-post target comparison site research design has been proposed to have an accept-able degree of internal validity (Piza et al., 2019; Welsh & Farrington, 2009), the inclusion of a catchment site allows researchers to examine any indirect effects due to the spatial displacement of crime or the diffusion of benefits to adjacent areas (Guerette & Bowers,2009). While the operationalization of catchment sites is often dependent on target sites, the undoubtedly most prevalent operationalization involves the use of buffer zones (e.g., Caplan et al., 2011; Gomez et al., 2017; La Vigne & Lowry, 2011; La Vigne et al., 2011; Mazerolle et al.,2002; McLean et al.,2013; Ratcliffe et al., 2009; Ways & Pearson, 2018). This seems to have become a go-to operationalization that is accepted within the research community regardless of the target site. However, while Bowers and Johnson (2003) stress that the size of buffer zones is an essential factor in the analysis of displacement and diffusion—since buffer zones that are too small may generate statistically unreliable data, whereas zones that are too large may conceal any patterns of crime transfer—the radius employed in previous research varies quite substantially (e.g., between 100 ft [30 m] (King et al., 2008) and 5280 ft [1600 m] (Gill & Spriggs,2005)).
While all of the operationalizations of target, catchment, and comparison sites used across different studies serve the same purpose, different operationalizations may in fact impact the results of any given study as a result of two central factors. First, unlike research focusing on individuals, where“[t]he unit of analysis is rarely a problem” (Oberwittler & Wikström,2009: 38), the theoretical construct of place may take many forms and may consequently be operationalized in a number of different ways (for a discussion see Weisburd et al.,2009). However, the mere possibility of defining a place in several ways, i.e., aggregating points in space to areal units, produces a fundamental problem, since the operationalization of place may itself affect the study results. This issue is known as the modifiable area unit problem (MAUP) and refers to the problem of scale, which relates to the size of any given area, and the problem of zonation, which focuses on how the boundaries of these areas are drawn (Openshaw, 1984; Tita & Radil, 2010). In other words, studying the same outcome but using different operationalizations of place, with regard to either the size of the units or the way in which the unit boundaries are drawn, may impact the study results (Gerell,2017). This issue is of course also relevant for CCTV impact evaluations, since the choice of how target, catchment, and comparison sites are operationalized may consequently have an impact on the study outcome.
The second main issue here relates to the fact that the operationalization of target sites in particular is sensitive to issues related to construct validity. Although all operationalizations of target sites in previous research share the same objective of defining a theoretical construct that represents a spatial area thought to be influenced by the CCTV, only parts of e.g., a geographical administrative unit may actually be covered by the cameras (Caplan et al., 2011: 258) or reflect potential offenders’ awareness space (see Ratcliffe et al.,2009). In turn, this may threaten the construct validity of a given study since it may lead to a misspecification of the target units of analysis (Shadish et al.,2002: 21). As Farrington and Painter (2003: 11) emphasize, “(…) if a project aims to investigate the effect of surveillance on offending, did CCTV really increase surveillance?” Elaborating on this concern, one may question not only whether CCTV increased the level of surveillance but also whether the use of CCTV
increased the level of surveillance at the target site as operationalized in the specific study. While it has been noted that different operationalizations of research areas in CCTV impact evaluations may affect the results of any given study (Caplan et al., 2011; Ratcliffe et al.,2009; Waszkiewicz,2013; see also Ratcliffe & Breen,2011), this issue remains empirically understudied.
The present study
The aim of this study is to examine the extent to which different operationalizations of target, displacement, and comparison sites affect the results and interpretation of a CCTV impact evaluation on crime outcomes. This is examined empirically using a case study of police-monitored CCTV that was implemented in a residential neighborhood located in the central part of Malmö, Sweden. The local police department was granted permission to install three pan-tilt-zoom cameras in June 2015, with an additional camera being installed approximately 1 year later. The cameras were active around the clock and live feeds could be monitored by both personnel at the police communica-tions center and by police officers in the field using smart devices. The case study that forms the basis for the present paper has been reviewed and approved by the Regional Ethics Board in Lund (ref. 2017/896).
Crime data and study period
Four over-arching crime categories that have commonly been studied in previous research (see Piza et al., 2019) have been included, and these comprise residential burglaries (completed and attempted, including of residential storage units, attics, and cellars), vehicle crime (theft from a vehicle; criminal damage to a vehicle), personal robbery outdoors (including purse snatching), and assault outdoors (including aggra-vated).4For the purposes of this study, the first two crime types have been collapsed to form a joint measure of property crime, and the latter two combined to form a measure of violence in public places. The main reason for collapsing crime types is that of producing crime counts in the pre- and post-intervention periods that are sufficient for improved statistical validity (see Farrington & Painter,2003). Data have been provided by the local police department and each data point includes information on the crime classification code, date and time, and the geographical coordinates of the incident. The study period is approximately 60 months, with the period from late November 2012 to mid-June 2015 serving as the pre-intervention, and that from mid-June 2015 to the end of December 2017 serving as the post-intervention period. This results in a period of 930 days both prior to and after the first three cameras were installed.
4
The rationale behind including attempted residential burglaries in the burglary category is that if an intervention, such as CCTV, is anticipated to prevent burglaries, it is reasonable to expect this to show on both completed and attempted rates of burglaries. Furthermore, purse snatching was included in the robbery category since the line between a robbery and purse snatch is rather thin. A purse snatch, unlike a robbery, does not include violence or threat of violence. Due to this rather thin line, and since a purse snatch could quite easily turn into a robbery, purse snatching was included in the personal robbery outdoors classification.
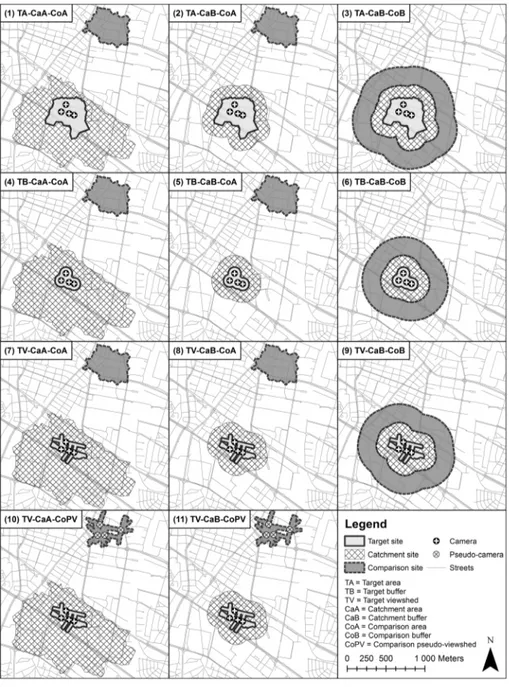
Target, catchment, and comparison site operationalizations
Three operationalizations of target sites commonly used in previous research have been employed. The first operationalization is the target area site (TA) which consists of a geographical administrative unit called Small Areas for Market Statistics (SAMS) defined by Statistics Sweden. Malmö is divided in 391 such areas and the SAMS-area representing the TA in this study covers the residential neighborhood in which the CCTV was implemented. The second operationalization is the target buffer site (TB) which has been produced by means of buffer zones surrounding each camera location. While the buffer sizes employed in previous research have commonly been justified on the basis of an estimated area of surveillance (Cameron et al.,2008; Gill & Hemming, 2004; McLean et al.,2013) or the capacity of the cameras (Jang et al.,2018; La Vigne et al.,2011; Moon et al.,2015), a radius of 266 ft [81 m] is employed here since this reflects the average distance used in previous research (see Table2in Appendix). Since the buffer zones surrounding each camera overlap, they have been dissolved into a single contingent target site (for a similar approach see Cameron et al.,2008). The third operationalization is a target viewshed site (TV). Here, the original CCTV application from the local police department to the decision-making authority was first reviewed.5 The viewsheds outlined in this document were subsequently drawn using GIS software while taking into account buildings that served to obstruct the line-of-sight of the cameras. These viewsheds were then validated by the acting police commissioner responsible for the CCTV in the area. Since some crimes (e.g., residential burglaries) are geographically projected to the inside of buildings rather than to streets, the camera viewsheds were extended by an additional 50 ft [15 m] buffer (for a similar approach see Gerell,2016).
Two operationalizations of catchment sites have been used. The first is the catch-ment area site (CaA) which includes SAMS-areas surrounding the target site (including parts of the target SAMS-area for the CaA related to the TB and TV). The second operationalization is the catchment buffer site (CaB). These sites are defined by 500 ft [152 m] buffer zones surrounding each target site. Here, 500 ft represents the median distance used in previous research (see Table2in Appendix).6The outline of each CaB varies depending on which target site it relates to.
Finally, three operationalizations of comparison sites have been used. The compar-ison area site (CoA) is a SAMS-area that shares some similar characteristics with the TA. For instance, the TA and the CoA have similar land-use properties and are of similar areal extent (TA: 0.18 km2; CoA: 0.19 km2). They also have roughly equally sized populations (TA: 2,975; CoA: 3,301), and similar counts of the studied crimes during the pre-intervention period (TA: 167; CoA: 215). While the TA and the CoA are both below the median income for Malmö as a whole, they differ with regard to other sociodemographic variables such as the proportions of foreign-born residents and youths, with the TA being more deprived. However, while the CoA is located at a 5
At the time when the camera surveillance was installed, the police authority had to seek permission from the regional County Administrative Board to conduct camera surveillance of public places. However, as of the first of January 2020, the police authority (alongside some other criminal justice authorities) is no longer required to submit a request to a decision-making authority to conduct surveillance of public places.
6
To compensate for a few studies that have used relatively large catchment sites (Gill & Spriggs,2005; Waples et al.,2009), the median distance in previous research has been used instead of the mean.
distance of approximately 1 km from the TA in order to avoid any treatment contam-ination (Weisburd & Green, 1995), both sites are located within the same policing district in order to avoid any effect of differences in policing tactics besides the use of CCTV (see Piza et al.,2014; Ratcliffe et al.,2009; Waples et al.,2009). The second operationalization is the comparison buffer site (CoB) which has been produced by employing a buffer zone surrounding the outer rim of the catchment sites (e.g., King et al.,2008; Lim et al.,2016; Ways & Pearson,2018; see also Bowers & Johnson, 2003). For the purposes of this study, the buffer radius was set to 775 ft [236 m], which corresponds to the average radius used in previous research (see Table2in Appendix). The areal extent of each CoB varies depending on which target site it relates to. The third and final comparison site operationalization is a comparison pseudo-viewshed site (CoPV). Hypothetical camera locations were identified at four arbitrarily chosen street intersections within the CoA. Using the same approach as with the actual camera viewsheds, pseudo-viewsheds were drawn taking buildings into account. However, unlike the actual viewsheds, for which a maximum coverage distance had been stated in the original application, the pseudo-viewsheds were drawn within a 582 ft [177 m] radius from each pseudo-camera location, representing a behavioral setting as sug-gested by Caplan et al. (2011).7As with the production of the target viewsheds, the pseudo-viewsheds were also given an additional 50 ft [15 m] buffer.
Analytical approach
All target, catchment, and comparison sites are illustrated in Fig.1, which also presents the 11 unique comparisons specified for this study. Before examining the relative change in crime across specifications, the first analysis aims to examine the change across each site separately between the pre- and post-intervention period. For these purposes, monthly counts of crime in the pre-intervention period are compared to those reported in the post-intervention period using a paired sample t test.8 In the second analysis, the change in crime at target sites relative to comparison sites is estimated by calculating odds ratio effect sizes with confidence intervals adjusted to account for overdispersion (Farrington et al.,2007b; Welsh & Farrington,2009). The odds ratio (OR) provides the proportional change in crime at the comparison site relative to the target site, with an OR of 1.5 indicating an increase of 50% at the comparison site relative to the target site (desirable outcome), and an OR of 0.5 a relative decrease of 50% at the comparison site (undesirable outcome). The quotient of one (1) divided by the OR provides an inverse relationship between target and comparison sites (e.g., an OR of 1.5 suggests a target site decrease of 33%). The calculation of the OR and confidence intervals, together with a more detailed methodological discussion, is provided elsewhere (Farrington et al.,2007b; Piza et al.,2019; Welsh & Farrington, 2009).
7
Caplan et al. (2011) justify the drawing of viewsheds within 582 ft of each (pseudo) camera location by reference to this distance representing twice the median block size in Newark.
8Months in the pre-intervention period were paired with corresponding months in the post-intervention
period, 3 years apart (e.g., January 2013 with January 2016). Since the study period includes an odd number of years, months during 2015 were matched slightly different (January and December, February and November, etc., with June divided in half).
To examine any potential crime displacement or diffusion of benefits to adjacent catchment sites, a weighted displacement quotient (WDQ; see Bowers & Johnson, 2003) has been calculated for each of the eleven specifications. Stated simply, the WDQ considers the change in crime at both target and catchment sites and relates this change to that of the comparison site, which provides an estimate of any potential displacement or diffusion of benefits. The interpretation of the WDQ is straightforward, with negative values suggesting displacement and positive values a diffusion of
benefits. Negative and positive values near zero suggest minor displacement or diffu-sion, while values above one or below negative one indicate major displacement or diffusion of benefits. An important notion, however, is that the WDQ is only theoret-ically relevant if the intervention has been successful (Bowers & Johnson,2003), which in the present study is represented by a OR above one (1). The calculation and an elaborated account of the interpretation of WDQ is provided by Bowers and Johnson (2003).
While there are multiple strategies for analyzing the impact of CCTV on crime, e.g., interrupted time-series analyses (e.g., McLean et al.,2013), difference-in-difference estimators (e.g., Munyo & Rossi, 2020), and multilevel regression models (e.g., Ratcliffe & Groff,2019), the reason for using OR effect sizes in the current study is two-fold. First, the use of the OR is a robust analytical approach which has been employed in both independent studies (Cameron et al.,2008; Gerell, 2016; Waples et al.,2009) and meta analyses (Farrington et al.,2007b; Piza et al.,2019; Welsh & Farrington, 2009) examining the effect of CCTV on crime. Second, the OR is a straightforward quotient which is simple to interpret and easy to compare between specifications and studies (Piza et al.,2019). Similarly, while numerous CCTV impact evaluations have employed the WDQ to examine crime displacement and/or diffusion of benefits (e.g., La Vigne et al., 2011; Lim & Wilcox, 2017; Piza, 2018), one limitation of the WDQ is that it does not allow for significance testing of displacement or diffusion effects. A viable alternative approach is thus to calculate the weighted displacement difference (WDD) with standard errors and confidence intervals as suggested by Wheeler and Ratcliffe (2018). However, compared to the WDQ, the WDD requires an additional comparison site and similar counts of crime across sites in the pre-intervention period (Wheeler & Ratcliffe,2018). While it would be possible to include the former in the present study, the latter requirement is not met. However, given the aim of the present study, it is not the statistical significance of displacement and/or diffusion of benefits that is of most interest, but rather how the quotient potentially changes depending on the way sites are operationalized.
Results
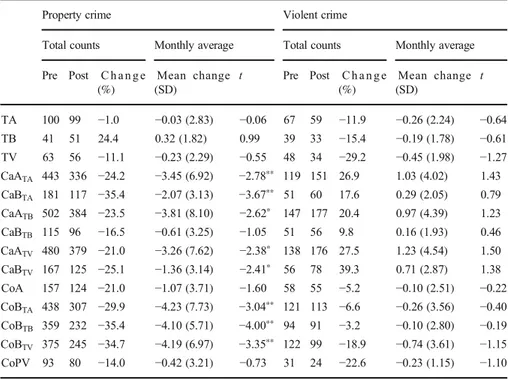
In this first section, the relative difference between the pre- and post-intervention period is examined across all operationalizations of target, catchment, and comparison sites inde-pendently. The reason for this is to provide results for each operationalization separately before turning to relative differences across target, catchment, and comparison sites. The results suggest that depending on target site operationalization, property crime has either remained basically unchanged (TA:−1.0%), moderately increased (TB: 24.4%), or modestly decreased (TV:−11.1%) between the pre- and post-intervention periods (Table1). While target site operationalization is also associated with a different impact on violent crime, i.e., decreasing in relative terms between 12 and 29%, these results still follow the same general direction of change. However, the t test of monthly counts of crime in the pre- and post-intervention periods reveals that none of the differences is statistically significant. Considering catchment sites, the results are rather consistent independent of operationalization. All operationalizations resulted in a decrease in prop-erty crime, ranging between 17 and 35%. According to the t test, all but one of the
operationalizations resulted in a statistically significant decrease in the monthly mean count of property crime. Although all operationalizations suggested a relative increase in violent crime, ranging between 10 and 39%, none proved to be significant according to the t test. In a similar way to the catchment sites, all operationalizations of comparison sites resulted in a relative decrease in both property and violent crime. According to the t test, these differences were only significant however for property crime, and only at adjacent comparison sites (i.e., CoB), not for those at a distance (i.e., CoA and CoPV).9
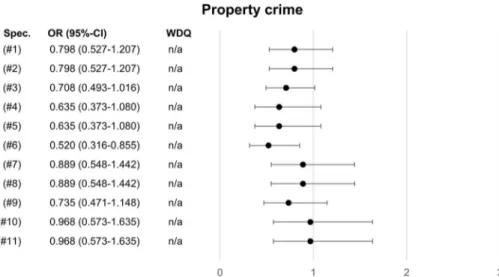
In this section, focus is directed towards the relative change in crime across target and comparison sites between the pre- and post-intervention periods. Each of the eleven unique specifications (illustrated in Fig. 1 above) is analyzed separately. The results suggest that the different operationalizations and specifications yield different results (Figs.2and3). Although all comparisons indicate that the CCTV did not have an impact on property crime, the results demonstrate that property crime has either decreased significantly at the comparison site relative to the target site (#6; OR: 0.520; CI: 0.316– 0.855), or remained basically unchanged (#10–11; OR: 0.968; CI: 0.573–1.635). 9
Due to the studied outcome being a count variable, all analyses in Table1have also been produced using the Wilcoxon Signed Rank test which did not yield different results with regard to significance testing. Table 1 Total counts of crime pre- and post-intervention and paired sample t test for monthly counts of crime pre- and post-intervention for different operationalizations of target, catchment, and comparison sites
Property crime Violent crime
Total counts Monthly average Total counts Monthly average Pre Post C h a n g e (%) Mean change (SD) t Pre Post C h a n g e (%) Mean change (SD) t TA 100 99 −1.0 −0.03 (2.83) −0.06 67 59 −11.9 −0.26 (2.24) −0.64 TB 41 51 24.4 0.32 (1.82) 0.99 39 33 −15.4 −0.19 (1.78) −0.61 TV 63 56 −11.1 −0.23 (2.29) −0.55 48 34 −29.2 −0.45 (1.98) −1.27 CaATA 443 336 −24.2 −3.45 (6.92) −2.78** 119 151 26.9 1.03 (4.02) 1.43 CaBTA 181 117 −35.4 −2.07 (3.13) −3.67** 51 60 17.6 0.29 (2.05) 0.79 CaATB 502 384 −23.5 −3.81 (8.10) −2.62* 147 177 20.4 0.97 (4.39) 1.23 CaBTB 115 96 −16.5 −0.61 (3.25) −1.05 51 56 9.8 0.16 (1.93) 0.46 CaATV 480 379 −21.0 −3.26 (7.62) −2.38* 138 176 27.5 1.23 (4.54) 1.50 CaBTV 167 125 −25.1 −1.36 (3.14) −2.41* 56 78 39.3 0.71 (2.87) 1.38 CoA 157 124 −21.0 −1.07 (3.71) −1.60 58 55 −5.2 −0.10 (2.51) −0.22 CoBTA 438 307 −29.9 −4.23 (7.73) −3.04** 121 113 −6.6 −0.26 (3.56) −0.40 CoBTB 359 232 −35.4 −4.10 (5.71) −4.00** 94 91 −3.2 −0.10 (2.80) −0.19 CoBTV 375 245 −34.7 −4.19 (6.97) −3.35** 122 99 −18.9 −0.74 (3.61) −1.15 CoPV 93 80 −14.0 −0.42 (3.21) −0.73 31 24 −22.6 −0.23 (1.15) −1.10 TA target area, TB target buffer, TV target viewshed, CaA catchment area, CaB catchment buffer, CoA comparison area, CoB comparison buffer, CoPV comparison pseudo-viewshed
Applicable abbreviations in subscript specify which target site the operationalization relates to *p < 0.05, **p < 0.01
Similarly, all comparisons indicate that the CCTV did have an impact on public violent crime, despite not being statistically significant. However, the result span for the relative increase at the comparison site compared to the target site ranges between six (#3; OR: 1.061; CI: 0.651–1.728) and 34% (#7–8; OR: 1.339; CI: 0.707–2.534).
Turning to the analysis of displacement and/or diffusion of benefits, the results are quite consistent with regard to violent crime (Fig.3). Despite resulting in different WDQs, the
Fig. 2 Forest-plot of odds ratios with confidence intervals for property crime including weighted displacement quotients across different specifications. Spec.=specification; OR=odds ratio; CI=confidence interval; WDQ=weighted displacement quotient. (#1) TA-CaA-CoA; (#2) TA-CaB-CoA; (#3) TA-CaB-CoB; (#4) TB-CaA-CoA; (#5) TB-CaB-CoA; (#6) TB-CaB-CoB; (#7) CaA-CoA; (#8) CaB-CoA; (#9) TV-CaB-CoB; (#10) TV-CaA-CoPV; (#11) TV-CaB-CoPV
Fig. 3 Forest-plot of odds ratios with confidence intervals for violent crime including weighted displacement quotients across different specifications. Spec.=specification; OR=odds ratio; CI=confidence interval; WDQ=weighted displacement quotient. (#1) TA-CaA-CoA; (#2) TA-CaB-CoA; (#3) TA-CaB-CoB; (#4) TB-CaA-CoA; (#5) TB-CaB-CoA; (#6) TB-CaB-CoB; (#7) CaA-CoA; (#8) CaB-CoA; (#9) TV-CaB-CoB; (#10) TV-CaA-CoPV; (#11) TV-CaB-CoP
general interpretation in all specifications is that the intervention led to a displacement of violent crime to catchment sites. Most of the specifications also suggest that displacement was greater than direct effects, while a few suggest a marginal displacement of crime. Since property crime decreased more across all operationalizations of comparison sites compared to target sites, the WDQ was not theoretically relevant in any of these specifications (see Bowers & Johnson,2003). Thus, this resulted in many cases which did not give any insight into the differences in WDQs based on the operationalization of catchment sites. Therefore, for the purposes of this study, all crime in each of the comparison sites was replaced with a hypothetical increase of 30% between the pre-and post-intervention periods. The results (not shown) suggest that if all comparison sites were to suffer a 30% increase in crime, the interpretation of the WDQ would be identical across all specifications, i.e., a diffusion of the benefits of the intervention to catchment sites that would have been greater than the direct effects at the target sites.
Discussion
The results from the present study indicate that depending on the target site operationalization, property crime has either remained unchanged, increased or de-creased at the target site following the introduction of CCTV by comparison with the pre-intervention period. While none of these differences is statistically significant, the results suggest that different target site operationalizations invert the direction of change in property crime. Although different operationalizations of target sites also altered the change in violent crime, it should be noted that all operationalizations showed a similar non-significant decrease between the pre- and post-intervention periods. Different operationalizations of catchment and comparison sites proved to be less susceptible to producing different results. All but one of the operationalizations of catchment sites showed a statistically significant decrease in property crime during the study period and pointed to a general decrease in violent crime as well, despite not being statistically significant. Similarly, all operationalizations of comparison sites also resulted in a decrease in property crime. However, differences were only statistically significant at adjacent comparison sites and not those at a distance. In addition, all operationalizations of comparison sites indicated an increase in violent crime during the study period, although none of these differences was statistically significant.
By specifying a comparison between target and comparison sites operationalized by means of buffer zones, which is a common approach in previous research (e.g., King et al., 2008; Lim et al., 2016; Ways & Pearson, 2018), the findings suggest that property crime has significantly increased at the target site relative to the comparison site (#6; OR: 0.520; CI: 0.316–0.855). However, using the same crime data and the same study period, but employing the viewshed methodology (e.g., Caplan et al.,2011; Piza,2018; Ratcliffe et al.,2009), the results suggest an indistinguishable change in property crime across sites (#10–11; OR: 0.968; CI: 0.573–1.635). Despite different specifications yielding varying ORs and WDQs for violent crime, the interpretation of these is by and large similar, i.e., violent crime showed a non-significant relative decrease at the target site and crimes appeared to be displaced to catchment sites.
Summing up, the findings from the present study suggest that the operationalization of research areas is crucial when examining the impact of CCTV on crime outcomes and
may have a significant effect on the conclusions that are drawn (see Waszkiewicz,2013). Despite all the operationalizations employed here suggesting a greater or lesser change in crime across the pre- and post-intervention periods, the operationalization of target sites appeared to be most susceptible to this issue. This is in line with the assumption made by Caplan et al. (2011), who note that different operationalizations of target sites may either over- or underestimate the impact of any cameras that are studied.
An important question may arise from these results: why do different operationalizations of target sites produce different crime trends? The answer to this question spells MAUP. In the present study, property crime seems to have increased post-intervention at the target site when operationalized by means of buffers but decreased when operationalized as camera viewsheds. Although the TB and TV to some degree share areal extent, they do capture different parts of the studied area’s urban geography. While there has been a slight increase in property crime between the pre- and post-intervention period in the shared area (i.e., covered by both the TB and TV), the non-shared areal extent of the TV has had a considerable decrease, while the non-shared areal extent of the TB has suffered a simultaneous slight increase in property crime. Thus, dependent on the size and how the boundaries of the target site are drawn, the results suggest that the TB has suffered an increase while the TV has had a decrease in property crime. However, since all operationalizations of target sites in the present study indicate a decrease in public violence between the pre- and post-intervention, there are reasons to believe that the importance of the MAUP may vary in regard to different crime types. A topic which deserves further attention in future research.
While the present study cannot determine which operationalization of target sites is preferable from an empirical point of view, i.e., which operationalization best reflects the“true” effect of the CCTV, there are important theoretical notions that could guide future research in considering different operationalizations of sites in CCTV impact evaluations. While geographical administrative units are often accessible to researchers, and usually incorporate important (sociodemographic) data, they are often intended to serve other purposes than that of being units of analysis in sound empirical research (Rengert & Lockwood,2009). The use of buffer zones surrounding the studied camera location(s) constitutes a systematic and easily replicable approach, but the wide range of radii employed in previous research reveals their vulnerability to the MAUP, as different scales may produce different results (Gerell,2017; Openshaw,1984; Tita & Radil, 2010). Furthermore, both larger units of analysis in which CCTV has been implemented and buffer zones suffer from the same limitation of involving a risk of including spatial areas that are not within the actual camera coverage, producing issues with regard to construct validity (see Farrington & Painter,2003; Shadish et al.,2002). The viewshed methodology may avoid these limitations by producing an accurate reproduction of the actual camera viewshed, which in turn has few arbitrary elements and is only to a limited extent susceptible to the MAUP. However, regardless of whether viewsheds are acquired by means of live observations (e.g., Ratcliffe et al., 2009), aerial photography (e.g., Caplan et al.,2011), or on the basis of documentation produced by the police (e.g., Gerell, 2016), manually drawing individual camera viewsheds using GIS is a time-consuming task compared to, for instance, producing buffers surrounding each camera location. However, researchers with access to the necessary geodata may utilize the automated viewshed functions provided by some GIS software, which could in turn facilitate this procedure (see Ways & Pearson,2018).
Limitations
The present study suffers from several limitations in relation to impact evaluation standards. For instance, while comparison sites have been chosen due to their relative proximity to the target site, and to some extent based on sociodemographic similarities, the choice remains somewhat arbitrary. Furthermore, the target site is located within a larger area forming a Business Improvement District-inspired property owner collabora-tion in Malmö, with a focus on funding a number of initiatives to reduce crime and increase feelings of security among residents. As such, this limits the internal validity of the present study since the target sites are also subject to other simultaneous interventions (Farrington & Painter,2003). Similarly, parts of the catchment and adjacent comparison sites (i.e., CoB) thus suffer from treatment contamination (Weisburd & Green,1995). Another limitation pertains to the fact that one camera was actually installed 1 year later than the first three, which means that some of the target sites (i.e., the TB and TV) cover a spatial area that was not covered by the CCTV during 1 year of the post-intervention period. However, the main aim of the present study is not to provide an impact evaluation of CCTV per se, but rather to demonstrate how different operationalizations of target, catchment, and comparison sites affect study outcomes. For these purposes, there is no reason to believe that the limitations outlined above limit the findings reported here.
However, the case study used in the present paper is afflicted by low statistical power, leading to most results being non-significant, which in turn indicates that the findings may be circumstantial. However, as has been argued by Eck (2006: 349) in defense of the small-n case study, perhaps the most importasmall-nt“(…) goal of an evaluation is to provide guidance as to what one should do next”. Furthermore, one must not forget that the only variable being manipulated across different analyses is the operationalization of sites, while keeping all other variables fixed (e.g., crime data and study period). Therefore, the arguably most interesting parameter in this study is not the statistical significance of the findings, but rather how effect sizes (percentages, ORs, and WDQs) change across different operationalizations and comparisons. Consequently, the indications presented here need to be recognized and future research should aim to replicate the present study while at the same time moving beyond a case study. Researchers with access to larger sets of data are encouraged to reanalyse their data using different target, catchment, and/or comparison site operationalizations in order to further elucidate the potential issues described in this paper.
Conclusion
The results from the present study suggest that the operationalization of target, catch-ment, and comparison sites in CCTV impact evaluations is a very important endeavor which may affect the study outcome. More specifically, the findings suggest that depending on the way they are operationalized, target sites are particularly susceptible to producing varying results, while this is less of an issue in relation to operationalizations of catchment and comparison sites. Future research is encouraged to further examine the potential issues presented here and to continue this important debate on the operationalization of place in CCTV impact evaluations, since measure-ment matters.
Appendix
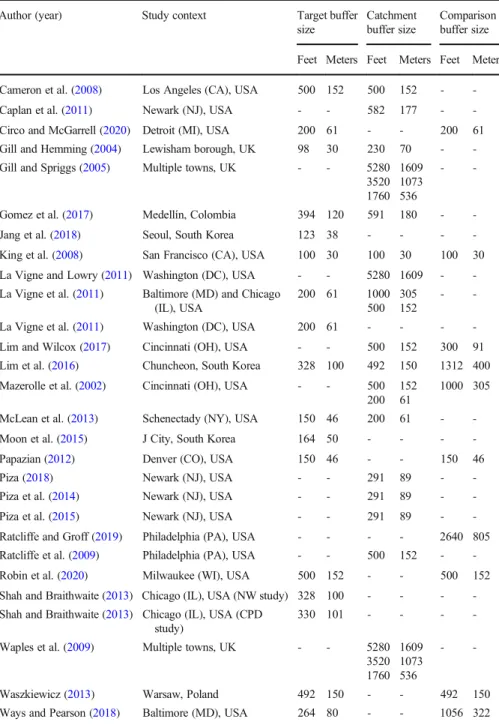
Table 2 Buffer sizes across target, catchment, and comparison sites in CCTV impact evaluations published between January 2000 and March 2020
Author (year) Study context Target buffer size
Catchment buffer size
Comparison buffer size Feet Meters Feet Meters Feet Meters Cameron et al. (2008) Los Angeles (CA), USA 500 152 500 152 - -Caplan et al. (2011) Newark (NJ), USA - - 582 177 - -Circo and McGarrell (2020) Detroit (MI), USA 200 61 - - 200 61 Gill and Hemming (2004) Lewisham borough, UK 98 30 230 70 - -Gill and Spriggs (2005) Multiple towns, UK - - 5280
3520 1760 1609 1073 536 -
-Gomez et al. (2017) Medellín, Colombia 394 120 591 180 - -Jang et al. (2018) Seoul, South Korea 123 38 - - - -King et al. (2008) San Francisco (CA), USA 100 30 100 30 100 30 La Vigne and Lowry (2011) Washington (DC), USA - - 5280 1609 - -La Vigne et al. (2011) Baltimore (MD) and Chicago
(IL), USA 200 61 1000 500 305 152 - -La Vigne et al. (2011) Washington (DC), USA 200 61 - - - -Lim and Wilcox (2017) Cincinnati (OH), USA - - 500 152 300 91 Lim et al. (2016) Chuncheon, South Korea 328 100 492 150 1312 400 Mazerolle et al. (2002) Cincinnati (OH), USA - - 500
200 152 61
1000 305 McLean et al. (2013) Schenectady (NY), USA 150 46 200 61 - -Moon et al. (2015) J City, South Korea 164 50 - - - -Papazian (2012) Denver (CO), USA 150 46 - - 150 46 Piza (2018) Newark (NJ), USA - - 291 89 - -Piza et al. (2014) Newark (NJ), USA - - 291 89 - -Piza et al. (2015) Newark (NJ), USA - - 291 89 - -Ratcliffe and Groff (2019) Philadelphia (PA), USA - - - - 2640 805 Ratcliffe et al. (2009) Philadelphia (PA), USA - - 500 152 - -Robin et al. (2020) Milwaukee (WI), USA 500 152 - - 500 152 Shah and Braithwaite (2013) Chicago (IL), USA (NW study) 328 100 - - - -Shah and Braithwaite (2013) Chicago (IL), USA (CPD
study)
330 101 - - - -Waples et al. (2009) Multiple towns, UK - - 5280
3520 1760 1609 1073 536 -
-Waszkiewicz (2013) Warsaw, Poland 492 150 - - 492 150 Ways and Pearson (2018) Baltimore (MD), USA 264 80 - - 1056 322
Funding Open access funding provided by Malmö University.
Data availability The raw data in the present study are not publicly available due to confidentiality requirements made by the Swedish Police Agency. The aggregated datasets analyzed in the current study are however available from the corresponding author on reasonable request.
Declarations
Ethics approval The case study subject for the present study has been reviewed and approved by the Regional Ethics Board in Lund (ref. 2017/896).
Competing interests The author declares no competing interests.
Open Access This article is licensed under a Creative Commons Attribution 4.0 International License, which permits use, sharing, adaptation, distribution and reproduction in any medium or format, as long as you give appropriate credit to the original author(s) and the source, provide a link to the Creative Commons licence, and indicate if changes were made. The images or other third party material in this article are included in the article's Creative Commons licence, unless indicated otherwise in a credit line to the material. If material is not included in the article's Creative Commons licence and your intended use is not permitted by statutory regulation or exceeds the permitted use, you will need to obtain permission directly from the copyright holder. To view a copy of this licence, visithttp://creativecommons.org/licenses/by/4.0/.
References
Bowers, K. J., & Johnson, S. D. (2003). Measuring the geographical displacement and diffusion of benefit effects of crime prevention activity. Journal of Quantitative Criminology, 19(3), 275–301.
Braga, A. A. (2012). Quasi-experimentation when random assignment is not possible: Observations from practical experiences in the field. In B. C. Welsh, A. A. Braga, & G. J. Bruinsma (Eds.), Experimental criminology: Prospects for advancing science and public policy (pp. 223–252). Cambridge University Press.
Cameron, A., Kolodinski, E., May, H., & Williams, N. (2008). Measuring the effects of video surveillance on crime in Los Angeles. University of Southern California, School of Policy, Planning, and Development. Caplan, J. M., Kennedy, L. W., & Petrossian, G. (2011). Police-monitored CCTV cameras in Newark, NJ: A
quasi-experimental test of crime deterrence. Journal of Experimental Criminology, 7(3), 255–274. Circo, G., & McGarrell, E. (2020). Estimating the impact of an integrated CCTV program on crime. Journal of
Experimental Criminology.https://doi.org/10.1007/s11292-019-09404-y.
Eck, J. E. (2006). When is a bologna sandwich better than sex? A defense of small-n case study evaluations. Journal of Experimental Criminology, 2(3), 345–362.
Farrington, D. P., & Painter, K. A. (2003). How to evaluate the impact of CCTV on crime. Crime Prevention and Community Safety, 5(3), 7–16.
Farrington, D. P., Bennett, T. H., & Welsh, B. C. (2007a). The Cambridge evaluation of the effects of CCTV on crime. In G. Farrell, K. Bowers, S. Johnson, & M. Townsley (Eds.), Imagination for crime prevention: Essays in honour of Ken Pease. Crime Prevention Studies (Vol. 21, pp. 187–201).
Farrington, D. P., Gill, M., Waples, S. J., & Argomaniz, J. (2007b). The effects of closed-circuit television on crime: Meta-analysis of an English national quasi-experimental multi-site evaluation. Journal of Experimental Criminology, 3(1), 21–38.
Gerell, M. (2016). Hot spot policing with actively monitored CCTV cameras: Does it reduce assaults in public places? International Criminal Justice Review, 26(2), 187–201.
Gerell, M. (2017). Smallest is better? The spatial distribution of arson and the modifiable areal unit problem. Journal of Quantitative Criminology, 33(2), 293–318.
Gill, M., & Hemming, M. (2004). Evaluation of CCTV in the London Borough of Lewisham. Perpetuity Research and Consultancy International.
Gomez, S., Mejia, D., & Tobon, S. (2017). The deterrent effect of public surveillance cameras on crime (No. 015295). Universidad de los Andes-Cede. Retrieved November 16, 2020, fromhttps://papers.ssrn.com/ sol3/papers.cfm?abstract_id=2912947.
Guerette, R. T., & Bowers, K. J. (2009). Assessing the extent of crime displacement and diffusion of benefits: A review of situational crime prevention evaluations. Criminology, 47(4), 1331–1368.
Jang, Y., Kim, D., Park, J., & Kim, D. (2018). Conditional effects of open-street closed-circuit television (CCTV) on crime: A case from Korea. International Journal of Law, Crime and Justice, 53, 9–24. King, J., Mulligan, D. K., & Raphael, S. (2008). CITRIS report: The San Francisco community safety camera
program. An evaluation of the effectiveness of San Francisco’s community safety program. University of California Retrieved November 16, 2020, fromhttps://papers.ssrn.com/sol3/papers.cfm?abstract_id= 2183381.
La Vigne, N. G., & Lowry, S. S. (2011). Evaluation of camera use to prevent crimes in commuter parking facilities: A randomized control trial. URBAN Institute Retrieved November 16, 2020, fromhttps://www. ncjrs.gov/pdffiles1/nij/grants/236740.pdf.
La Vigne, N. G., Lowry, S. S., Markman, J. A., & Dwyer, A. M. (2011). Evaluating the use of public surveillance cameras for crime control and prevention. URBAN Institute Retrieved November 11, 2020, fromhttps://cops.usdoj.gov/RIC/Publications/cops-w0614-pub.pdf.
Lim, H., & Wilcox, P. (2017). Crime-reduction effects of open-street CCTV: Conditionality considerations. Justice Quarterly, 34(4), 597–626.
Lim, H., Kim, C., Eck, J. E., & Kim, J. (2016). The crime-reduction effects of open-street CCTV in South Korea. Security Journal, 29(2), 241–255.
Mazerolle, L., Hurley, D. C., & Chamlin, M. (2002). Social behavior in public space: An analysis of behavioral adaptations to CCTV. Security Journal, 15, 59–75.
McLean, S. J., Worden, R. E., & Kim, M. (2013). Here’s looking at you: An evaluation of public CCTV cameras and their effects on crime and disorder. Criminal Justice Review, 38(3), 303–334.
Moon, T., Heo, S., Lee, S., Leem, Y., & Nam, K. (2015). An analysis on the appropriateness and effectiveness of CCTV location for crime prevention. International Journal of Architectural and Environmental Engineering, 9(3), 836–843.
Munyo, I., & Rossi, M. A. (2020). Police-monitored cameras and crime. The Scandinavian Journal of Economics, 122(3), 1027–1044.
Oberwittler, D., & Wikström, P.-O. H. (2009). Why small is better: Advancing the study of the role of behavioral contexts in crime causation. In D. Weisburd, W. Bernasco, & G. J. N. Bruinsma (Eds.), Putting crime in its place: Units of analysis in geographic criminology (pp. 35–59). Springer. Openshaw, S. (1984). The modifiable areal unit problem. Geobooks.
Papazian, J. (2012). Program evaluation of the Denver police HALO camera surveillance system: A geospatial statistical analysis of crime. Masters’ thesis, Duke University.
Park, H. H., Oh, G. S., & Paek, S. Y. (2012). Measuring the crime displacement and diffusion of benefits of open-street CCTV in South Korea. International Journal of Law, Crime and Justice, 40, 179–191. Piza, E. L. (2018). The crime prevention effect of CCTV in public places: A propensity score analysis. Journal
of Crime and Justice, 41(1), 14–30.
Piza, E. L., Caplan, J. M., & Kennedy, L. W. (2014). Analyzing the influence of micro-level factors on CCTV camera effect. Journal of Quantitative Criminology, 30(2), 237–264.
Piza, E. L., Caplan, J. M., Kennedy, L. W., & Gilchrist, A. M. (2015). The effects of merging proactive CCTV monitoring with directed police patrol: A randomized control trial. Journal of Experimental Criminology, 11(3), 43–69.
Piza, E. L., Welsh, B. C., Farrington, D. P., & Thomas, A. L. (2019). CCTV surveillance for crime prevention: A 40-year systematic review with meta-analysis. Criminology & Public Policy, 18(1), 135–159. Prenzler, T., & Wilson, E. (2019). The Ipswich (Queensland) safe city program: an evaluation. Security
Journal, 32(2), 137–152.
Priks, M. (2015). The effects of surveillance cameras on crime: Evidence from the Stockholm subway. The Economic Journal, 125, 289–305.
Ratcliffe, J. H., & Breen, C. (2011). Crime diffusion and displacement: Measuring the side effects of police operations. The Professional Geographer, 63(2), 230–243.
Ratcliffe, J. H., & Groff, E. R. (2019). A longitudinal quasi-experimental study of violence and disorder impacts of urban CCTV camera clusters. Criminal Justice Review, 44(2), 148–164.
Ratcliffe, J. H., Taniguchi, T., & Taylor, R. B. (2009). The crime reduction effects of public CCTV cameras: A multi-method spatial approach. Justice Quarterly, 26(4), 746–770.
Rengert, G. F., & Lockwood, B. (2009). Geographical units of analysis and the analysis of crime. In D. Weisburd, W. Bernasco, & G. J. N. Bruinsma (Eds.), Putting crime in its place: Units of analysis in geographic criminology (pp. 109–122). Springer.
Robin, L., Peterson, B. E., & Lawrence, D. S. (2020). Public surveillance cameras and crime. Retrieved November 11, 2020, from https://www.urban.org/sites/default/files/publication/101649/public_ surveillance_cameras_and_crime.pdf.
Shadish, W. R., Cook, T. D., & Campbell, D. T. (2002). Experimental and quasi-experimental designs for generalized casual inference. Wadsworth Cengage Learning.
Shah, R., & Braithwaite, J. (2013). Spread too thin: Analyzing the effectiveness of the Chicago camera network on crime. Police Practice and Research, 14(5), 415–427.
Tita, G. E., & Radil, S. M. (2010). Making space for theory: The challenges of theorizing space and place for spatial analysis in criminology. Journal of Quantitative Criminology, 26(4), 467–479.
Vilalta, C. J., Sanchez, T. W., Fondevila, G., & Ramirez, M. (2019). A descriptive model of the relationship between police CCTV systems and crime. Evidence from Mexico City. Police Practice and Research, 20(2), 105–121.
Waples, S., Gill, M., & Fisher, P. (2009). Does CCTV displace crime? Criminology & Criminal Justice: An International Journal, 9(2), 207–224.
Waszkiewicz, P. (2013). How effective is the public video surveillance system in Warsaw? In F. Bjorklund & O. Svenonius (Eds.), Video surveillance and social control in a comparative perspective (pp. 153–170). Routledge.
Ways, B., & Pearson, B. C. (2018). Assessing the usefulness of CCTV in Baltimore City, Maryland. Journal of Strategic Innovation and Sustainability, 13(5), 127–140.
Weisburd, D., & Green, L. (1995). Policing drug hot spots: The Jersey City drug market analysis experiment. Justice Quarterly, 12(4), 711–735.
Weisburd, D., Bruinsma, G. J. N., & Bernasco, W. (2009). Units of analysis in geographic criminology: Historical development, critical issues, and open questions. In D. Weisburd, W. Bernasco, & G. J. N. Bruinsma (Eds.), Putting crime in its place: Units of analysis in geographic criminology (pp. 3–31). Springer.
Welsh, B. C., & Farrington, D. P. (2009). Public area CCTV and crime prevention: An updated systematic review and meta-analysis. Justice Quarterly, 26(4), 716–745.
Welsh, B. C., Peel, M. E., Farrington, D. P., Elffers, H., & Braga, A. A. (2011). Research design influence on study outcomes in crime and justice: A partial replication with public area surveillance. Journal of Experimental Criminology, 7(2), 183–198.
Wheeler, A. P., & Ratcliffe, J. H. (2018). A simple weighted displacement difference test to evaluate place based crime interventions. Crime Science, 7(1), 11.
Publisher’s note Springer Nature remains neutral with regard to jurisdictional claims in published maps and institutional affiliations.
Karl Kronkvist is a PhD student at the Department of Criminology, Faculty of Health and Society, of Malmö University, Sweden. His main areas of research interest relate to the criminology of place, place-based crime prevention, (situational) fear of crime, and methodological development pertaining to these research areas.