Department of Science and Technology Institutionen för teknik och naturvetenskap
Linköping University Linköpings universitet
g n i p ö k r r o N 4 7 1 0 6 n e d e w S , g n i p ö k r r o N 4 7 1 0 6 -E S
LiU-ITN-TEK-A-16/006--SE
Application of Road
Infrastructure Safety
Assessment Methods at
Intersections
Adeyemi Adedokun
2016-03-07
LiU-ITN-TEK-A-16/006--SE
Application of Road
Infrastructure Safety
Assessment Methods at
Intersections
Examensarbete utfört i Transportsystem
vid Tekniska högskolan vid
Linköpings universitet
Adeyemi Adedokun
Handledare Ghazwan Al Haji
Examinator Anders Peterson
Upphovsrätt
Detta dokument hålls tillgängligt på Internet – eller dess framtida ersättare –
under en längre tid från publiceringsdatum under förutsättning att inga
extra-ordinära omständigheter uppstår.
Tillgång till dokumentet innebär tillstånd för var och en att läsa, ladda ner,
skriva ut enstaka kopior för enskilt bruk och att använda det oförändrat för
ickekommersiell forskning och för undervisning. Överföring av upphovsrätten
vid en senare tidpunkt kan inte upphäva detta tillstånd. All annan användning av
dokumentet kräver upphovsmannens medgivande. För att garantera äktheten,
säkerheten och tillgängligheten finns det lösningar av teknisk och administrativ
art.
Upphovsmannens ideella rätt innefattar rätt att bli nämnd som upphovsman i
den omfattning som god sed kräver vid användning av dokumentet på ovan
beskrivna sätt samt skydd mot att dokumentet ändras eller presenteras i sådan
form eller i sådant sammanhang som är kränkande för upphovsmannens litterära
eller konstnärliga anseende eller egenart.
För ytterligare information om Linköping University Electronic Press se
förlagets hemsida
http://www.ep.liu.se/Copyright
The publishers will keep this document online on the Internet - or its possible
replacement - for a considerable time from the date of publication barring
exceptional circumstances.
The online availability of the document implies a permanent permission for
anyone to read, to download, to print out single copies for your own use and to
use it unchanged for any non-commercial research and educational purpose.
Subsequent transfers of copyright cannot revoke this permission. All other uses
of the document are conditional on the consent of the copyright owner. The
publisher has taken technical and administrative measures to assure authenticity,
security and accessibility.
According to intellectual property law the author has the right to be
mentioned when his/her work is accessed as described above and to be protected
against infringement.
For additional information about the Linköping University Electronic Press
and its procedures for publication and for assurance of document integrity,
please refer to its WWW home page:
http://www.ep.liu.se/Abstract
Traffic safety at intersections is a particularly difficult phenomenon to study, given the fact that accidents occur randomly in time and space thereby making short-term measurement, assessment and comparison difficult. The EU directive 2008/96/EC introduced road infrastructure safety management, which offers a five layer structure for developing safer road infrastructure has been used to develop tools for accident prediction and black spot management analysis which has been applied in this work to assess the safety level of intersections in Norrköping city in Sweden.
Accident data history from STRADA (Swedish Traffic Accident Data Acquisition) and the network demand model for Norrköping city were used to model black spots and predict the expected number of accidents at intersections using PTV Visum Safety tool, after STRADA accident classification was restructured and the Swedish accident prediction model (APM) was configured and tested to work within the tool using the model from the Swedish road administration (SRA). The performance of the default (Swiss) and the Swedish APM was compared and identified locations with the high accident records, predicted accident counts and traffic volumes were audited using qualitative assessment checklist from Street-Audit tool. The results from these methods were analysed, validated and compared. This work provides recommendations on the used quantitative and qualitative methods to prevent accident occurrence at the identified locations.
Keywords: Accident Prediction Models, Black Spot Management, Intersections, PTV Visum
Abstrakt
Trafiksäkerheten i korsningar är en särskilt svår fenomen att studera, med tanke på att olyckor inträffar slumpmässigt i tid och plats vilket gör kortsiktiga mätning, utvärdering och jämförelse svår. EU-direktivet 2008/96/EC infördes säkrare vägar, som erbjuder en fem lager struktur för att utveckla säkrare väg infrastruktur. Den struktur har använts för att utveckla verktyg för att förutsäga olyckor och göra analys av tillfälliga platser där det inträffat många olyckor, så kallade ”blackspots”. Verktyget har använts i detta arbete för att bedöma säkerheten nivå av utvalda korsningar i Norrköping i Sverige.
Olycksdatahistorik från STRADA (Swedish Traffic Accident Data Acquisition) och modell nätverks efterfrågan på Norrköping användes för att modellera blackspots och förutsäga det förväntade antalet olyckor i korsningar med hjälp av PTV Visum säkerhetsverktyg, efter STRADA klassificering olycka om strukturerades och svenska förutsägelse olycka modell (accident prediction model APM) har konfigurerats och testats för att arbeta i verktyget med hjälp av modellen från trafikverket. Utförandet av standard (Schweiz) och de svenska APM och identifierade platser med posterna hög olycks, förutspådde olycks räknas och trafikvolymer granskades med hjälp av checklista kvalitativ bedömning från Street-Audit verktyg. Resultaten från dessa metoder analyserades, valideras och jämföras. Detta arbete ger rekommendationer om de använda kvantitativa och kvalitativa metoder för att förebygga uppkomsten olyckan vid de identifierade platser.
Acknowledgement
My first gratitude goes to my God, who has granted me this privilege and has kept me up to this time of my life. I would like to appreciate my supervisor Al-Haji Ghazwan, and my examiner Anders Peterson, for their relentless support during the course of this thesis work. I would like to appreciate Hans Johansson of STRADA for his help and support with the database, as well as Jörgen Larsson of VTI for making out time to share some insights about his work. I would like to thank PTV Visum Safety Product Manager, Karsten Kremer for his prompt responses and dedicated support during the reconfiguration process of the software. My gratitude goes to other LiU personnel like Maria Eriksson and Lars Kjellin of the IT department for their support during the software testing and validation. To everyone that has played an active role in my life since this journey began and to the good friends I have made over the months like Marc Feucht, Erfan Aria, Tao Peng, Erik Rudhe, Wade Tong and Eliot Gomez to mention a few, thank you all for effortlessly playing your roles in this success. I would like to thank my family for their spiritual and moral support, especially Aderemi Adedokun who has financially supported me throughout the course of this degree pursuit. Finally, I would like to appreciate Mosunmola Ayeni for her daily support and understanding despite the thousands of
Table of Contents
1 BACKGROUND ... 1 1.1 Aim... 2 1.2 Limitations ... 2 1.3 Methodology ... 2 1.4 Outline ... 3 2 THEORETICAL FRAMEWORK ... 4 2.1 Intersections ... 42.1.1 Intersection Traffic Conflict ... 4
2.1.2 Intersection Accident trends ... 5
2.1.3 Safety of Intersection Design Elements ... 6
2.2 European Traffic Safety Directive ... 8
2.2.1 Road Safety Impact Assessment (RIA) ... 9
2.2.2 Road Safety Audit (RSA) ... 9
2.2.3 Road Safety Inspection (RSI) ... 10
2.2.4 Black Spot Management (BSM) ... 10
2.2.5 Network Safety management (NSM) ... 11
3 ACCIDENT PREDICTION MODELS ... 12
3.1 Definition ... 12
3.2 Accident Prediction Model forms ... 12
3.3 Evaluation of goodness of fit ... 13
3.4 Accident Prediction Models (APM) for Urban Intersections ... 14
3.4.1 Model 1 ... 14
3.4.2 Model 2 ... 15
3.5 Swedish Model ... 16
4 BLACK SPOT MANAGEMENT (BSM) ... 18
4.1 Definitions and Philisophy ... 18
4.2 Stages in BSM ... 19
4.3.1 Austria ... 20 4.3.2 Denmark ... 21 4.3.3 Flanders ... 21 4.3.4 Germany ... 21 4.3.5 Hungary ... 22 4.3.6 Norway ... 22 4.3.7 Portugal ... 22 4.3.8 Switzerland ... 23 4.3.9 Sweden ... 23
4.4 Black Spot Identification Principles ... 23
4.4.1 General recommendation ... 23
4.4.2 State-of-the-art Approach ... 25
5 SOFTWARE AND DATABASE REVIEW ... 27
5.1 PTV Visum Safety ... 27
5.2 Street-Audit ... 29
5.2.1 Intersection Review ... 29
5.2.2 Scoring system ... 31
5.3 STRADA ... 31
5.3.1 Injury severity (Svårhetgrad) ... 32
5.3.2 Accident type (Olyckstyp) ... 32
6 CASE STUDY ... 33
6.1 Introduction ... 33
6.2 Data description and collection ... 36
6.2.1 STRADA ... 36
6.2.2 Network model for Norrkoping ... 36
6.2.3 Cyclist and Pedestrian Flow ... 37
6.3 Procedure ... 37
7 RESULTS AND DISCUSSION ... 39
7.1 STRADA compatibility and usability ... 39
7.2 Black Spot identification with historic data ... 39
7.3 Prediction models ... 41
7.3.1 The Swedish model and the Swiss (default) model... 41
7.4 State-of-the art Black Spot identification ... 44
7.5 Qualitative assessment ... 47
7.5.1 Performance ... 54
8 CONCLUSION AND RECOMMENDATION ... 56
REFERENCES ... 58
List of Figures ... 63
List of Tables ... 64
List of abbreviation ... 65
A: Regression coefficients for 3 and 4-way intersections 40-50km/h ... 66
B: Regression coefficients for 3 and 4-way intersections 60-70km/h ... 66
C: Regression coefficients for 3 and 4-way intersections 80, 90, 100 or 110km/h ... 67
1
1
Background
Road accident statistics in Europe stress the need for more systematic mechanisms for accident analysis and prediction. According to the World Health Organization road accidents constitute one of the leading cause of death for people between the ages of 15 – 44 (Kapp, 2003). Given the current trends, accident fatalities are projected by 2020 to become the fifth leading cause of death world-wide resulting in an estimated 2.4 million deaths each year (W.H.O, 2011). At the same time, traffic accidents result in high economic losses due to traffic congestion which in turn leads to a wide variety of adverse consequences such as, traffic delays, supply chain interruptions, travel time unreliability, increased noise pollution, as well as deterioration of air quality. To combat these and the intrinsic accident risks, road safety has emerged as a priority alongside road safety management and forecasting practices (Gregoriades & Kyriacos, 2013). Conflicts are a fact of life at intersections and this accounts for high accident rates especially for vulnerable road users (VRUs) at intersections. A large proportion of traffic accidents that occur on the Swedish road networks are at intersection. In 2002, there were 3564 accidents at 3-leg intersections, which resulted in 82 fatalities, 730 serious injuries and 2752 minor injuries. At 4-leg intersections, 3223 accidents were recorded, which resulted in 57 fatalities, 584 serious and 2582 minor injuries. On the other hand, there were 435 accidents at roundabout, which resulted in 5 fatalities, 68 serious and 362 minor injuries. In 2013, 22.5% of the total accidents, 13.8% of the fatalities and 23.4% of the serious/light injuries recorded occurred at the intersection (Trafikanalys, 2013). To further understand the depth of the problem at the European level, study report shows that accidents at intersections represent 43% of road injury accidents in EU-27 (Molinero Martinez, et al., 2007).
Over the years, effort has been intensified across Europe. The European Parliament and Council of the European Union adopted the 2008/96/EC directive in 2008 on road
infrastructure safety assessment, as recognised in the “Time to Decide” white paper (European
Parliament, 2008). The directive devised a five tier structure for developing safer road infrastructure, which are: Road Safety Impact Assessment (RIA), Road Safety Audits (RSA), Road Safety Inspection (RSI), Black Spot management (BSM) and Network Safety Management (NSM).
Based on this five tier road infrastructure safety assessment structure, PTV Vision has created Visum Safety (Hoffman, 2014), for the purpose of identification of network black spots and prediction of future accident nodes and links within a transport network as a quantitative assessment method which includes RIA, BSM and NSM. On the other hand, TRL has also developed the Street-Audit tool for RSA and RSI, which is a qualitative assessment method and completes the five tier structure. It is therefore interesting to find out the performance of these tools with data from Sweden. For the reason of data accessibility and availability, as well as intersection accident statistics, the application of these quantitative and qualitative tools at are therefore explored in this work using intersections in Norrkoping city as a case study.
2
1.1
Aim
The aim of this work is to investigate how the application of road infrastructure safety assessment methods, can improve traffic safety measurement and assessment. Intersections in Norrköping city were chosen as the case study due to the city’s intersection accident statistics and growing demand for road transport.
To achieve this aim, the following questions would be investigated;
How compatible is STRADA with international modelling tools? What is the current black spot identification standard in Sweden?
How does the default APM within Visum Safety compare to the Swedish APM? What is the performance of the state-of-the-art black spot identification method? What are the effects of applying qualitative assessment method at the identified
locations?
How does the road infrastructure safety methods contribute to the safety level of
intersections in Norrköping?
1.2
Limitations
1. The Visum network model for Norrköping is poorly developed and not up-to-date. It contains only vehicle mode of transport, and all intersections are represented as one node which reduces the accuracy of the prediction.
2. Data of pedestrian and cyclist ADT using each intersection within the city is unavailable.
3. Network safety management which deals with road stretches and links is briefly discussed but not the area of focus in this work. Therefore, prediction on links and road stretches are excluded.
4. Accident cost, accident severity and property damage calculations are not included in this work, as the data is not readily available in the accident database.
1.3
Methodology
Accident Prediction Models (APM) as a proactive and quantitative safety measure, is a Road Safety Impact Assessment (RIA) method. This makes the procedure important to forestall accident black spots before they start to form, saving lives and resources. Black Spot Management on the other hand is a reactive and qualitative safety measure, where historical crash data is used to identify locations with high accident frequency, analyse the contributing factors and find counter measures. These two methods listed shall be implemented using Visum Safety tool. Qualitative assessment checklists within Street-Audit tool shall also be used for the assessment of the identified locations with high predicted accidents.
Historical accident data from STRADA for Norrkoping city from January 2010 to July 2015 which contains geocoded location of accidents and other attributes, will be used with the demand network model of the city, which contains the city road network, capacity, speed and ADT. In combination with OSM within application, accident details are imported and allocated to their corresponding locations in the network model. Intersections with high recorded accident will be identified using heat map. Future accident scenario will first be predicted,
3
using the default prediction model and its regression coefficients. The Swedish APM and its regression coefficients will also be applied and their results shall be compared. A state-of-the-art approach for blackspot identification will then be applied to both prediction models and their results would be compared. A qualitative analysis will be performed at identified and selected locations.
Input data source
Below is the list of data used in this work and their sources.
1. Historic accident data for Norrkoping city sourced from STRADA.
2. Visum network model which contains the city road network and the volume of passing vehicles per day. This data is sourced from Traffic Infrastructure course at the university.
3. The volume of cyclists and pedestrians using the intersections per day will be manually gathered at the identified location.
1.4
Outline
Chapter 1 introduces the background of information on European road accident statistics, the consequences of conflicts at intersections in Sweden and development efforts on traffic safety that led to the development of the methods applied in this work. It also highlights the aim of the work and the objectives to achieve the aim, as well as the limitations, data source and methodology.
Chapter 2 details the theoretical framework for the work, discussing intersections and its accident trends with some safety design elements. European traffic safety policy is also discussed, with focus on the 2008/96/EC directive on road infrastructure safety management and its five tier structure.
Chapter 3 gives a detailed information about APM forms, evaluation of goodness of fit, models for urban intersections that has been developed and tested in other countries, including the Swedish prediction model.
Chapter 4 focuses on BSM. It starts out with definitions and philosophy, and then to stages in BSM, current identification methods in some European countries including Sweden, and best practice guidelines. Recommended identification principles is latter discussed which covers the general recommendations and the state-of-the-art approach.
In chapter 5, software and database review is done. The main tool used in this work namely PTV Visum Safety is discussed, as well as the qualitative assessment checklist from TRL Street-Audit. STRADA database review is also discussed.
Chapter 6 is about the case study. It gives more details about Norrköping city, its demand and supply as well as a justification for this work. The input data collection process was also discussed and the procedure followed is highlighted
In chapters 7, the results achieved in this work is discussed while chapter 8 discusses the recommendations and conclusions from the results.
4
2
Theoretical Framework
The theoretical frame work for this work is laid in this chapter with a brief introduction into intersections, its accident trends and some safety design parameters. The European directive which is the foundation of this work is discussed.
2.1
Intersections
The American Association of State Highway and Transportation Officials (AASHTO) defines
intersections, as ‘the general area where two or more highway join or cross, including the roadway and roadside facilities for traffic movements within the area’, with the main objective of their design to ‘facilitate the convenience, ease, and comfort of people traversing the
intersection while enhancing the efficient movement of motor vehicles, buses, trucks, bicycles and pedestrians (AASHTO, 2010). Within these broad descriptions, specific designs of individual intersections can vary greatly from location to location based on the alignment and functional classification of the intersection roadways, the type and amount of expected traffic, and the land use characteristics in the vicinity of the intersection among many others. Despite the number of factors that can influence intersections, the design goal is always the same; maximize both the efficiency and safety of traffic operations within the intersection (Wolshon, 2004).
2.1.1 Intersection Traffic Conflict
Conflicts are a fact of life at intersections, eventhough they can often be eliminated or relocated using various geometric and control measures (Wolshon, 2004). It is an observable situation in which two or more road users approach each other in space and time to an extent of collision risk if their movements remains unchanged (Svensson, 2007).
A conventional 4-leg, 3-leg and roundabout intersection creates a total of 32 points, 9 points and 8 points of conflict respectively, between the various through and turning movements. These conflict points are classified into one of three different types: crossing, merging and diverging. Crossing conflicts occur at locations where vehicle travel paths cross one another, merging conflicts occur where vehicles from one traffic streem enter into another, and diverging are located at points in which vehicles depart a traffic stream. Generally, crossing conflicts are the most hazatdous because the crashes associated with them often occur at angles more severe tham merging and diverging related crashes, and the speed differential of the conflicting vehicles (such as left turn angle crashes) can be more pronounced than the other conflicts (Wolshon, 2004).
However, traffic conflict is categorized according to intersection types by (Ge, 2011) as below:
Left-Turning conflict: This happens at unsignalized intersections between a left-turning
vehicle and a through vehicle traveling on the cross street.
Crossing conflict: This often happens at both unsignalized and signalized intersection,
between a through vehicle and another through vehicle traveling on the cross street.
Rear-End conflict: This often happens at signalized intersections between two vehicles
5
between the two vehicles, especially when the front vehicle suddenly apply brakes or slows down.
Right-Turn conflict: This often happens at both signalized and unsignalized
intersection, between a right-turning vehicle and a through vehicle. The reason for this conflict may include high volume of right-turning vehicles.
Weaving conflict: This conflict often happens at oth unsignalized and signalized
intersection between two vehicles traversing on different lanes. Conflict occurs when one of the vehicles changes lane to that of the front vehicle.
Pedestrian conflict: This type of conflict happens between vehicles and pedestirnas
crossing the intersection. It often happens at unsignalized intersections, wher pedestrian volume is high and at signalized intersections where pedestrians and turning vehicle volumes are both high.
2.1.2 Intersection Accident trends
In United States, a report shows that in 2008, about 55% of all total crashes and 57% of total fatal/injury crashes happened at intersection areas (Ge, 2011). Another report from Florida shows that in 2003, 96 710 accidents occurred at intersection, which resulted in 929 fatalities and 107 429 injuries (Abdel-Aty, et al., 2006). Between 2003 and 2007, crashes at junctions represent about 60% of all crashes with 44% intersections (intersection and intersection-related), and fatalities in crashes occurring at intersections account for slightly more that 20% of all motor vehicle traffic fatalities in the US every year.
In Canada, report from 2002-2004 shows that an average of 809 persons were killed and 7 996 persons were seriously injured per year in intersection related accidents. This translates to 29% of all fatalities and 43% of all serious injuries originating from road accident at intersections (Molinero Martinez, et al., 2007).
Crash data over a decade in Australia suggests that intersections are associated with a higher level of crash risk than with other parts of the road network, largely due to the threatening angles of impact and high collision speeds which they accommodate, and has left approximately 100 000 Australians injured or killed in Victoria alone. (Corben, et al., 2010). Accidents at intersections represent 43% of road injury accidents in EU27, which is largely due to countries such as UK, Czech Republic, Italy, Denmark and Netherlands, with the rate varying between 47% and 59%, with 21% fatalities and 32% fatalities and serious injuries. Molinero Martinez, et al. (2007) shows that in France, 84 318 injury accidents occurred in 2004. 27% of injury accidents happened at intersections and resulted in 15 % of the fatalities and 27 % of the severely and slightly injured. Intersection accidents happened mainly in urban areas (80%) but the severity is lower (42% of the fatalities in intersections occurred in urban areas). Of the injury accidents at intersection, 23% involved at least one passenger car and resulted in 10 % of all fatalities. Same report shows that the German Federal Statistical Office identifies that overall 34% of accidents happen at intersections. In Spain, 34% of injury accidents occurred at intersection. Austrian statistics show 32% of all accidents occurring at intersection while Switzerland counts 24%. In Sweden, a large proportion of traffic accidents that occur on the Swedish road networks are at intersection. In 2002, there were 3 564 accidents at 3-leg intersections, which resulted in 82 fatalities, 730 serious injuries and 2752 minor injuries. At 4-leg intersections, 3 223 accidents were recorded, which resulted in 57 fatalities,
6
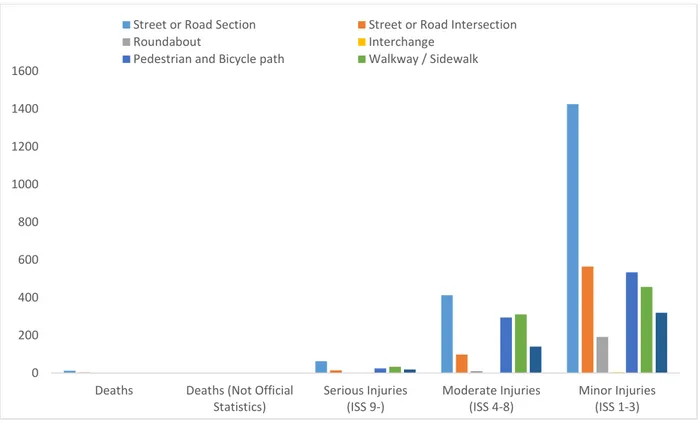
584 serious and 2 582 minor injuries. On the other hand, there were 435 accidents at roundabout, which resulted in 5 fatalities, 68 serious and 362 minor injuries (Ge, 2011). Figure 2.1 shows the analysis of the Swedish road accident by road type in 2013 involving a total of 2
488 accidents while intersection claimed the second highest value with 561 accidents (22.5%), 36 fatalities and 525 injuries.
Figure 2.1: Swedish Road Traffic Accidents by road type with fatal and severe personal injury in 2013
2.1.3 Safety of Intersection Design Elements
The main objective of intersection design is to reduce the number and severity of potential conflicts between road users: motorists (cars, trucks, and buses), cyclists and pedestrians. Various references have suggested the objectives, principles, and guidelines that should be considered when designing intersections. Brüde, et al. (1998) and Wolshon (2004) confirms that the following elements have to be considered in the design of intersections, which are the factors that make-up the Street-Audit checklist discussed in section 5.2. These elements are introduced as follows;
Sight Distance
Sight Distance is a critical design feature for intersections, which facilitates safe movements around the intersection area. Intersection sight distance must be sufficient for drivers to anticipate and avoid potential conflicts with crossing and merging traffic stream. Thus, the dimensions of obstruction-free envelops are a function of the physical conditions around the intersection, driver behaviour, design speeds, and acceleration-deceleration distances (Wolshon, 2004).
The stopping sight distance depends on the speed of the vehicle. It is the distance travelled from the point where driver sees a hazard to the point where he can safely stop by braking. A
0 200 400 600 800 1,000 1,200 1,400 1,600 1,800 Road Stretch Intersection Interchange Roundabout Others
7
reaction time of 1.5 – 2.0 seconds is considered normal and a deceleration of 3.0 – 4.0 m/s2 is considered as safe braking (Brüde, et al., 1998).
David & Norman (1975) studied the relationship between the accident rate and various intersection geometric and traffic features in the United States. They found significant accident
rate difference between ‘obstructed’ and ‘clear’ intersections for various levels of sight distance
restriction. In another study, Wu (1973) investigated the relationship between the accident rate
and what the termed ‘clear vision right-of-way’ at 1λ2 signalized intersections. The study
concluded that intersections where vision is poor have significantly higher injury, property damage and total accident rates.
Horizontal Alignment
The Horizontal Alignment of an intersection is a direct reflection of the alignment of the approaching roads. Since roads that intersect at acute angles can make it difficult for drivers to see traffic approaching on some of the crossing legs, create problems for large vehicle turning movements, and extend both the time and distace required to cross the intersecting highway, it is strongly recommended that intersecting roadways should cross at or very bear right angles (Wolshon, 2004).
It is widely accepted that the preferred angle of intersecting legs at an intersection is 90 degrees (Arndt & Troutbeck, 1995). For roundabouts, as the angle between an arm and the next arm increases, the accident frequency decreases (Maycock & Hall, 1984); this is because the entering-circulating interaction becomes less of a crossing conflict and more a merger. However, the angle between the roundabout arms is a relatively minor accident variable. Channelization
This is a design technique used to simplify movements, increase capacity, and improve safety within the vicinity of an intersection. It accomplishes these by relocating and eliminating points of conflict and separating and restricting vehicular and pedestrian movements into specific and clearly defined paths. It can be accomplished in several ways including using islands, median, and various traffic control devices including flush-level pavement markings where it is not possible to use an island.
It is widely accepted that intersetion channelization is beneficial. However, Hedman (1990) reporting Swedish accident studies on rural two lane roads, stated that traffic islands in the secondary road have been shown to reduce accidents at 4-way intersection by some 10 percent, but seem not to have any significant effect at 3-way intersections. Also the safety effects of central turning lanes on the primary road seem to depend on whether the channelization was achieved by raised curbstones or by road markings; in many cases curbstone islands resulted in more severe accidents, especially at 4-way intersections.
Approach Speed / Intersection Speed Limit
It is generally accepted that hazard of at-grade intersections increases as the approach speed increases (TRB, 1984). Following a study of roundabout accidents in Australia, Arndt & Troutbeck (1995) suggested that the decrease in 85th percentile speeds between successive geometric elements is an important parameter when designing intersection approaches in high speed environments; they suggested that this is best achieved by using a series of reducing radii horizintal curves. For single vehicle accidents on roundabouts, they suggested that a maximum
8
allowed decrease in 85th percentile speed of 20 km/h between successive geometric elements would achieve a balance between safety and construction costs.
2.2
European Traffic Safety Directive
One of the key activities of the European Commission is transportation, because free movement of people and goods is considered as a major issue within the European countries. The
Commission, in its White Paper titled ‘Time to Decide’, published in September 2001
recognized the insufficiency of their actions and transport policy aimed at improving the road traffic safety situation, and therefore proposed the European Road Safety Action Programme for 2003 – 2010 (European Commission, 2001). The overall objective of the programme is to half the number of killed people in traffic by year 2010.
In 2008, the European Parliament and the Council of the European Union adopted the directive 2008/96/EC on road infrastructure safety management (European Parliament, 2008). This directive is also based on the need expressed in the ‘Time to Decide’ white paper; to carry out safety impact assessments and road safety audits, in order to identify and manage high accident concentration sections within the European community. The road safety impact assessment would demonstrate, on a strategic level, the implications on road safety of different planning alternatives of an infrastructure project, while road safety audits would identify, in a detailed safe way, unsafe features of a road infrastructure project. This directive led to several joint European research and development projects such as SAFESTAR (Safety Standards for Road Design and Redesign), RISMET (Road Infrastructure Safety Management Evaluation Tools), RIPCORD – iSEREST (Road Infrastructure Safety Protection – Core Research Development for Road Safety in Europe and Increasing Safety and Reliability of Secondary Roads for Sustainable Surface Transport) and much more, which has given both scientific and technical support to the definition and operation requirements of the directive. The developments from the several research projects of this directive is the foundation of this thesis work.
The directive devised a five tier structure for developing safer road infrastructure, and these arms are designed to be complementary and derived from the Ripcord-iSerest Project on Road Safety as the following topics:
Road Safety Impact Assessment (RIA) Road Safety Audits (RSA)
Road Safety Inspection (RSI) Black Spot management (BSM) Network Safety Management (NSM)
Two of the above listed elements address exiting roads – the Road Safety inspection and Black
Spot management, which are predominantly ‘reactive’ measures. On the other hand, Road
Safety Impact Assessment and Road Safety Audit are designed to address safety conditions
with the development of new roads, which are ‘proactive’ measures for prevention of accident
occurrence. Network Safety Management explores issues relating to both topics of current and future road development and management (Laufer, 2014).
These tiers are further discussed below as excerpts from the RiPCORD-iSEREST (2007) project result. More information about the tiers is available in the report.
9
2.2.1 Road Safety Impact Assessment (RIA)
According to a work package led by SWOV (RiPCORD-iSEREST, 2007), decisions made on large road projects or new road schemes play an important role in their impact on road safety. Road safety impact assessment (RIA) means a strategic comparative analysis of the impact of a new road or a substantial modification to the existing network on the safety performance of the road network and can help to identify the likely safety effects of different proposed road or
traffic schemes (‘variants’), or policy actions (e.g. changing speed limits). It usually covers the
whole road network which is affected by the measure. The use of RIA is non-uniform. It can concentrate on one single project, and can in this way base on expert opinion, literature, traffic models including risk factors or accident prediction models and traffic models including cost-benefit modules.
SWOV noted that for assessing the impact of plans with a wider scope on regional or national networks like a road safety plan or transport master plan, a RIA can consist of different steps:
a description of the current (present) situation (traffic volumes, safety levels)
a prediction of the future situation (traffic volumes) without measures (using present
safety levels)
determination of the effects of the measure based on known effects of measures and the
expected degree of implementation
calculation of cost-benefit rations
optimizing plans according to available budgets or desired safety impacts.
2.2.2 Road Safety Audit (RSA)
The EU directive 2008/96/EC defines Road Safety Audit (RSA) is an independent detailed systematic and technical safety check relating to the design characteristics of a road infrastructure project and covering all stages from planning to early operation.
BASt (RiPCORD-iSEREST, 2007) documented that whenever road authorities plan new roads or whenever an existing road has to be redesigned due to change of local conditions, the road designers have to consider a number of different aspects and interests in their schemes which have an effect on the design itself.
Several reasons like cost, environmental restrictions, and political restraints sometimes force designers to make compromises which do not always lead to a design with the highest level of safety. Road safety aspects are mostly implicitly considered in the design standards and existing approval procedures usually checks for compliance with design standards only. The main advantage of RSA therefore is that road authorities can take appropriate remedial measures before accidents happen. Furthermore, a treatment of deficits before traffic opening can avoid expensive and time consuming changes to existing road infrastructure.
Usually, RSAs are carried out during the planning and design phase of a road project until early operation as in the steps below;
During the feasibility (planning) stage At the preliminary design stage In the detailed design stage
10 Shortly before the road is opened to traffic, Auditors inspect the sites
Shortly after the road has been opened to traffic, Auditors check if the road users make
use of the road as intended.
Results of the Rosebud (Road Safety and Environmental Benefit-Cost and Cost-Effectiveness Analysis for Use in Decision-Making) project as well as other international studies made in the UK, Denmark and Australia regarding the effects and benefits of RSAs generally show that conducting audits is inexpensive but highly effective.
2.2.3 Road Safety Inspection (RSI)
Road Safety Inspection (RSI) is defined by the EU Directive as an ordinary periodical verification of the road network characteristics and defects that require maintenance work for safety reasons. RSIs are increasingly used as part of road safety management.
KfV (RiPCORD-iSEREST, 2007) defines RSI as a systemic assessment of the safety standard of an existing road, in particular with respect to hazards related to traffic signs, roadside features, environmental risk factors and road surface conditions. The objective of a road safety inspection is to identify traffic hazards and suggest measures to correct these hazards.
RSI is, to a large extent, based on similar checklists and procedures as those applied in road safety audits. Road Safety Audits are applied during the planning of new roads, whereas Road Safety Inspections are carried out on existing roads.
2.2.4 Black Spot Management (BSM)
The EU Directive referred to Black Spot Management (BSM) as ‘Ranking of high accident concentration sections’, and defined it as a method to identify, analyse and rank sections of the
road network which have been in operation for more than three years and upon which a large number of fatal accidents in proportion to the traffic flow have occurred.
According to TØI (RiPCORD-iSEREST, 2007), black spots are also referred to as hazardous road locations, hot spots or sites with promise. No standard definition exits of black spot. However, from a theoretical point of view black spots should be defined as any location that:
has a higher expected number of accidents, than other similar locations,
as a result of local risk factors.
In practice, black spots are in most cases identified in terms of the recorded number of accidents. Identification in terms of the expected number of accidents is to be preferred, as this accounts for sources of systematic variation in the number of accidents and controls for random variation.
BSM can be divided into 9 stages as in Table 1.
1. Data Collection Collection of data on roads, traffic and accidents
2. Dividing Dividing the road network into different road elements and sections 3. Identification Ranking and identification of black spots/hazardous road sections 4. Analysis In-office and on-site analysis of accidents
11
6. Pre-evaluation Pre evaluation pf proposed treatment
7. Ranking Ranking of projects and location of treatment 8. Implementation Implementation and operation of treatment
9. Post-evaluation Before-and –after evaluation of effect of treatment
Table 1: Typical stages in BSM (RiPCORD-iSEREST, 2007)
2.2.5 Network Safety management (NSM)
The EU directive defines Network Safety Management (NSM), as a method for identifying, analysing, and classifying parts of the existing road network according to their potential for safety development and accident cost savings.
TØI (RiPCORD-iSEREST, 2007) documented that in the last 5 to 10 years, several of the safest countries have supplemented or even replaced the traditional black spot management (BSM) with network safety management (NSM), which is identification and treatment of hazardous road sections.
Like black spots, no international standard definition of hazardous road section exists. However, the following definition is recommended. A hazardous road section is any section with a length between 2 and 10 kilometres that:
has a higher expected number and severity of accidents, than other similar road sections,
as a result of local and section based accident and injury factors.
12
3
Accident Prediction Models
Safety predictions are needed for two main purposes (Hauer, 2010):
1. To set policy targets. For this purpose one needs to predict what should be the future safety of the unit (can be a state, a region, a city a road section, drivers of an age cohort, trucks of some type, etc.) if the policy or programs will not be implemented. Safety targets are then set on this basis.
2. To estimate that was the effect a policy, program, or treatment on the safety of the unit. For this purpose too, one need to predict what would have been the safety of the unit had the policy, program or treatment not been implemented.
The difference between the two circumstances is one of timing; for the target setting, prediction is produced before the program or policy is implemented whereas for the effect estimation, the prediction is produced after the intervention was implemented.
Several research projects has been concluded with quality research result on the topic. This chapter is therefore based on the result of the report from Reurings, et al. (2005).
3.1
Definition
An Accident Prediction Model (APM) is a mathematical formula describing the relation between the safety level of existing roads (i.e. crashes, victims, injured, fatalities etc.) and variables that explain this level (road length, width, traffic volume etc.). APMs are used for a variety of purposes, most frequently to estimate the expected accident frequencies from various roadway entities (highways, intersections, interstates, etc.) and also to identify geometric, environmental and operational factors that are associated with the occurrence of accidents. It is important to examine the nature of relationships between roadway, environmental and operational factors and, accidents to understand the causal mechanisms involved in accidents on the one hand and to better predict their occurrence on the other hand. APMs are one path of inquiry often used to gain these insights (Reurings, et al., 2005).
3.2
Accident Prediction Model forms
The basic form of nearly all modern accident prediction models is as below (e.g. (Greibe, 2003)):
= ∑
The estimated expected number of accidents, E ( ) is a function of traffic volume Q, and a set
of risk factors Xi (i = 1, 2, 3… n). The effect of traffic volume on accidents is modelled in terms
of an elasticity, that is a power β, to which traffic volume is raised (Hauer, 1995). This elasticity
shows the percentage change of the expected number of accidents, which is associated with a
1 percent change in traffic volume. If the value of β is 1.0, the number of accidents is
proportional to traffic volume, as traditionally assumed when using accident rates in road safety
analysis. If the value of β is less than 1, the number of accidents increases by a greater
percentage than traffic volume. This is further discussed in Ivan (2004).
The effects of various risk factors that influence the probability of accidents given exposure is generally modeled as an exponential function, that is as e (the base of natural logarithms) raised
13
to a sum of the product of coefficients , and values of the variables xi, denoting risk factors.
Mathematically speaking, the following functions are identical:
= � ×
This means that the common model form presented in the equation above can be simplified to:
= ∑ ×�
In models that refer to intersections, a fairly common model form is the following (e.g. (Brüde & Larsson, 1993); (Persaud, et al., 2003)):
= �� �� ∑
In this model, QMA refers to the number of vehicles entering an intersection from the major
road, QMI refers to the number of vehicles entering an intersection from the minor road. Several
versions of these basic model forms have been developed (e.g. (Miaou & Lord, 2003).
There are few guidelines for the choice of model form. The choice of an exponential form is logical in view of the characteristics of the Poisson distribution. Additive linear models are rarely used today, as these models can give illogical results, like a negative predictive number of accidents (Reurings, et al., 2005). Interaction terms are not very common in accident prediction models, although one can easily imagine that for example, a sudden change in both alignment and cross section may have a greater effect on accidents than the sum of the effects of changes in each of these design elements. Hauer (2004) offers some preliminary guidelines, arguing that accident prediction models should contain both a multiplicative and an additive portion:
� = × [ ℎ
× + ]
The multiplicative part is intended to represent the effects of traffic volume and continuous hazards. The additive part is intended to represent the effects of point hazards, like driveways. Hauer, et al. (2004) present an example of this form. The choice of model is closely related to the specification of functional relationships (Reurings, et al., 2005).
3.3
Evaluation of goodness of fit
Several measures have been proposed to evaluate the goodness of fit of accident prediction models. Miaou, et al. (1996) showed that the squared multiple correlation coefficient is not suited as a measure of the goodness of fit of an accident prediction model. Maher & Summersgill (1996) discussed the use of the scaled deviance and the log-likelihood ratio as measures of goodness-of-fit, concluding that the scaled deviance is not suited for data sets that have a low mean number of accidents. Fridstrøm, et al. (1995) discussed and compared five measures of goodness-of-fit. One of these, termed the Elvik Index, is derived from the overdispersion parameter of negative binomial accident predition models.
Total variation in the count of accidents found in a sample of study unit can be decomposed into random variation and systematic variations (Hauer, 1997):
14
There is systematic variation in number of accidents whenever the variance exceeds the mean. This is referred to as overdispersion. The amount of overdispersion found in a data set, can be described in terms of the overdispersion parameter, which is defined as follows (Reurings, et al., 2005):
= × +
Solving this with respect to the overdispersion parameter ( ) givesμ
= −
Where is the overdispersion parameter, is the variance of the recorded number of accident and is the predicted number of accident. The success of a model in explaining accidents can be evaluated by comparing the overdispersion parameter of a fitted model to the overdispersion parameter in the original data set.
Reurings, et al. (2005) concluded that most models assume a constant overdispersion
parameter. If however the ‘size’ of the units of analysis differs (road sections with different
lengths, for example), it is more correct to treat the overdispersion parameter as a variable (Hauer, 2001) and model it as a function of, for example, section length.
3.4
Accident Prediction Models (APM) for Urban Intersections
Though it is recommended to have diffferent APMs for different intersection types Reurings, et al. (2005) as well as Nambuusi, et al. (2008) concluded that the most common and acceptable APM for most intersection types is as below;
= × �� × �� × ∑
Where;
= expected number of accidents at intersection type i
�� = number of vehicles entering an intersection from the major road �� = number of vehicles entering an intersection from the minor road
= vector of explanatory variables, j, other than traffic flow on intersection i = intercept
, = effect of traffic volume on the expected number of accidents (elasticity) = regression coefficient representing the effect of the jth explanatory variable other than traffic flow.
Below are sample models developed for different intersection types in other works.
3.4.1 Model 1
By Sayed & Rodriguez (1999), a study was designed to develop accident prediction models for urban unsignalized intersections as a function of the traffic volumes on both major and minor roads as the type of intersections, i.e. three- or four-arm in the Greater Vancouver Regional District and Vancuver Island, British Columbia.
15
The GLM method which was used in this study is based on the work of Hauer, et al. (1988) and Kulmala (1995). As a consequence, the structure of the model relates the number of accidents to the product of traffic flows, raised to a certain power, entering the intersection. The model developed in this study is of the form:
� = ,
Where
� = expected accident frequency (acc/three years);
V1 = major road traffic volume (AADT)
V2 = minor road traffic volume (AADT) i = model parameters
3.4.2 Model 2
Lord & Persaud (2000) illustrate the application of generalised estimation equations procedure for the development of accident prediction models that take into account the temporal trend (year to year variation) in accident counts. Proper consideration of temporal trend is especially important when many years of accident data are used for model fitting or in countries with a rapidly change in the safety situation. In fact, if trend is not accounted for, the variance in calculated correlations will be underestimated and some regression coefficients may be selected when, in reality, they are not significant. Furthermore, overestimations or underestimations may be obtained, depending on the reference period being analysed.
Accident prediction models were developed for urban four-arm signalised intersections in Toronto area. Five models were calibrated to the data, designed in a way to enable the comparison of different procedures for taking account of time trend.
The general model form is stated by the following equation:
� = × �� , × �� , × ×�� � �, �
Where:
AFt = annual accident frequency (for year t);
AADTmajor, t = entering AADT on the major road (year t);
AADTminor, t = entering AADT on the minor road (year t);
at, b, c = estimated coefficients.
It is important to note the difference in the two models discussed above. The models were developed for accident frequency calculation at three or four arms intersections, which is then applied in the calculation of expected number of accident. The parameters in each equation are different due to location difference, but they all refer to the same parameter. That is, where v was used to represent traffic volume in model 1, AADT was used in model 2. These are comparable to flow Q in the generalized formula in section 4.4. As it has been seen, different research works used different parameters but they all refer to the same definition.
16
3.5
Swedish Model
Sweden has developed comprehensive intersection accident prediction models using the GLIM, for the prediction of road accidents involving different road users that is also applicable to different intersection types as below (Vägverket, 2009) (Brüde, et al., 1998);
For Accidents involving Motor vehicles only;
� = × � + � × [� (� + � )⁄ ]
Given that: ℎ = � + �
� = × ℎ × [�⁄ ℎ ]
� � ℎ = � × ℎ × 3 × −
For Accidents involving Motor vehicles and Cyclists;
� = × ℎ ×
� � ℎ_ = � × × 3 × −
For Accidents involving Motor vehicle and Pedestrians;
� = × ℎ ×
� � ℎ_ = � × × 3 × −
Where;
� = incoming motor vehicles per day from primary road � = Incoming motor vehicles per day from secondary road
ℎ = Annual average number of incoming motor vehicles per day
= Annual average number of passing cyclists per day. = Annual average number of passing pedestrians per day.
� � ℎ = Predicted number of vehicle accidents per million incoming vehicles per
year
� � ℎ_ = Predicted number of cyclist accidents per million passing cyclists per
year
� � ℎ_ = Predicted number of pedestrian accidents per million passing pedestrians
per year
Accident rate = Number of accidents per million incoming vehicles, cyclists and pedestrians
17
The prediction models are applicable all intersection types categorized by the SRA as shown in Figure 3.1. The intersections are grouped into 6 types as depicted in the figure as follows;
Type A: No Traffic Islands, Type B: Standard Refuges, Type C: VSV Lane, Type D: Roundabout, Type E: Signalized, Type F: Ramp or Grade Intersection
The characteristics of each intersection type was combined with different traffic volume, number of arms of the intersection, entering speed, road geometry and traffic environment and used by the SRA to develop tables predefined regression coefficients which are available in the appendix section.
Figure 3.1: Intersection types (Vägverket, 2009)
The Swedish prediction models clearly shows its robustness with specific models for accidents involving different road users. Brüde, et al. (1998) concluded that the regression coefficients show the percentage change in the dependent variable and the influence of the proportional flow on the accident rate. In the case involving only motor vehicles, the coefficients show that an increase in either the proportion of traffic on the secondary roads or general increase in overall incoming vehicles will lead to an increased accident rate, while in the case of cyclist and pedestrians accidents, the coefficients show that an increase in the number of cyclist and pedestrian flow reduces their accident rate, perhaps due to an increased level of awareness for motor vehicles.
An interview was had during the course of this work with Jörgen Larsson of VTI (Swedish National Road and Transport Research Institute) about the performance and relevance of the Swedish prediction models he has developed with his colleagues (Ulf Brüde and Karl-Olov Hedman). His remark was that the model is expected to produce high accident prediction because it was developed several years ago when accident rate was quite high in Sweden and the regression coefficients were developed with less vehicle volume. This remark will be investigated in this work.
18
4
Black Spot Management (BSM)
Black spot management (BSM) has a long tradition in traffic engineering in several countries in the European Union and is still considered an essential part of the site-specific traffic safety work in several countries.
This chapter discusses topics relevant to this work like black spot management definition and philosophy, stages in black spot management, current identification methods applied in some countries, and the recommended black spot identification methods as concluded in the EU’s Sixth Framework Programme, RiPCORD-iSEREST project by Sørensen & Elvik (2007). More details about the guidelines can be found in their work.
4.1
Definitions and Philisophy
There is no standard definition exits of black spots (Elvik, 2004; Hauer, 1996). However, based on an OECD report (OECD , 1976) and more recent work (Persaud, et al., 1999; Hauer, et al., 2002a; Vistisen, 2002), has helped to make a distinction between the common definitions of black spots;
1. Numerical definition
Accident number Accident rate
Accident rate and number
2. Statistical definition
Critical value of accident number Critical value of accident rate
3. Model-based definition
Emperical Bayes Dispersion value
A simple numerical definition can be taken from the official Norwegian definition of a black spot: A black spot is any location with a maximum length of 100 metres, at which at least four injury accidents have been recorded during the last five years (Statens vegvesen, 2006). This definition does not make any reference to traffic volume or to the normal number of accidents, neither does it specify the type of location considered (Sørensen & Elvik, 2007).
A statistical definition of a black spot relies on the comparison of the recorded number of accidents to a normal number for a similar type of location. For example, an intersection will be classified as a black spot if the recorded number of accidents in a specific period is significantly higher than the normal number of accidents for this type of junction. Depending on how the normal number of accidents is estimated, a statistical definition may come close to a model based definition of a black spot.
Model-based definitions of black spots are derived from a multivariate accident prediction model. An example is the Emperical Bayes (EB) definition of a black spot given by Persaud, et al. (1999). Models were developed for intersections and road sections, and the 20 highest ranked locations were identified according to the EB estimate of the espected number of
19
accidents. From a more theoretical point of view, black spots can be defined as any location that (Elvik, 1988; 2007):
1. Has a higher expected number of accidents, 2. Than other similar locations,
3. As a result of local risk factors.
All three elements of the definition are needed. With respect to the first element, black spots should be defined in terms of the long-term expected number of accidents, not in terms of the recorded number of accidents. It does not make sense to regard a location as abnormally hazardous simply because a high number of accidents happened to be recorded during a specific period. Observed variation in accidents is always a mixture of random and systematic variation, and it is sources of systematic variation that is of interest in safety analyses.
As far as the second element is concerned, black spots should always be identified as member of a certain population of sites that are more or less similar to each other. Examples include intersections with a given number of legs, road sections of a given length or horizontal curves with radius in a certain range. The similarity of locations can also be assessed according to the values for explanatory variables used in accident prediction models. Similar sites would then typically be sites that have nearly the same traffic volume, the same speed limit, the same number of lanes, and so on, for all variables that are included in the accident prediction model. However, no definition of a population of sites and no accident prediction model will be exhaustive in the sense that these definitions or models correctly identify all sources of systematic variation in the number of accidents. If they did, all remaining variation would by definition be random only. In that case a high expected number of accidents would be regarded
as “normal” in the sense that it would be fully explained in terms of the classification of sites
or the accident prediction model fitted. Accidents are, however, influenced by a very large number of factors, some of which are local. Thus, the third element of the definition, stating that a higher expected number of accidents should be attributable to local risk factors is also needed.
Based on the definition the basic philosophy for BSM can be clarified. Thus, the philosophy is to use the accident history to identify locations with local risk factors that are not immediately visible for the road users and that are related to the local detailed road layout and traffic behaviour. These locations can be treated relatively inexpensively because it is only the detailed road layout and traffic behaviour that have to be changed and not the general road layout. Therefore you get a lot of value for money used in terms of traffic safety. The nature of BSM can be summarized as local, retrospective and remedial.
4.2
Stages in BSM
BSM can be divided into 9 more or less independent stages as in Table 1. This can also be summarized in the following three activities as below (Sørensen & Elvik, 2007):
1. Definition and identification of black spots
2. Analysis of accidents and risk factors at black spots, designed to identify factors contributing to accidents and propose treatments
20
BSM starts with a systematic collection of data that enable the identification of sites that have developed into black spots. Once black spots have been identified, accidents are analysed in order to find a common pattern of accidents and factors that contribute to accidents. A visit to each site identified as a black spot is usually part of the process of analysis.
4.3
Current identification methods
In Elvik (2007, 2008), a survey was conducted to describe how black spots are identified in the eight European countries: Austria, Denmark, Flanders, Germany, Hungary, Norway, Portugal and Switzerland. These are summarized as the following.
4.3.1 Austria
A black spot is any location that satisfies one of the following two criteria:
1. Three or more similar injury accidents within three years and a risk coefficient Rk of at
least 0.8. The risk coefficient is calculated as follows:
= . + × − × �� ,
where:
AADT = Annual Average Daily Traffic
U = Number of injury accidents during three years
2. Five or more accidents (including property damage only) of similar type during one year. Since 1995 property damage accidents are not recorded. Hence identification of black spots primarily relies on the first definition.
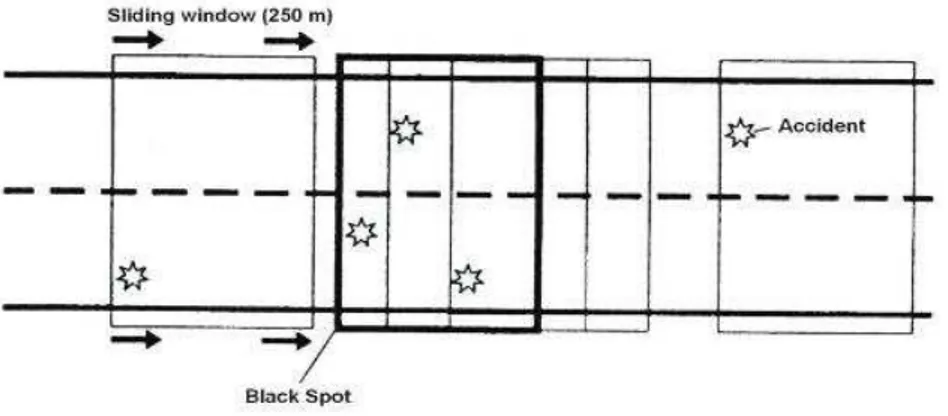
To identify black spots, a sliding window with a length of 250 metres is applied. The window is moved along a road and flags each location where one of the two criteria for a black spot is met. The principle of the sliding window approach is illustrated in Figure 4.1. An accident typology consisting of ten different types of accident has been developed for the purpose of identifying similar accidents (Austian Guideline Code for Planning, Construction and Maintenance of Roads , 2002).
Figure 4.1: Identification of black spots in Austria by sliding window approach (Austian Guideline Code for Planning, Construction and Maintenance of Roads , 2002)
21
4.3.2 Denmark
The identification of black spots relies on a fairly detailed classification of the road system into various types of road sections and various types of intersections (Vistisen, 2002) (Overgaard Madsen, 2005). To identify a black spot, a test based on the poisson distribution is used. The minimum number of accidents for a site to be considered as black spot is four accidents recorded during a period of five years. The level of significance used in the statistical test is 5%. Thus, suppose the normal number of accidents for a location has been estimated to 2.8 during five years and the five accidents have been recorded. Applying the Poisson distribution, the probability of observing at least five accidents given that the mean number is 2.8 can be calculated to 0.152, which means that this location would not be classified as black.
As far as road sections are concerned, black sections are identified by means of a sliding window approach. The size of the window varies, depending on the normal number of accidents for a section.
4.3.3 Flanders
The following definition of black spots is applied (Geurts, 2006), based on police reports of accidents: Each site where in the last three years, three or more accidents have occurred is selected. Then, a site is considered to be black when its score for priority (S), calculated using the following formula, equals 15 or more:
= � + 3 × � + × �,
Where;
LI = total number of slight injuries SI = total number of serious injuries DI = total number of deadly injuries
A sliding window with length 100 metres is applied to identify black spots.
4.3.4 Germany
Black spots are identified by means of maps showing plots of accidents. A period of either one year or three years is used to identify black spots (German Road Transportation Research Association, 2006).
If one year is used, a location is classified as black if five accidents of a similar type, irrespective of severity have been recorded at a location extending for not more than 100 metres. An elaborate accident typology has been developed to help determine if accidents are of a similar type or not.
Using a three year period, a black spot is defined as any location where five or more injury accidents have been recorded or any location where three or more serious injury accidents have been recorded.
22
4.3.5 Hungary
Two definitions of black spots are used. Outside built-up areas, a black spot is defined as a location where at least four accidents have been recorded during three years on a road section no longer than 1000 metres. Inside built-up areas, a black spot is defined as a location where at least four accidents have been recorded in three years on a road section no longer than 100 metres.
Search for black spots is made by using the sliding window approach. The window is either 1000 metres or 100 metres wide.
4.3.6 Norway
In Norway, a distinction is made between black spots and black sections. A black spot is any location with a length of not more than 100 metres where at least four injury accidents have been recorded in the last five years. A black section is any road section with a length of not more than 1000 metres where at least 10 injury accidents have been recorded during the last five years. The period used to identify black spots or black sections was recently extended from 4 to 5 years (Statens vegvesen, 2006).
Black spots and black sections are identified by applying a sliding window, which is fitted to the location of the accidents. Black sections will often consist of several black spots that are located near one another.
4.3.7 Portugal
Two definitions of black spots are currently used in Portugal: one was developed by the Traffic Directorate (DGV); the other was proposed by Laboratório Nacional de Engenharia Civil (LNEC).
According to the definition of DGV, a black spot is a road section with a maximum length of 200 metres, with five or more accidents and a severity indicator greater than 20, in the year of analysis. The severity index is calculated by the following weighted sum:
× + ×
+ ℎ
Detection is carried out using a sliding window moving along the road. An alternative method was proposed by LNEC in 1997 and tested in 1998.
According to this method, a black spot is a geographical area where the expected number of accidents is greater than in similar areas, due to the influence of road characteristics peculiar to the area. In practice this definition is applied differently to intersection and non-intersection accidents. As far as non-intersection accidents are concerned, different minimum road section lengths are used for single carriageway roads and dual carriageway roads: 250 metres minimum length is used in the first case, 500 metres in the second. The road network has been divided into 6 classes of road. For each class of road, a unique accident prediction model is fitted to accident data for a five year reference period. In each year, observed accident data from the previous five years are combined with the corresponding accident prediction model to estimate the expected number of accidents. Depending on the road class, the worst 1/1000 or 2/1000 cases are selected for detailed safety diagnosis and possible intervention.