Factors Influencing the Cell Phone Brand Loyalty of Swedish Generation Y.
By
Shehzad Ahmed & Zahra Moosavi
Master Thesis Submitted to: The Mälardalen University The School of Business, Society and Engineering
Västerås, Sweden
MASTER THESIS – INTERNATIONAL MARKETING Course Code: EFO705 (15hp)
Supervisor: Konstantin Lampou Co-Assessor: Peter Thilenius
Abstract
Date Final Seminar: May 29th, 2013Level : Master Thesis in Marketing, 15 ECTS Course Code: EFO 705
Institution: School of Business, Society and Engineering. Authors : Shehzad Ahmed Zahra Moosavi
Title : Factors Influencing The Cell Phone Brand Loyalty of Swedish Generation Y.
Tutor: Konstantin Lampou Second Reader : Peter Thilenius
Key Words: Generation Y, Brand Loyalty, Mobile Phone, Sweden.
Research Questions: “What are the main factors that influence the cell phone brand loyalty of young people (Generation Y) in Sweden?” and
“Does Swedish Generation Y show loyalty to their cell brand?”
Purpose of The Study: The purpose of this study is to analyze the factors which Influence cell phone brand loyalty of Swedish Generation Y.
Methodology: For this thesis primary data and existing literature was used. A questionnaire based survey was conducted among Generation Y.
Conclusion: A majority of Swedish Generation Y showed brand loyalty to their cell. Cell Phone brand quality, brand image, brand experience and customers satisfactions were found to be main factors influencing their loyalty.
Acknowledgment
First and foremost, we would both like to thank Konstantin Lampou, our thesis super visor, for his great guidance during the course of our Thesis work. He kept us organized and most importantly helped us get the most out of this whole learning process.
We are also indebted to our seminar groups and opposition group for their constructive criticism and positive feedback. This has been a very rewarding learning experience for us and we thank you for all your help. We believe all the useful advices and constructive criticism has helped us to succeed.
Last but not least, we would like to thank our families and friends.
Table of Contents 1. Introduction...1 1.1 Problem Description ...2 1.2 Research Questions ...3 1.3 Purpose ...3 1.4 Target Audience... ...3 2. Theoretical Framework ...4 2.1 Generation Y ...4 2.2 Brand Loyalty ...5 2.2.1 Brand Image ...6
2.2.2 Perceived Brand Quality ...7
2.2.3 Brand Experience ...7
2.2.4 Customer Satisfaction ...8
2.2.5 Switching Cost ...9
2.3 Generation Y and Brand Loyalty ...9
2.4 Conceptual Framework ...10 3. Methodology ...11 3.1 Selection of Topic ...11 3.2 Research Process ...11 3.3 Research Method ...12 3.4 Data Collection ...13 3.4.1 Primary Data ...13 3.4.2 Literature Review ...13 3.5 Questionnaire ...14 3.5.1 Sample Population. ...14 3.5.2 Questionnaire Distribution ...14 3.5.3 Question Design ...15
3.5.4 Analysis of the Data ...16
3.6 Reliability and Validity ...17
3.7 Limitation of Research ...17
3.8 Research Ethics ...18
4.Findings ...19
4.1 Demographic ...19
4.2 Brand Image ...20
4.3 Perceived Brand Quality ...21
4.4 Brand Experience ...22
4.5 Customer Satisfaction ...24
4.6 Switching Cost ...26
4.7 Brand Loyalty ...27
5.1 Brand Image ...30
5.2 Perceived Brand Quality ...31
5.3 Brand Experience ...32
5.4 Customer Satisfaction ...33
5.5 Switching Cost ...34
5.6 Cell Phone Brand Loyalty and Generation Y ...35
6. Conclusion ...37
7. Recommendation ...39
8. References ... V 9. Appendices ... X List of Tables: Table 1. Questionnaire Design ...16
Table 2. Gender ...19
Table 3. Age ...19
Table 4. Nationality ...19
Table 5. Education ...19
Table 6. Brand Image ...30
Table 7. Perceived Brand Quality ...31
Table 8. Brand Experience ... 32
Table 9. Customer satisfaction ...33
Table 10. Switching Cost ...34
Table 11. Brand Loyalty ...35
List of Figures Figure 1. Brand Loyalty Pyramid ...6
Figure 2. Conceptual Framework ...10
Figure 3. Research Process Model ...12
Figure 4, 5, 6, 7 Brand Image ...20
Figure 8, 9, 10, 11 Perceived Brand Quality ...21
Figure 12, 13, 14, 15 Brand Experience ...22
Figure 16, 17, 18, 19 Customer Satisfaction ...24
Figure 20, 21, 22, 23 Switching Cost ...26
1. Introduction
This chapter begins with the general overview and background of the research area and it further includes the problem description, research questions, purpose and target audience.
The mobile phone industry is one of the fastest growing industries in the world. The first major renovation occurred in 2002 with accumulation of the first color screen and then they introduce multimedia mobile phone during 2004-2006. Finally the birth of smart phone started in 2007 by Nokia (Prlog, 2009). One of the main influence of growing mobile phone industry is that mobile has become necessary device in our everyday life. Nowadays mobile phone serves as a fashion item, status symbol and a channel especially for the young generation that wants to express themselves (Sultan & Rohm, 2005). Chen (2010) stated as customer expectation and wants are changing, mobile phone will continue to innovate and be reinvented with modern technology.
The most of the cell phone consumers are young people or Generation Y, which is defined as a generation that was born between (1977-1995). In addition Generation Y is relevant with mobile phone industry, as Roham & Azhar (2010) quoted that there are some attribute that proved mobile phone as a required device for Generation Y. These attributes include connectivity, coverage, price, availability, quality, brand name and advertisements. It is important for mobile phones companies to attract Generation Y customers with new technologies and designs, and make profit from them by earning their loyalty.
However the success of mobile phone is not only because of technological characteristics but it is also related to many social dynamics and external cues such as price, brand and warranties (Ahsan, 2011). Branding as an important factor allows an organization to create meaning and value for their standard product and firms desire that customers become loyal to their brand (Frow, 2002). The branding product is an important factor to make Generation Y as a loyal customer. Branding also influence consumers buying intentions; especially for Generation Y, and building a strong brand is the goal of many organizations (Lazarevic, 2011). Experts believe that the desire to get branded product is important to belong to a specific group/peers (Ferle & Chan 2008). It means peers can be the primary socializing agent for consumption values. Moreover, most marketers have emphasized to create a brand image to obtain customers brand loyalty.
Generation Y is the main target group of this research. They have large size in the market and they are important segment in the society. Most literature attributes Generation Y as a generation that has strong independence. The other important concept is that Generation Y customers have unique attitude toward brands and they are more comfortable with brands than other generations (Evelyn, Eva & Robin, 2011). But Lazarevic (2007) found that, it is difficult to
to low repeat purchases. Moreover unlike the past generation they have been raised up in the environment where globalization and branding became a way of life. Nowadays it is important for most of the organizations and business owners to know more about Generation Y, so they can recognize how Generation Y customers are different. It is also important to understand and know about the world where Generation Y have been growing up, as their world is very different from that of Baby Boomer and Generation X (Evelyn, Eva & Robin, 2011).
1.1 Problem Description
The popularity of digital devices among younger consumers has generated great interests among marketers. Especially the cell phone or the mobile phone has become very popular among millions of young consumers around the world. A vast majority of users consider their mobile phone as an intimate accessory and maintain a very personal relationship with it (Bauer et al., 2005).In the past research on customer brand loyalty has been done mostly in mature market considering general consumers (Son, 2010). Due to fast technology and design changes, there is short mobile phone life as new products are constantly introduced in the market. In such case, brand loyalty of Generation Y becomes an interesting area to explore. Cell phone manufacturers are producing new products with faster speed and new features almost every year (Li, 2010). Due to rapid technological and design changes a majority of the young generation of cell phone owners are forced to buy an updated version of cell phone (Li, 2010).
Generation Y are main target group of this research, has large size in the market and they are important segment in the society. Marketer and firm's management faces a challenge regarding consumer behavior of this particular segment of consumers. Consumers belonging to Generation Y possess a tough challenge for marketers as they are resistant to traditional marketing strategies and are considered as disloyal consumers (Bush et al., 2004).According to Saxton (2007) it is important to understand behavior and approach of Generation Y regarding branding for a successful branding strategy for this group of consumers.
Brand loyalty has been researched previously as well as it benefit organizations in term of saving money and creating good will with customers due to positive word of mouth (Liu,2007 ).
Young people express themselves in the society by their personal style regarding clothes, music, cultural style and mobile phone is no exception (Willis, 1990). They are personalized by choosing a specific brand, size, color, background picture and ring tones that correspond to their personality, Mobile phone is considered an important part of their daily lives (Bauer et al., 2005). As discussed earlier Generation Y has a complex nature with regard to brand loyalty. However, it is an important group of consumer due to growing spending power of the group. Generation Y is especially important as a consumer class, since it has the potential to grow and as this growth occurs, the Generation’s spending power and market influence will increase as well (Wolburg & Pokrywczynski, 2001). It is important for most of the organizations, business owners and marketing managers to know about consumer's behavior of Generation Y, as they try to recognize how Generation Y customers are different. Branding is a well established concept, but due to a unique nature of Generation Y, it becomes an interesting combination and area to
explore (Phau and Cheong, 2009).
1.2 Research Questions
The research question for this project is derived from the problem we are looking to address main factors which influences young people’s cell phones brand loyalties. The chosen research problem, not only indicate personal interest of the authors, it must also lead to relevant research questions (Bryman & Bell 2011). We would try to understand the consumers’ attitudes and brand loyalty for cell phones in Sweden. We have formulated the following research questions for our thesis work.
1. What are the main factors that influence the cell phone brand loyalty of young people (Generation Y) in Sweden?
2. Does Swedish Generation Y show loyalty to their cell brand? 1.3 Purpose
The purpose of this study is to analyze the factors which influences Generation Y consumers brand loyalty while choosing a mobile phone. Which factors have more influence on consumer’s brand loyalty? The main focus of the research would be to which extent young Swedish consumer are loyal to their mobile phone. As branding is being used a strategy by different companies and marketers. This study would help in assessment of brand loyalty level of young Swedish consumers. The study intend to identifying and analyzing the characteristics of Swedish Generation Y throughout this thesis. The study would also help to understand relevance of factors such as brand image, brand experience, brand quality switching cost and customer satisfaction for this segment of consumers.
In the past research has been carried out mainly on brand loyalty of general segment of society, however this research intends to study specifically cell phone brand loyalty of Swedish Generation Y. Thus, this thesis also aims to fill that gap and add some understanding of Generation Y and cell phone brand loyalty to the existing literature.
1.4 Target Audience
This thesis is aimed at various target audiences interested in knowing about customer loyalty towards cell phones. It can be a useful marketing tool for mobile phones marketer. It will give an insight to mobile phones professionals about consumer’s intentions. Our research and its recommendations can provide mobiles marketer a better understanding of young customers, in addition on how to adapt to and get advantage of their intentions. Another target audience will be academic scholars interested in researching young customers’ attitude and intentions. It can also be useful for mobile phones manufacturers, their suppliers and marketers. The study will also provide recommendations for target audience, which they can take into consideration to improve their marketing strategies. The study aims to answer the questions in a way that the findings are relevant for academic people, as well as have practical implications for mobile
2. Theoretical Framework
The following chapter gives an overview of the information of this chapter. The main goal of the theoretical framework chapter is to give an overview of the research with regard to the key topics of our study; specifically Generation Y, brand loyalty, factors relevant to brand loyalty, Generation Y and brand loyalty and conceptual framework.
2.1 Generation Y
There is different view about the year of Generation Y but most of the researcher mention that Generation Y customers were born between 1977 and 1995 (Evelyn, et al, 2011). Vittal & Bobbie (2012) argued, the main characteristics of this generation are inclination towards online social networks, TV, cell phone and video games; these are considered to influence this generation's lifestyle, moreover they are well educated and well connected to the virtual world.
According to Adelina et al. (2007) there are some key characteristics of Generation Y that separate them from other generation such as being independent, well educated, self-possessed, optimistic, open minded, sociable and technically literate. Generation Y is one of the most frequent and popular term used for this generation. However, there are other various names that have been applied to them such as Millennial, Generation Me, Generation WHY, Gaming Generation, and Face-book Generation. Generations Y tend to be comfortable with technology and most of them have their own computer at a young age and they have good experience in internet usage and finding required information (Elisabeth & Micheal, 2009).
Generation Y are in a world that has been renewed by new technologies that make new way of communicating, working, creating and exchanging knowledge. All of these have an impact on their work and their life (Beck et al., 2000). Generation Y has an advantage that when they are faced with challenges shaped with old model, their new way of behaving, the new lifestyle and new knowledge of the society help them to overcome the challenges (Elisabeth & Micheal, 2009).
Most of the researchers approved the Generation Y, as a generation that trend to have strong independence and sensitive to get more attention. They have more interaction with peers group, their peers become the primary socialization agents that effect on their consumption value. Moreover peers perform an important role in their consumption behavior for store, products, brands, media and television program (Ferle & Chan, 2008). Therefore peers and media are the strongest group that influence to this cohort, since they have high need for peers acceptance and also matching with media and crowd. Generation Y get some influence from celebrities. Teenagers and young persons tend to follow their favorite celebrities to incorporate characteristics that they lake on their personal life, and because of this most of them dress and behave like their favorite celebrities (Taylor & Stem, 1997).
According to Kumar & Lim (2008) Generation Y is the early generation that adapted to technology, also they are extensive users of the internet. They are known as digital natives and the digital language is their second language. Beside the internet Generation Y is one of the most frequent mobile phone users. More than 50% of them have their own mobile phone to call and send short message (SMS). Since they personalize their phone by having unique ring tone, screen savers and message tones, so mobile phone have been used as a self- expression and individual device by Generation Y (Evelyn, Eva & Robin, 2011).
2.2 Brand Loyalty
Brand loyalty is important as it motivate the consumer that their product has the required qualities and this becomes the base for a future purchase behavior. According to Holt (2004, p. 95) “brand loyalty is the consumer’s willingness to stay with a brand when competitors come knocking with offerings that would be considered equally attractive had not the consumer and brand shared a history.” Most authors and researchers have focused more on behavioral aspects of brand loyalty and less on attitudinal aspect of brand loyalty. Dick & Basu (1994) described behavioral loyalty, dependent on proportional purchase and purchase sequence. Behavioral loyalty does not provide a comprehensive picture of loyalty as it fails to explain switching away of customer to a competitive brand (Allan & Joel, 1996). The behavioral or attitudinal attributes of loyalty have been further strengthened by Kabiraj & Shanmugan (2011, p. 286), who pointed out that “brand loyalty is the consumer's conscious or unconscious decision, expressed through intention or behavior, to repurchase a brand continually”.
According to Thiele & Bennett (2001), the consumers show different attitude towards durable goods and consumption goods. In case of durable products a customer does not buy the product so frequently as he does so in case of consumption goods. Authors Son K, et al. (2010, p. 131) described brand loyalty as “a deeply held commitment to re-buy or re-patronize a preferred product/service consistently in the future, causing a repetitive same brand or same brand-set purchasing, despite situational influences and marketing efforts having the potential to cause switching behavior.”
It is important to study brand loyalty as brand loyalty plays an important role in brand extensions as well as brand equity. Mokhtar, et al. (2000, p. 827) pointed out that brand loyalty plays an important role in organization’s profitability and future growth, “Loyal customers stick with their suppliers or service providers over the long run”. They also express their loyalty by giving a greater share of their wallets to their high-value brands or service providers and by generating word-of-mouth referrals. All of these behaviors will directly affect profitability. It shows that researcher recognizes, brand loyalty being dependent on both attitudinal and behavioral attributes of consumers and both elements are equally important from brand loyalty perspectives.
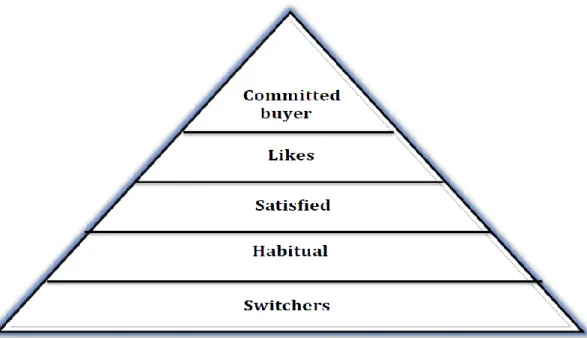
Brand loyalty concept becomes easy to understand by studying brand loyalty pyramid proposed by Aaker (1991), as shown in figure 1. He proposed brand loyalty to be one of the five elements of brand equity.
Figure 1 Brand Loyalty Pyramid (Aaker, 1991 p. 40)
(Aaker,1991) pointed out that brand loyalty is a variable having different level of strengths depending on a particular customer. Switchers are the customers, who keep on changing brands due to low switching costs. Habitual buyers are the people who have a habit to buy the same brand repeatedly, but do not have an emotional attachment with the product. Satisfied customers are the people who are loyal to a brand because it continuously satisfies their needs and wants (Aaker, 1991). Likes have an emotional attachment with the product and committed customers are at the top of the pyramid. These people share strong commitment and trust with the brand and value this attachment.
According to Oliver (1999) there is a social connection between the customer and brand. This social connection helps in development of the loyalty and satisfaction of the customer towards the brand. Oliver (1999) carried out a research indicating that satisfaction plays an important role in brand loyalty; however other factors like quality, customer’s interest in the brand and social connection between customer and brand also important factor for brand loyalty development.
2.2.1 Brand Image
Lazarevic (2011) argued that one of the important steps to reach brand loyalty is brand image. Based on branding theory, brand image must be congruent with the customer's image about themselves. Brand imagery deals with the extrinsic of the product, including the way that brand
attempts to meet customer's psychological or social needs. And brand image indicate that people think about brand abstractly rather than what the brand actually does, therefor image refer to intangible aspects of the brand (Keller, 2001). According to Chen & Myagmarsuren (2011) brand image plays an important role when customers measure products, and it drives customers to become loyal. Moreover brand image influence the orientation and behavioral character of customers toward brand, product and company.
Brand image is important for Generation Y customers as they use brand for their self-expression and also they want to be associated with a brand. The important values for Generation Y customer’s image are success, wealth, class, style and being better. Brand image in the marketplace act as indicator to Generation Y customers, since they prefer to use the brand they have experienced before or have good feeling about it, rather than being influenced by the value of the brand. But in contrast Generation X customers are very value oriented and they purchase product very analytically (Pendergast et al., 2009).
2.2.2 Perceived Brand Quality
Perceived Quality has an influence on customer loyalty and benefit companies as it improves customer retention rate. It greatly influences customer’s perception about a brand, as he makes an assessment of overall quality of a brand as compared to its competitors (Aaker 1991, p. 85). A good perception about quality of a product improves satisfaction rate of a customer and he becomes loyal to the brand. The perceived brand quality also affect positioning and profitability of the product in the market. It also helps customers to differentiate a brand from another on the basis of its quality (Aaker 1991, p. 85). According to Apéria & Back (2004, p. 47) a consumer’s perceived brand quality improves financial gains for a company as it increases customer’s satisfaction and loyalty. The most common parameters used to assess the quality of a product are user friendliness, durability, serviceability, excellent performance and prestige features (Bruks & Naylar, 2000).
2.2.3 Brand Experience
Brand experience is important topic for marketing practitioners, as it helps to understand customers behavior regarding their brands. It also helps in development of better product and services for consumers. Brakus & Zarantonello (2009), conceptualized brand experience as subjective and internal consumer responses, and it is specific sensations, feelings, cognition and behavioral responses, that are activated by specific brand-related stimuli. It was pointed out that when customers search for products and brands they are exposed to brand-related stimuli such as brand identifying color, shape, typeface, background design and brand characteristics.
Experience occurs in variety of situation, and more experience is gained when customers purchase and use the product or brand. Experience can happen indirectly as well, when
et al, 2009, p.52).
Brakus, et al. (2009) argued that “brand experience affect customer satisfaction and customer loyalty directly and indirectly through brand personality association”. It means when customers are satisfied and have good experience from a product or service, they are likely to repurchase it and become loyal. And the linkage between brand experience and loyalty help marketers to improve customer’s retention rate.
2.2.4 Customer Satisfaction
Brand satisfaction has a positive influence on brand loyalty (Youl & John, 2010). A satisfied customer is likely to use same brand in future as well. The satisfied customer is expected to continue purchasing same brand. Trust and satisfaction are two factors that lead to positive purchase outcome. When customers have been sure that the company or firm is honest and truthful, then the customers trust the brand and form a positive buying retention towards the brand. Moreover trust can lead to customer’s satisfaction and loyalty to the brand (Anderson & Narus, 1990). When customers feel pleasure and satisfaction after using a product, it leads to long-term relationship and repeated purchases. Another factor that influences customer satisfaction and expectation is the spreading of word of mouth. It means when customers are satisfied with a brand, they would recommended it to their friends. The customer satisfaction results in improved customer loyalty towards the brand (Dick & Basu, 1994).
According to, Serkan & Gökhan (2009) customer satisfaction is the result of overall consumer satisfaction. This satisfaction can be due to collective experience of the product and its different features. The customer satisfaction can also be due to purchase expectation and post purchase experiences by the customer, having got a satisfactory product after paying a suitable cost. However consumer’s satisfaction also depends on expectation of a brand and its performance, and subsequent post purchase experiences (Serkan & Gökhan, 2009).
Paurav (2004) argued that customer satisfaction is his or her psychological response to the product performance and an outcome of the customer’s expectations. This analysis of the product performance is based on comparison between expected and actual performance of that particular brand. The expectation of a customer from a specific product and its different features depends on his personal interests. The brand performance depends on its different attributes and features, which are required by a customer. These operating characteristics can be hardware, software, style or other functionality (Gilbert & Carol, 1982).
These different characteristics and performance of the product determines the satisfaction level of the consumers. The customer satisfaction leads to brand loyalty and a positive attitude towards the product. It also results in customer’s repeat purchasing behavior (Youl & John, 2010).
2.2.5 Switching Cost
When a customer decides to switch to another brand, the cost incurred due to this process is named as switching cost. Switching cost makes it difficult for customers to switch to another product or brand (Feick & Lee, 2001).Even if a customer is not satisfied with a product, he would not be able to change his brand due to high switching cost. This creates a barrier for customer and he abandons search for alternative brands.
The Switching cost can be both financial and non financial cost. It can be transactional cost, learning cost, and emotional cost, social and psychological cost. It can also be time and effort spent to search an alternative brand (Burnham & Mahajan, 2003).
The financial cost can be one time payment as well as additional cost incurred due to functional updates and additional accessories. A customer may have to spend lot of time and energies in learning functionality of new brand. There is also possibility that switching to another brand can result in social status changes, which can have adverse psychological effects on the customer (Burnham & Mahajan, 2003) .The high switching cost minimize customer’s switching intentions and benefits companies as it influence customers loyalties and improve their retention rate (Serkan & Gökhan, 2005).
2.3 Generation Y and Brand Loyalty
Generation Y customers have special attitude toward brand and as compare to other generation are more connected with brand. They have been growing up in a time where brand is very important and almost every product is branded. Authors, Syrett & Lammiman (2004) believed that Generation Y customers are disloyal segment and marketers have to improve their approaches to increase brand loyalty of this cohort. However, if the Generation Y could recognize the values behind the brand and feel that it is matching with their own values, then they can begin to form a relationship with the brand (Keller, 1999).
According to Evelyn et al, (2011) Generation Y customers are one of the largest cohorts in the market with high buying power, and they have become the main target for the marketers. Therefore if the marketers could create a congruency between their brand and Generation Y customers, they would capture their attention and establish brand loyalty. Additionally their behaviors towards brand have an affect on consumption behavior of all other generations (Merrill, 1999).
Generation Y customers are well informed about marketing than other generations. And they believe that they live in materialistic society and because of this their consumption behaviors are different from previous generation. Besides all the time Generation Y customers are worried about what others think about them and they use brand as a device to express themselves (Lazarevic, 2011).
The main issue is, how Generation Y customers could become loyal to a brand. Brand loyalty means positive attitude toward a special product and brand and it leads to repurchase of the same brand. Grassel (1999) believed that “behavioral loyalty is the actual action for repurchase for Generation Y”. Nobel et al. (2009) found that Generation Y consumers are interested to use and buy products that match with the image، which they have for themselves and this appropriateness of brand lead to repurchase and brand loyalty in Generation Y customers. Branding products improve the chances to build loyalty among Generation Y customers. It allows the companies and marketers to build up a brand image, the brand which matches with their self-personality are recognized by the customers (Lazarevic, 2011).
2.4 Conceptual Framework
A conceptual model was developed based on theories discussed above. The following conceptual model for this research presents the main issues and items that can influence brand loyalty. Besides, the conceptual framework as illustrated in figure 2 shows factors that can influence consumer behavior of Swedish Generation Y, with respect to mobile phone brand loyalty. Factors like brand image, brand experience, brand quality, customer satisfaction, and switching cost which could lead to brand loyalty in Generation Y have been discussed. These factors can affect behavior of Generation Y consumers. In methodology section of the report a questionnaire has been included, having background information from theoretical framework, about brand loyalty and different factors which influence brand loyalty.
Developing a conceptual frame, is normally “modification and developments of theories” written in literature (Fisher, 2007, p.5).
Figure 2Conceptual framework
(Own work) Brand Image Brand Quality Brand Experience Customer Satisfaction Switching Cost Factors influencing Generation Y Brand Loyalty
3. Methodology
The following chapter gives an overview of the method and the path of the research, provides reliability to the readers and ensures the validity of this report.
3.1 Selection of Topic
The main purpose of the study was to find out the factors that can influence cell phone brand loyalty of Generation Y. The research topic has to be interesting for the authors, in order to motive the researcher during the path of writing. Another element that authors have to consider when choosing the topic is the accessibility of the people and the necessary data, to enable the researcher to answer the research question. Finally, the outcome of the research has to be interesting and understandable for the readers (Fisher, 2007).
The brand loyalty was interesting for the authors, and they started to explore data around this specific area to find an appropriate topic. Then the product was found that would be interesting to them, so cell phone was chosen as the case study. Since mobile phone branding is more popular between young cohorts, the authors decided to use Generation Y as target segment in this thesis. Generation Y refer to cohort, that were born between 1977 and 1995 (Evelyn, et al, 2011). At the same time to conduct this research it was decided to choose Swedish market, since it was easy for authors to access target group for the research.
3.2 Research Process
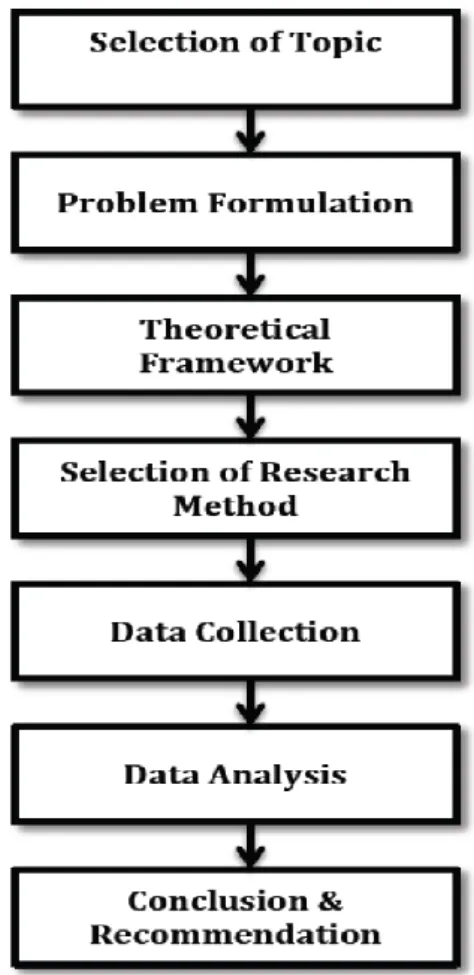
The figure 3 given below shows a framework of the research and explains the stages that were involved to conduct this research. During stage one the topic of the research was chosen, in second phase the problem of the research have been formulated and then the relevant theories and literature were studied in conceptual framework. Later on the quantitative method was used for collecting data. During final stages the collected data was analyzed according to the theories, which exist in chapter two and then conclusion and recommendation were drawn based on the research questions.
Figure 3 Layout of research process (own work) 3.3 Research Method
For this thesis a survey was conducted to understand the Generation Y consumers cell phone brand loyalty and what factors influence consumers brand loyalty. Primary data collection was carried out in order to answer the research questions. Secondary data was used only for literature review and theoretical framework. It was found from different online websites and databases. Mostly popular databases like DiVA, Emerald, Inderscience, Wiley Online Library, Academic and Researchers books, and other marketing and business related journals were used for finding secondary data.
For this study, a descriptive quantitative method was applied. Quantitative research method involved the use of structured questions which are designed to obtain response to some particular aspects of the respondent's behavior, attitudes and demographic characteristics,which can be presented with accurate and quantifiable estimations (Ghauri & Cateora, 2010). To study the social issue, quantitative approach is suitable (Bryman & Bell 2007. Therefore, in order to answer the research question about the factors involved in cell phones brand loyalty, which is categorized as social behavior, the “quantitative” research methods have been chosen for the research (Bryman & Bell 2007).Quantitative process involves number and is statistical in nature. The research method is useful, as it is easy to collect a large sample size. Moreover, the result can be easily compared as well.
3.4 Data Collection
An important process in each research study is the data collection process that provides the factual foundation for the results derived from the research (Fisher, 2007). In the field of conducting a research study, there are generally two ways of collecting evidence, which are primary data derived from primary sources and secondary data from secondary sources (ibid).
3.4.1 Primary Data
The primary data needed for the research was gathered through questionnaires. In designing the questionnaires, different formats can be used. The questionnaire for the research consisted of demographic questions, multiple choice questions and closed ended questions as recommended by Fisher (Fisher, 2007, p. 162).
A questionnaire was used to collect data in order to have a better understanding of Generation Y consumer’s attitude towards cell phone brand and level of their loyalty towards their favorite brands. This approach also helped to compare the opinions of a large number of people with ease in a limited available time.
As Fisher (2007) stated closed ended questions allows the respondents to answer the question in an easy and fast way. Moreover, for a quantitative research it is better to use closed ended questionnaire approach (Fisher, 2007, p.45).
The primary data collection was conducted via surveys involving consumers belonging to Swedish Generation Y. A questionnaire was designed to ask detailed questions to the consumers about their mobile phones and the factors they consider while buying their favorite cell phone. So this involved interviews with the Swedish Generation Y through surveys. The surveys were conducted in person and through online by using MDH email and social mediums like Face book. The research is based on marketing theories of branding and its correlation with the customer loyalty, brand image, brand experience, perceived brand quality, customer satisfaction and brand switching cost.
3.4.2 Literature Review
Secondary data was collected only for theoretical purpose from different sources, studying previous research that is related to the research topic. The secondary data helped to get an insight into the field of the study and a general view about topic was established. The conceptual framework represents the foundation of the topic, and the authors developed the conceptual framework through secondary data. In this research secondary data has been taken from online sources such as different journals, articles and literature that were available in the Mälardalens University databases like Emerald, Diva, Wiley online library and Google Scholar. As Bryman & Bell, (2007) stated secondary data refers to the data such as literature, documents and articles that is collected by other researchers and institutions. The second part of theoretical data came from academic books, which were studied during our Masters program, or the books that were
3.5 Questionnaire
A questionnaire can be distributed in different ways. It can be sent online by email or can be distributed through social media like Face book (Bryman & Bell, 2007, p.240) .It was handed out at different busy locations like departments of Mälardalens University and shopping mall at “stora gatan” in central Västerås. This research questionnaire was distributed online by using MDH e-mail online database and social media network like Face book. The online survey form was sent by email to 369 Generation Y students studying at MDH. The email addresses of these students were obtained from MDH database administrator.
As described in theoretical framework Generation Y are renowned for their online activity and this method was considered suitable for this research. The places and online medium have been chosen due to easy accessibility and time constraints. The questions in the survey were same for all groups of people born between (1977-1995) to obtain a uniform and valid result. The use of closed-ended questionnaire helped to save time and to make it more convenient for respondents (Bryman & Bell, 2007).
Different variables like brand loyalty, brand image, perceived brand quality, customer satisfaction, brand experience and switching cost were included in the questionnaire. Use of different media for collecting data helped to achieve a diverse and random sample. This diverse sampling technique enhanced credibility and authenticity of the research sample. In light of Fisher’s (2007) suggestion that a larger sample size will offer more accurate research results, this diverse sampling technique was useful to achieve a large sample size. The questionnaire for survey was both in English and Swedish language, as intended target group was Swedish Generation Y.
3.5.1 Sample Population
The intended target group for this study was people born between (1977-1995) classified as Generation Y, and living in Sweden. The authors conducted the survey from April 22 until April 30, 2013. Fisher (2007) pointed out that an appropriate sample size could result in correct and reliable research. Responses from 380 respondents were used keeping in mind error margin. A non probability sampling method for survey questionnaire was used due to time and resources limitations. Survey questionnaire was distributed both by online medium like emails (369 emails to MDH students), Face book groups and manual distribution at different places in Västerås. It was done among people belong to Generation Y to find out their cellular brand loyalty behaviors. The internet medium, MDH campus and other places in Västerås were chosen for distribution of questionnaire, keeping in mind the ease of accessibility of Generation Y at these platforms.
3.5.2 Questionnaire Distribution
The manual data collection took place at MDH University faculties, central train and bus station in Västerås and shopping malls at “stora gatan” in central Västerås. The sampling sites were chosen as people from different part of the city visit these places and it is easy to get access to
people belonging to Generation Y. These places increase the chance to reach many people belonging to Generation Y and who are currently using different cell brands. A questionnaire can be distributed in several forms such as by mail, where the questionnaire is sent to the respondent’s mailbox and can also be handed out in certain locations to reach certain groups (Bryman & Bell, 2007, p.240).
Questionnaire was distributed online as well using MDH email database and students Face book groups to collect data from a diverse group of Generation Y. In case of manual distribution, the questionnaires have been filled on the spot by young people who are using cell phones of different companies. The target group was Generation Y or people born between (1977-1995). Bus stops and train stations were good places to collect data when people were waiting for their train and buses. Data was collected from students waiting for their meal or coffee in MDH restaurant, so they could pay attention to fill the questionnaire. Although 369 emails requests were sent to MDH Swedish Generation Y students and the survey questionnaire was also posted at MDH students Face book groups, but unfortunately there was not a great response as only 45 respondents filled online Survey form. A majority of survey forms ( 362) were distributed manually by both the co-authors of this research. The authors conducted the survey from April 22 until April 30, 2013. A total of 407 responses were collected (both manual and online,362 and 45).Out of a total of 407 respondents, 27 respondents which did not match with criterion of the research were ignored. It means, a data obtained from 380 respondents was used for this study.
3.5.3 Questionnaire Design
The questionnaires have been designed in survey based on the conceptual framework. Each question has been analyzed from different aspects of brand loyalty. The aimed target for this study was young Swedish customers and factors influencing their cell phone brand loyalty. The questionnaire was designed in both English and Swedish languages considering that target audiences were Swedish citizens.
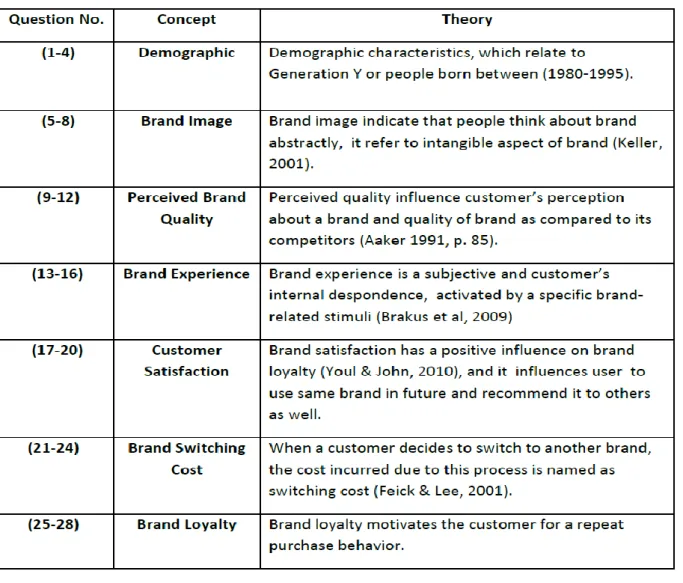
As stated below in table 1, there are total seven parts for the questionnaire; each part consists of questions related to the research topic and conceptual framework.
Part one consisted of questions (1-4), which identify the demographic of the respondents, where questions related to age, gender, educational background and nationality were asked. Part 2 contained questions (5-8), which identify cell phone brand image in different customer’s mind. There were four questions in part 3 (9-12) that covered perceived quality and asked respondent about the quality and durability of their mobile phone. Part 4 consisted of questions (13-16) and covered statements related to the brand experience and customers feeling and experience about their cell brand. Part 5 consisted of questions (17-20) , which covered customers satisfaction. Brand performance, expectation and overall satisfaction were the core area of this part. The part 6 consisted of questions (21-24) and the questions were related to the switching
customers willingness to remain loyal to their mobile phone’s company. The operationalization process has been shown below, in Table 1.
Table 1 Questionnaire Design
3.5.4 Analyzing the Data
The cross tabulation is a tool which is used in questionnaire analysis.Cross tabulation helps to compare each individual respondent’s answer to each question (Fishe, 2007). This method was used to analyze answers by respondents to each question.
The obtained answers from questionnaires were transferred to the excel sheet in order to classify and analyze them. Then a report was confirmed on the questionnaire, which allowed to compare the results of the respondent’s answer to the questionnaires. In this way the trends of the respondents could be identified and then each answer was analyzed in detail.
3.6 Reliability and Validity
It is important to consider the available methodologies, which focus on “reliability” and “validity”. Reliability refers to the degree of the results’ consistency under the same conditions. It should remain same if research has to be repeated. Validity refers to the strength of the used research materials, which determines the results of the research (Fisher, 2007).
Reliability of primary data is very important. It was tried to sustain a high level of reliability for primary data. After questionnaires have been filled in and completed by respondents. Those answers were transferred to excel sheets independently by both the authors of this study. Afterward the results have been double checked, in order to avoid any mistakes. When the excel sheets have been compared and some mistakes were found, those were compared with questionnaire file again and such mistakes were rectified. To obtain more reliable answers, personal opinions of the respondents was made sure, by on the spot filling of the survey forms. There was a possibility that they did not fill the questionnaire themselves and get help from other person, If questionnaire form was given to them to be collect later. Also reliability of secondary data for theoretical purpose has been made sure, as it has been collected from reliable sources like university databases, journals and academic books written by researchers, professors and doctors.
Validity of research is the techniques and methods used for collecting quality data and the analysis of the data in a valid and reliable fashion, and a clear understanding of reliability and validity need to be present during all phases of the study (Patton, 1999). Similarly validity shows, how well a variable measures, moreover validity of research is concerned with the use of suitable instrument for the research.
In terms of validity of primary data for this research, the questionnaires related to the conceptual framework and research topic was designed. It helped to gather responses about brand loyalty behavior of Generation Y. In case of secondary data, the theoretical background was developed based on previous relevant research. Moreover, only relevant articles and literature from academic, scientific and marketing databases was used for this study.
3.7 Limitation of Research
The research was carried out through a survey questionnaires by email to MDH students, social networks like Face book, and distribution of questionnaires forms at MDH campus in Västerås, central train and bus station in Västerås and shopping mall at “stora gatan” in central Västerås. The distribution of survey forms at these locations was done, as it was expected that the target group for this thesis is going to be easily available there. Furthermore, this study aimed to focus only on Generation Y’s cell phone brand loyalty and it did not examine other generations. This research was focused on cell phone brand loyalty of Generation Y, the findings and recommendations could be valid for mobile phones industry only. The population sample chosen for this research was mostly from people studying at MDH in Västerås, as majority of the
limitations, they were easily accessible. The thesis did not evaluate brand loyalty for any particular cell brand or cell phone company. Finally, although a sample of 380 respondents was chosen, still it is difficult to say if it can be generalized for whole Swedish Generation Y due to location limitation and possible behavioral differences.
3.8 Research Ethics
The Research Ethic Framework states that a study should have high quality, researchers and participants should be fully informed about the nature and content of the research, confidential and anonymously process, voluntary, independent and any prejudice and bias clarified in order to be considered ethical (Bryman, 2007, p.128).
For this research the respondents were briefed about the research topic and they identified the authors of this research. Moreover, the answers have been anonymous and the data has been used just for the thesis. An effort was made to link the analysis and conclusion part to both primary and secondary data to decrease the prejudice and bias for the readers. This study avoided plagiarism practices and respected the previous studies. The complete information about the previous writers was mentioned both in the text and reference list, according to APA reference system.
4. Findings
This chapter gives an overview of the empirical findings based on the questionnaire survey. It presents the results in graphical presentation or charts where necessary and it discusses each question
4.1 Demographics:
A total of 407 responses were received through online and on spot survey, out of which 27 were ignored as they did not match the age group and nationality requirements of the conducted research. So, a total of 380 responses have been taken into consideration for the analysis. This section gives demonstrate the demographic characteristics of the respondents, consisting of Questions 1 to 4 of the survey conducted. The 380 accepted responses all had Swedish nationality as per goal of this survey to study the brand loyalty of Swedish Generation Y. The respondents over age group 36 or older have been ignored for the purpose of studying and analyzing habits of Generation Y only. The gender distribution of the respondents is 53% females 47% males. Majority of respondents belong to age group (21-25) years with 54% followed by (18-20) years which is 17%, (26-30) years having 18% and age group (31-35) have the minimum representation at 7%. Questions (1-4) Gender Male 47% Female 53% Table 2 Gender Age 18-20 years 21% 21-25 years 54% 26-30 years 18% 31-35 years 7% Nationality Swedish 100% Education High School 70% Professional Education 7% Bachelor’s Degree 17% Master’s Degree 6% Table 3 Age Table 4 Nationality
4.2 Brand Image
Question 5. “Other people judge me by the kind of mobile phone I use”
15% 34% 23% 16% 12% Strongly Disagree Disagree Uncertain Agree Strongly Agree Figure 4
When asked about above statement 34% of the respondents have chosen “disagree” and 15% selected “strongly disagree”. It means a total of 49% respondents disagreed with the above statement. 16% replied, “Agree” and 12% of them have chosen “strongly agree”. Also there were 23% who selected “uncertain” from the options mentioned in figure 4.
Question.6 “I think my cell phone is well known and prestigious”
Figure 5
As shown in above figure 38% of Generation Y opted for “agree” and 36% chose “strongly agree”. It was discovered that around 74% of the respondents thought that their mobile phone is well known and prestigious. Just 6% opted for “disagree” option and 9% chose “strongly disagree”. 11% of the respondents selected “uncertain” option.
Question.7 “I think my cell phone brand is fashionable and elegant”
When asked about brand being fashionable and elegant 42% of the respondents replied “strongly agree” and 33% chose “agree”. It shows more than half of respondents stated that their mobile phone is fashionable and elegant. A total of 10% of respondents chose the option “disagree” and “strongly disagree” whereas 15% of them were uncertain.
Question.8 “I think my cell phone is number one among cell phone brands”
Figure 7
The majority of respondents agreed with above statement, option “strongly agree” was chosen by 38% and “agree” by 20%. Whereas, 22% of respondents were “uncertain” about that. Only 13% have chosen “disagree” and 7% opted for “strongly disagree” as shown in figure 7.
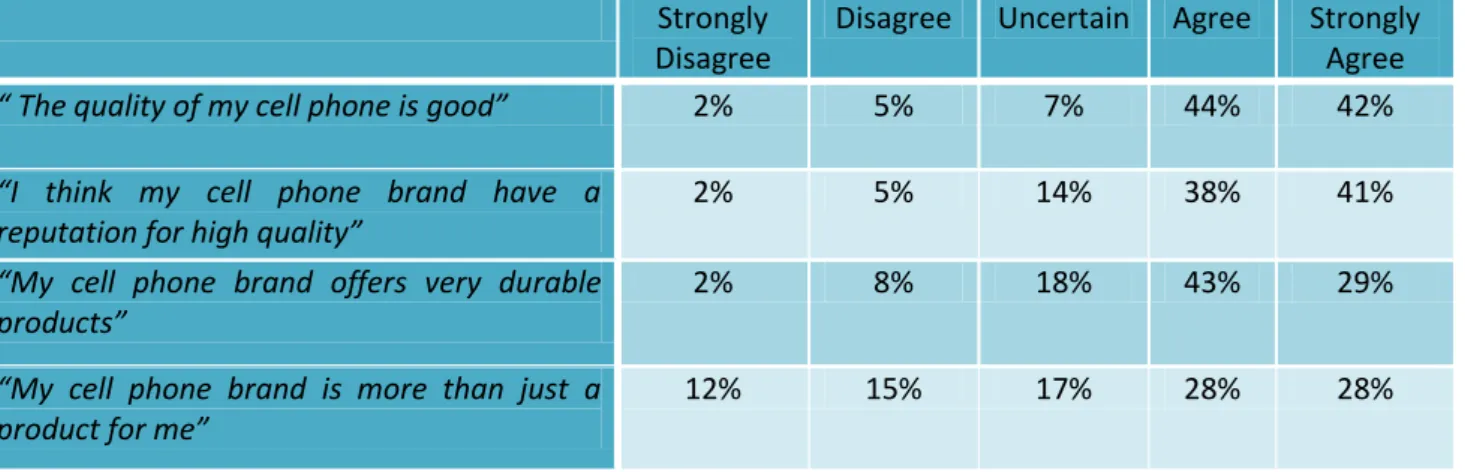
4.3 Perceived Brand Quality
Question.9 “The quality of my cell phone is good”
Figure 8
As shown in above figure 8, 86% of the respondents agreed with the above mentioned statement 42% chose “strongly agree” and 44% “agree”. While, only 7% of respondents answered that they were “uncertain”, and about 7% of them disagreed with the statement.
When asked respondents about their cell phone brand having reputation of high quality, A vast majority of them agreed with that. As shown in figure 9, option “strongly agree” was chosen by 41% and 38% chose “agree”.Whereas 14% answered that they were “uncertain”. And 7% disagreed with the statement.
Question.11 “My cell phone brand offers very durable products” 2% 8% 18% 43% 29% Strongly Disagree Disagree Uncertain Agree Strongly Agree Figure 10
The majority of respondents (72%) agreed to some extent that their cell phone brand offered durable products as shown above in figure 10. However 18% of them were “uncertain” about that. And 10% disagreed with the statement.
Question.12 “My cell phone brand is more than just a product for me”
12% 15% 17% 28% 28% Strongly Disagree Disagree Uncertain Agree Strongly Agree Figure 11
Most of the respondents (56%) agreed that their cell phone brand is more than just a product for them. While 17% were uncertain and 27% disagreed with the statement, as shown above in figure 11.
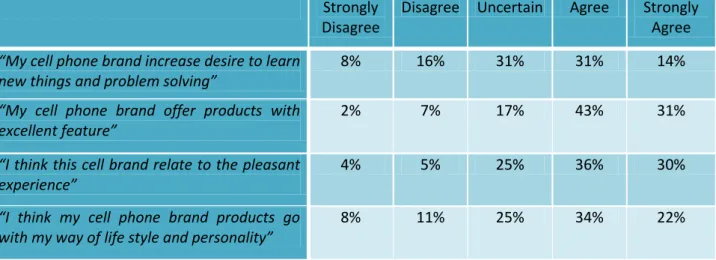
4.4 Brand Experience
Figure 12
Around 45% of the respondents agreed (31% “agree” and 14% “strongly agree”) that their cell brand increase desire to learn new things and problem solving. More than one quarter 31% were “uncertain” on that. Whereas 16% chose “disagree” and only 6% were “strongly disagree” with the statement, as shown above in figure 12.
Question.14 “My cell brand offer products with excellent feature”
2% 7% 17% 43% 31% Strongly Disagree Disagree Uncertain Figure 13
When asked about their cell phone brand feature, a majority of the respondents (73%) agreed, (43% “agree” and 31% “strongly agree”) with that. Whereas 17% of them answered they were “uncertain”. A small percentage 9% did not agree with the statement (2% “strongly disagree” and 7% “disagree”) as shown above in figure 13.
The majority of the respondents 66% agreed with the above statement (“strongly agree” 30% and “agree” 36%). While 25% of them were “uncertain” and a total of 9% of respondents chose to disagree (“strongly disagree” 4% and “disagree” 5%) as shown above in figure 14.
Question.16 “I think my cell phone brand products go with my way of life style and personality” 8% 11% 25% 34% 22% Strongly Disagree Disagree Uncertain Figure 15
More than half of the respondents 56% agreed that their cell phone brand products go with their way of lifestyle and personality (“agree” 34% and “strongly agree” 22%). While 25% were “uncertain” about that, and just 8% chose the option “strongly disagree” and 11% replied “disagree” as shown in figure 15.
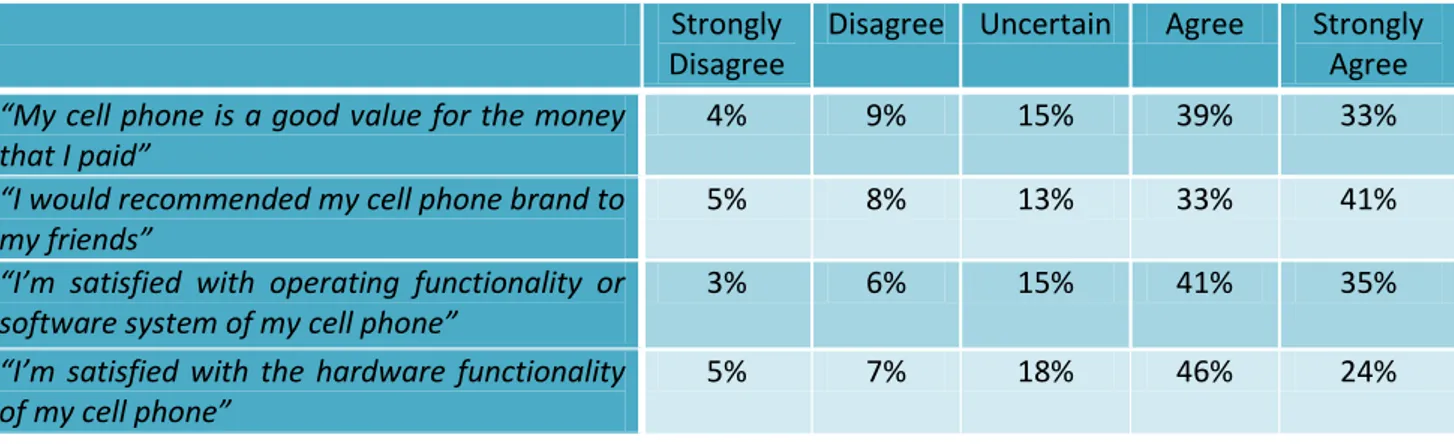
4.5 Customer Satisfaction
Question.17 “My cell phone is a good value for the money I paid”
4% 9% 15% 39% 33% Strongly Disagree Disagree Uncertain Figure 16
When asked about the good value for the money they paid for their cell phone , more than half of respondents (72%) stated that they agreed, (“agree” 33% and “strongly agree” 39%). On the
other hand 15% were “uncertain”.Whereas 4% have chosen “strongly disagree” and 9% have chosen to “disagree” with the statement, as shown in figure 16.
Question.18“I would recommended my cell phone brand to my friends”
For this question 41% of respondents replied “strongly agree” and 33% have chosen “agree” , it means they would recommended their cell phone brand to their friends. Just 13% respondents indicated they were “uncertain” about that. However 5% have chosen “strongly disagree” and 8% opted for “disagree” option, as demonstrated in figure 17.
Question.19 “I’m satisfied with the hardware functionality of my cell phone”
5% 7% 18% 46% 24% Strongly Disagree Disagree Uncertain Agree Strongly Agree Figure 18
According to above question which asked respondents about hardware functionality of their mobile, more than half of them 70% (“agree 46%” and “strongly agree 24%”) agreed with the question, and it showed that they were satisfied with the hardware functionality of their mobile phone. However 18% of them were uncertain and 12 % disagreed with the statement as shown in figure 18.
3% 6% 15% 41% 35% Strongly Disagree Disagree Uncertain Agree Strongly Agree Figure 19
The majority of respondents 76% agreed (“agree” 41% and “strongly agrees” 35%) that they were satisfied with software functionality of their cell phone. While 15% were uncertain about it and only 9% disagreed about that, as shown in figure 19.
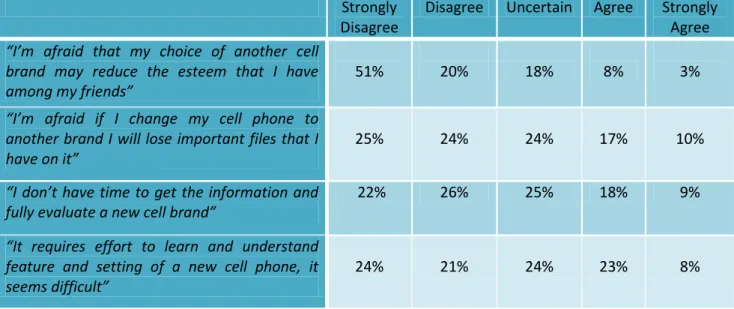
4.6 Switching Cost
Question.21 “I’m afraid that my choice of another cell brand may reduce the esteem I have among my friends” 51% 20% 18% 8% 3% Strongly Disagree Disagree Uncertain Figure 20
A majority of respondents (71%) disagreed (“strongly disagree 51%” and “disagree 20%”), with above mentioned statement. While, 18% of respondents were “uncertain” about it and a total of 11% agreed to some extent, as demonstrated in figure 20.
Question.22 “ I am afraid that if I change my cell phone to another brand I will lose important files that I have on it”
Figure 21
Almost Half of the all respondents 49% disagreed (“strongly disagree 25%” and “disagree 24%”) that if they changed their cell phone to another they would lose their important files. Whereas
one quarter of them 24% were “uncertain” about that. However a total of 17 % agreed to above mentioned statement, as shown in figure 21.
Question.23 “I don’t have time to get the information and fully evaluate a new cell brand”
Figure 22
For this question about half of the respondents 48% didn’t agree (strongly disagree 22% and disagree 26%), that they don’t have time to get the information and evaluate new cell phone. Almost a quarter of them were “uncertain” about that, and 27% agreed with the statement, as demonstrate in the figure 22.
Question.24 “It requires effort to learn and understand features and setting of a new cell phone, it seems difficult”
Figure 23
About half of the respondents did not agree (“strongly disagree 24%” and “disagree 21%”) with the statement, that it required effort to learn features and setting of a new cell phone. 24% of them have chosen option “uncertain” while 31% agreed to some extent, it has been demonstrated in figure 23.
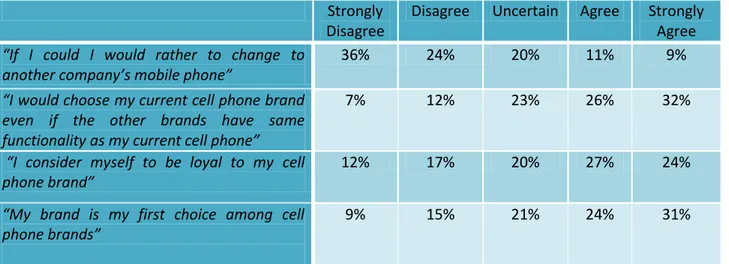
4.7 Brand Loyalty
Figure 24
When asked about above statement 36% of the respondents answered “strongly disagree” and 24% “disagree”, whereas 20% of them were “uncertain” to change. About 20% agreed with the above stated statement to some extent. Therefore according to the percentage shown in figure 24, a majority of respondent did not want to change to another company’s mobile.
Question.26 “I would choose my current cell phone brand even if the other brands has the same functionality as my current cell phone”
Figure 25
As shown above in figure 25, 32% of the respondents answered “strongly agree” and 26% of them have chosen “agree” when asked about above statement, it means that a majority of respondents wouldn't choose another brand with the same functionality as their current cell phone. Also 23% of them were “uncertain” about switching to another one with same functionality. While just 12% replied “disagree” and 7% have chosen “strongly disagree”, option. Question.27 “I consider myself to be loyal to my cell phone
brand”
Around half of the respondents 51% agreed to above statement (“agree 27% and strongly agree 24 %”). 20% of respondents were uncertain about that, and a total of 29% disagreed with the statement. It has been shown above in figure 26.
Question.28 “My brand is my first choice among cell phone brands”
Figure 27
Most of the respondents when asked about above question replied positively (“strongly agree” with 31% and “agree” with 24%), it means 55% of them agreed that they would choose their current mobile phone brand among other brands. However 21% of them were “uncertain”. Moreover a total of 24% disagreed with the above statement. It has been shown above in figure 27.
5. Analysis
This chapter gives an overall analysis based on empirical finding (chapter 4) and conceptual framework (chapter 2).
5.1 Brand Image
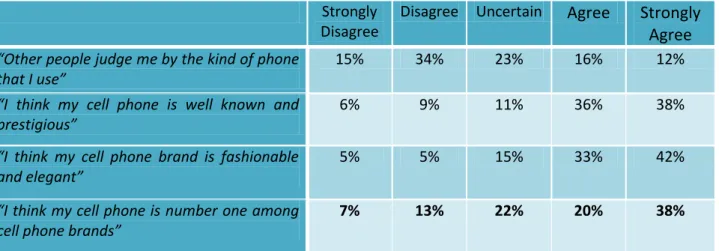
According to theories mentioned in chapter two, Swedish Generation Y customers use brand for their self-expression, but the result of the survey shows that most of the Generation Y users believed they weren’t judge by the kind of cell phone they use and just 28% agreed with the statement. It shows that the number of respondents who disagreed (49%) is higher than those who agreed.
Strongly Disagree
Disagree Uncertain Agree Strongly
Agree “Other people judge me by the kind of phone
that I use”
15% 34% 23% 16% 12%
“I think my cell phone is well known and prestigious”
6% 9% 11% 36% 38%
“I think my cell phone brand is fashionable and elegant”
5% 5% 15% 33% 42%
“I think my cell phone is number one among cell phone brands”
7% 13% 22% 20% 38%
Table 6 Brand Image
It was mentioned that Generation Y prefers to use brand that have good feel and image (Pendergast et al, 2009). With regards to scores obtained from the respondents in finding part and as shown in table 6, it reveals that brand image is an important factor for Generation Y as compared to other generations. For instance, Generation X customers are value oriented. Also the scores showed more than half of the respondent thought their cell phone brand is prestigious and well known. This is supported by Pendergast et al, (2009) view that Generation Y has an image that relates them to success, wealth, class and style. Around 75% of respondents agreed that their mobile phone is number one, fashionable and elegant. The result of the findings shows that brand image is one of the factors, which could lead to brand loyalty in Generation Y.
Also, the findings show that the Swedish Generation Y use cell brand to satisfy their self-expression and don’t care what other people think about them. The important thing for them is that their mobile phone has fashionable, prestigious and well known features. A good brand image improves their positive feelings about the brand and it also enhances their prestige among their friends. It is also evident from findings that more than half of the Generation Y believed that their cell brand is amongst the best brand in the market. This indicate that the young Swedish consumers have a good image of their brand, which are qualities of a satisfied,
likes and committed buyers, as shown by Aaker's brand loyalty pyramid in chapter two of this paper. The satisfaction and confident shown by Generation Y in their cell phone brand image, establishes that brand image can play an important role to influence customer's brand loyalty.
5.2 Perceived Brand Quality
According to theories stated in chapter 2, perceived brand quality influences customer loyalty and increases retention rate. The quality of a brand influence brand loyalty of a customer (Aaker 1991, p. 85).
Strongly Disagree
Disagree Uncertain Agree Strongly
Agree
“ The quality of my cell phone is good” 2% 5% 7% 44% 42%
“I think my cell phone brand have a reputation for high quality”
2% 5% 14% 38% 41%
“My cell phone brand offers very durable products”
2% 8% 18% 43% 29%
“My cell phone brand is more than just a product for me”
12% 15% 17% 28% 28%
Table 7 Perceived Brand Quality
When Generation Y was asked about quality of their cell phone a majority of them 86% as shown in table 7, acknowledged that quality of their cell phone was good. It strengthens Aaker point of view that a good quality of a brand have a positive influence on brand loyalty. According to Aaker a better quality of a brand helps consumer to differentiate a brand from another and it also enhances its reputation. A large number of (79%) of Swedish Generation Y believed that their cell phone brand has a good reputation from quality perspectives. Similarly 72% of consumers thought that their cell phone was durable. As Bruks & Naylar, (2000) pointed out prestige features; durability and excellent performance of a cell phone are important criterion for the assessment of the quality of a cell brand.
The higher percentages of the findings showing the satisfaction of young Swedish people with their cell phone demonstrate that quality of the cell phone was good. The satisfaction with the quality of their cell phone improved the chances of Generation Y to be loyal to their brand. This was surprisingly in contrast to the theories mentioned in chapter 2, where it was stated that Generation Y was not a loyal group of customers. After analysis of the findings it can be established that quality of a brand is one of the main factor influencing brand loyalty of Generation Y. Moreover, it can also be established that cell phone manufacturers can win the trust and loyalty of young customers by manufacturing a product having superior quality.