Everyone Prefers a Loyal One!
The Effect of Multisensory perceptions on Brand Experience and Brand
loyalty: Case of Pringles Potato Chips
MASTER THESIS WITHIN: BUSINESS ADMINISTATION NUMBER OF CREDITS: 15 ECTS
PROGRAMME OF STUDY: INTERNATIONAL MARKETING AUTHOR: Mahtab Habibi Savadkouhi & Ruben Herman Jut JÖNKÖPING May 2020
ii
Master Thesis in Business Administration
Title: Everyone Prefers a Loyal One: The Effect of Multisensory perceptions on Brand
Experience and Brand loyalty: Case of Pringles Potato Chips
Authors: Mahtab Habibi Savadkouhi & Ruben Herman Jut Tutor: Jalal Ahamed
Date: 2020-05-18
Key terms: Multisensory perceptions, , Brand Experience, Brand Loyalty, Consumer Behavior,
Hofstede.
Acknowledgements
We are grateful to all of those whom we have had the pleasure to work with during this thesis, especially our supervisor Dr. Jalal Ahamed for his help and expertise as well as his constant availability when we had questions.
We would also like to thank our friends for contributing to a pleasant study environment during this period.
We also appreciate the kind support of our seniors. We benefited from their valuable feedback. and comments, especially Dr. Mohammad Habibi Savadkouhi, Dr. Ziba Habibi Lashkari, I.B. Cornelisse and E.A.T. Salemink B.
Finally, nobody has been more important to us in the pursuit of this thesis than the members of our families from a distance during the hard situation of COVID-19 pandemic.
Spring Semester, 2020
Jönköping 2020-05-18
iii
Abstract
BackgroundIn today’s competitive environment where consumers have several brand choices, creating brand loyalty is of high importance for the firm's survival. Organizations need to create exciting brand experiences that tempt customers to purchase continuously and remain loyal in order to differentiate from competitors. Loyal customers are assets of a certain brand. They are less likely to shift to competing brands, they spread positive word of mouth, they contribute to stable revenues, they are not influenced by bad publicity, they are more cost-effective to keep than to attract new ones, they are more eager to pay higher prices and make more frequent purchases than non-loyal customers.
Purpose
The purpose of the study is to examine the relationship between multisensory perceptions, brand experience and brand loyalty through the case of Pringles potato chips.
Method
A descriptive research with a quantitative method and a deductive approach has been used for this study. An online survey has been conducted to examine the relationship between multisensory perceptions influence on brand-experience and brand loyalty. Suitable respondents were the ones who bought Pringles potato chips before and were familiar with it.
Empirical findings and results
The findings indicate that among multisensory perceptions, only olfactory and haptic perceptions contributed significantly positive to the brand experience. The research also showed that all dimensions of brand experience, on either attitudinal brand loyalty or behavioral brand loyalty, were statistically significant with a positive relationship, except for the intellectual dimension. The data analyses show that for attitudinal brand loyalty, only the multisensory perception haptic had a statistically significant and positive impact while on behavioral brand loyalty only the perceptions gustatory and haptic had a statistically significant and positive impact.
iv
T
ABLE OFC
ONTENTS 1. INTRODUCTION ... 1 1.1BACKGROUND ... 1 1.2PURPOSE ... 6 1.3RESEARCH QUESTIONS ... 6 1.4DELIMITATIONS ... 6 1.5KEY TERMS ... 6 2. LITERATURE REVIEW ... 72.1PRINGLES POTATO CHIPS COMPANY BACKGROUND ... 7
2.2MULTISENSORY PERCEPTIONS ... 9
2.3BRAND EXPERIENCE ... 12
2.4BRAND EXPERIENCE AND MULTISENSORY PERCEPTIONS ... 13
2.5BRAND LOYALTY ... 14
2.6BRAND EXPERIENCE AND BRAND LOYALTY ... 15
3. METHODOLOGY ... 18 3.1.RESEARCH DESIGN ... 18 3.2.RESEARCH METHODS ... 19 3.3.RESEARCH STRATEGY ... 19 3.5.SAMPLE SIZE ... 20 3.6.PRE-TEST ... 21
3.7.DATA COLLECTION PROCESS ... 22
3.8.LIMITATIONS OF METHODOLOGY ... 22 3.9.VALIDITY ... 23 3.9.1.INTERNAL VALIDITY ... 23 3.9.2.EXTERNAL VALIDITY ... 23 3.9.3.CONSTRUCT VALIDITY ... 24 3.10.RELIABILITY ... 25 3.11.ETHICAL ISSUES ... 25 4. EMPIRICAL FINDINGS ... 26 4.1DATA CLEANING ... 26 4.2DESCRIPTIVE STATISTICS ... 27 4.3RELIABILITY ANALYSIS ... 28 4.4FACTOR ANALYSIS ... 28 4.5HYPOTHESIS TESTING ... 30 4.6CORRELATION ANALYSIS ... 32
4.7MULTIPLE REGRESSION ANALYSIS ... 35
v 5. DISCUSSION ... 55 5.1MULTISENSORY PERCEPTION ... 55 5.2BRAND EXPERIENCE ... 56 5.3BRAND LOYALTY ... 57 5.5IMPLICATIONS ... 60 6. CONCLUSION ... 62 6.1LIMITATIONS ... 64 6.2FURTHER RESEARCH ... 64 REFERENCES ... 66
vi
FIGURES
Figure 1: Conceptual framework ... 17
Figure 2: Research framework result multisensory perception to brand experience ... 50
Figure 3: Research framework result Brand experience to Brand Loyalty ... 51
Figure 4: Research framework result multisensory perception to brand loyalty ... 52
TABLES Table 1: Frequency of multisensory perceptions predictor ... 27
Table 2: Frequency of Brand Experience dimensions ... 27
Table 3: Reliability Statistics ... 28
Table 4: KMO and Bartlett's Test ... 29
Table 5: Summary of Hypotheses ... 30
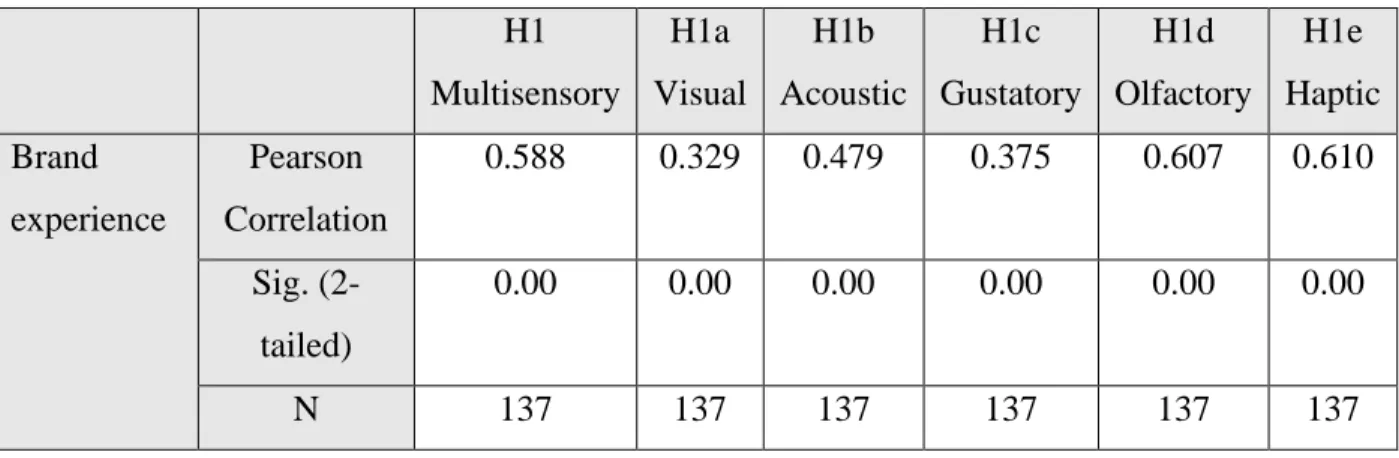
Table 6: Correlation Hypotheses 1, 1a, 1b, 1c, 1d and 1e ... 32
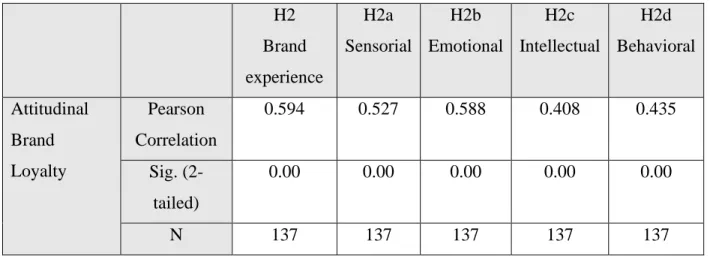
Table 7: Correlation Hypotheses 2, 2a, 2b, 2c, 2d ... 33
Table 8: Correlation Hypotheses 3, 3a, 3b, 3c, 3d ... 34
Table 9: Correlation Hypotheses 4, 4a, 4b, 4c, 4d and 4e ... 34
Table 10: Correlation Hypotheses 5, 5a, 5b, 5c, 5d and 5e ... 35
Table 11: Collinearity Statistics of Brand Experience ... 37
Table 12: R Square of Brand Experience ... 38
Table 13: Beta Value and Significance Brand Experience ... 38
Table 14: Collinearity Statistics of Attitudinal Brand Loyalty ... 40
Table 15: R Square of Attitudinal Brand Loyalty ... 40
Table 16: Beta Value and Significance Attitudinal Brand Loyalty ... 41
Table 17: R Square of Behavioral Brand Loyalty ... 42
Table 18: Beta Value and Significance Behavioral Brand Loyalty ... 43
Table 19: R Square of Attitudinal Brand Loyalty ... 44
Table 20: Beta Value and Significance Attitudinal Brand Loyalty ... 45
Table 21: R Square of Behavioral Brand Loyalty ... 46
Table 22: Beta Value and Significance Behavioral Brand Loyalty ... 47
Table 23: Summary of Hypotheses ... 47
Table 24: Country comparison (0 = low, 100 = high) (Hofstede Insights, 2020) ... 59
APPENDICES APPENDIX 1:QUESTIONNAIRE,ROTATED COMPONENT MATRIX ... 76
APPENDIX 2:SKEWNESS AND KURTOSIS ... 81
APPENDIX 3:NORMAL PROBABILITY PLOTS AND SCATTERPLOTS ... 82
APPENDIX 4:RESEARCH FRAMEWORK RESULTS ... 87
1
1. Introduction
______________________________________________________________________________
This chapter will present the background of the research. The definitions of brand loyalty, brand experience and multisensory perception are explained below. The research purpose, research questions as well as the delimitations to the study are presented to provide a vivid overview of the research.
The competition in the market environment is becoming harder as consumers have several brand choices, thus creating brand loyalty is of high importance for the firm's existence. Organizations need to create exciting brand experiences that tempt customers to purchase continuously and remain loyal to the brand in order to differentiate from competitors. Today’s marketplace has been through a big change, where we have gone from selling and promoting products and services to selling and enticing customers through experiences (Joy and Sherry, 2003). Consumers are spending more time making decisions about what to consume as the number of products and brands they can choose from has increased tremendously, making it harder and more time-consuming to decide what brands to buy.
1.1 Background
The first time that the marketing field paid attention to brand loyalty on an academic level was through Copeland’s study in 1923 (cited in Kabiraj and Shanmugan, 2011), to the extent of understanding that brand loyalty existed only at the behavioral level. The concept of brand loyalty has been recognized as an important construct in the marketing literature for at least four decades (Howard and Sheth, 1969), and most researchers agree that brand loyalty can generate firm benefits such as decreased marketing costs (Chaudhuri and Holbrook, 2001), positive word of mouth (Sutikno, 2011), business profitability (Kabiraj and Shanmugan, 2011), increased market share (Gounaris and Stathakopoulos, 2004) and a competitive advantage (Iglesias et al, 2011). These benefits show the positive effect of brand loyalty on the performance of a firm. Khan and Mahmood (2012, p. 33) suggested a definition as “brand loyalty can be defined as the customer’s unconditional commitment and a strong relationship with the brand, which is not likely to be affected under normal circumstances”. The importance of brand loyalty has been recognized in the literature for many years (Aaker, 1991; Dick and Basu, 1994; Chaudhuri and Holbrook, 2001).
2 Confronting the unstable nature of consumers’ demands, it is crucial for companies to attract and keep loyal customers to their brands (Keller, 2007). Loyal customers are assets of a brand. They are less likely to shift to competing brands (Eakuru and Mat, 2008), spread positive word of mouth (Deng and Lu and Wei, 2010; Shirsavarand Gilaninia and Almani, 2012), make stable revenues (Kang and Kim and Shin, 2007; Lee, 2010); not influenced by bad publicity (Deng et al., 2010); more cost-effective to keep than to attract new ones (Reichheld, 1996); more eager to pay higher prices (Jaiswal and Niraj, 2011) and make more frequent purchases than non-loyal customers (Rowley, 2005).
During the past decade, sensory perceptions in judgement and the decision-making process of consumers have seen a lot of interest from marketing as well as in psychology. Contemporary consumers are offered various choices of products and are sick and tired of all the advertisements, since most of the offers and advertisements are the same, consumers hardly can differentiate the most attractive and valuable offers (Šliburytė & Vaitieké, 2019). According to Šliburytė and Vaitiekė (2019), companies find it difficult to raise attention for their products and to stand out from other brands. Nowadays consumers do not base their decision rationally but mostly depending on emotions and how consumers feel.
Since the traditional mass markets are disappearing and being questioned to be profitable and successful to reach consumers there is a shift from mass marketing to the relationship and micromarketing (Belk, 2013). Belk (2013) states that customization and tailor-made products are the key to fulfill the needs of the consumers. According to Field (2001), the transition from mass marketing to a relationship and micromarketing is a paradigm shift. Dahl (2010) mentioned that the development of sensory marketing is expressed by Customer Relationship Management (CRM) and Customer-Specific Marketing (CSM).
Hussain (2019) emphasizes this by stating that sensory marketing is different from other kinds of marketing because it directly involves the consumer. Therefore, he claims that it could solve imminent marketing challenges (Hussain, 2019). Krishna (2011) states that sense-based emotional relations are long-lasting and substantial between companies and consumers.
Šliburytė and Vaitiekė (2019) describe that sensory marketing aims to use all five senses: sight, taste, touch, scent, and sound. They can be used to create a better, stronger and more important
3 brand communication that will last longer in the consumer's memory (Šliburytė & Vaitieké, 2019). For instance, the use of colors, backdrop music, ambient scents or a unique texture affects the consumers' sensorial, emotional, cognitive and relational consumers’ evaluation and behavior towards a product (Krishna, 2011) (Lindstrom, 2005). According to Hulten, Broweus, and Dijk (2009), a brand needs to get a good understanding of the human senses, by understanding the consumption process which involves individual behavior and the decision-making process, the company can take advantage of their brand opposite of another brand. Simonson and Schmitt (1997) state that the use of sensory marketing aims to give consumers a positive purchasing experience, satisfaction, and pleasure.
Lindstrom (2005) states that the greater the number of senses used in the marketing process the better connection between the brand and the consumers. Hulten (2009) emphasizes that the use of different types of sensory perceptions can improve in the strongest brand image and recognition and will be a long-lasting memory for consumers. Kahn and Deng (2010) highlighted that the use of more than one sensory perception in marketing can be considered as ‘multisensory marketing’. Multisensory perceptions are based on the idea that consumers will form, retain, and revisit their memories with the five senses engaged. Traditional marketing used mainly sight and sound for their advertisements, sensory marketing goes beyond the traditional marketing and is discovering the use of scent, taste, and touch.
Lwin, Morrin, and Krishna (2010) mentioned that one sense strengthens the imagery of another. Lwin et al. (2010) stated that visual and olfactory senses emerge to be the most influential of all senses. This kind of experiential marketing appeals to multiple senses and taps into a special place within the consumers' minds, which inspires thought of comfort and pleasure, which will lead to positive brand awareness and hopefully to positive purchase behavior. Multisensory perceptions are more present in the contemporary center of a company’s marketing strategy and tactic, this illustrates a new epoch in marketing (Kumar, 2014). Consumers become conscious and perceive firms and brands through the senses. Further knowledge about the human senses will make the marketing of a firm more successful to target consumers personally (Hultén, Broweus, & Van Dijk, 2009).
4 The five human senses are strong determinants of consumers buying decisions and can create brand loyal customers. According to Schiffman (1990), sight is the most dominant sense for consumers to draw attention or get attracted. Visuals have the power to persuade the consumer irrespective of the logic. Visual stimuli include logos, designs, packaging, advertisements and create a perception of quality that impacts the way consumers perceive the brand. That is why it is important to stand out with your brand and boost your purchase (Kahn & Deng, 2010). Scent is one of the least used senses in sensory marketing but according to Lwin et al. (2010) together with sight the most influential sense that affects the consumer. The scent evokes emotions, feelings, motivation and plays a critical role in consumer behavioral patterns (Hoffman & Turley, 2002). Scent is culturally related and therefore the perception of smell can differ from cultures (Hussain, 2019). The sense of touch is about physical interaction between the products or organizations and the consumers. According to Harker and Egan (2006), the texture of a product is an experienced trigger and will stick better to the consumers' memory. The material that is used, the surface, temperature, weight, and form enhance the touch experience. Hussain (2019) said: “Emotion for
a brand is deeper when touch is important for interaction with the customer” (Hussain, 2019,
p.40). Hulten et al. (2009) emphasize that through the sense of touch a series of connections are made in the brain and that will associate the material, surface, weight and so on with enjoyment, warmth or other associations. When the consumer touches a product the chances of customer satisfaction and emotional connection will increase as well as the chances for purchasing (Hussain, 2019; Gobe, 2010).
The sense of sound is as common in traditional marketing as sight and visuals. Since the upcoming of television and radio, companies have tried to amplify their visual advertisement with sounds to make it more dramatic or enhance an idea (Hultén, Broweus, & Van Dijk, 2009). Music evokes feelings such as calmness, satisfaction, excitement, and sadness and the brand or product will be remembered better by the consumers (Schiffman, 1990). Hussain (2019) mentioned that sound offers consumers an important connection to reality and has a defensive function, it alerts us to danger and promotes peace of mind for the soul. Without music, advertisements would be less contrast full, less informative and less attention demanding. Hulten et al. (2009) stated that ‘taste’ is more than just consuming a product. It is about the multisensory experience since the sense of
5 taste cannot be judged only by how it tastes but also the texture, how it looks like and how it sounds.
The sense of taste is dependent on other senses. Hussain (2019) mentioned that up until now almost only the food industry implemented the sense of taste. The taste sense together with the smell sense are two senses that are least used in sensory marketing but have both one of the biggest influences on how a consumer perceives a brand and creates a long-lasting memory. On the other hand, Hulten et al. (2009) mentioned that companies use the sense of taste less because consumers cannot describe or express their taste preferences and sensory perceptions. But according to Babin, Hardesty and Suter (2003), the gesture and stimulation of the taste sense will increase sales and customer retention.
Around three decades ago, Holbrook et al. (1982), introduced the concept of experience in the marketing literature, and since then it continues to influence multiple areas such as economics (Pine and Gilmore, 1998), consumer behavior (Addis and Holbrook, 2001), and marketing (Brakus et al., 2009; Schmitt, 1999). The concept of brand experience first appears in the work of Gilmore and Pine (1999) and Schmitt (1999). Brand experience is defined as ‘consumers’ behavioral reactions aroused through brand stimulants including the brand design, identity, packaging, communication, and environment with subjective consumer reactions’ and it consists of sensory, emotional, behavioral, and intellectual experiences and can be either positive or negative, which have long lasting effects on consumer behavior (Brakus, Schmitt, and Zarantonello, 2009). In recent years, both academics and marketing practitioners have established the importance to manage the customer’s experience to achieve value creation (Berry et al., 2002; Iglesias et al., 2010). So, marketing is shifting its focus from quality to experience (Klaus and Maklan, 2013), and it is therefore becoming increasingly important to be able to define and develop brand experience if organizations are willing to earn a competitive advantage in the market (Ismail, 2011). With the increased importance of customer experience, many products and services are designed to generate their memorable experiences, such as Apple’s iPhone, Body Shop, Harley-Davidson, Disney theme parks and WHotels (Pine II and Gilmore, 2011; Schmitt and Rogers, 2008). Prior research on customer experience also suggested this important shift from brand benefits to brand experience (Barnes et al., 2014; Dagger and David, 2012).
6
1.2 Purpose
The aim of the study is to investigate if and to what extent customers' multisensory perceptions lead to brand loyalty and influence brand experience on Pringles potato chips.
Pringles potato chips is an American brand of potato and wheat-based stackable snack chips. It is owned by Kellogg 's. Originally developed by Procter & Gamble (P&G) in 1967, and marketed as "Pringles Newfangled Potato Chips", the brand was sold to Kellogg's in 2012. As of 2011, Pringles is sold in more than 140 countries.The Pringles brand is known internationally and would give the study the chance to examine it in different regions.
The study will be followed by literature review. Then the methodology will be discussed in chapter three. In the fourth chapter, the data and findings will be analyzed, and the fifth chapter will present discussion and the research will come to a conclusion in chapter six.
1.3 Research Questions
1. Is there a relationship between multisensory perceptions and brand experience? 2. Is there a relationship between brand experience and brand loyalty?
3. Is there a relationship between multisensory perceptions and brand loyalty?
4. Will positive brand experience gain through multisensory perceptions increase brand loyalty?
1.4 Delimitations
This study focuses on one product and brand, namely Pringles potato chips. Since this is an international product that most of the senses are applicable for, but the results, might be different for other category of products/services.
1.5 Key terms
7
2. Literature Review
______________________________________________________________________________
This chapter provides a review of relevant literature regarding the relationship between multisensory perceptions, brand experience and brand loyalty. It starts with a brief introduction of Pringles’ potato chips company as the picked product to conduct this study, multisensory perceptions, brand experience and brand loyalty. Then, it reviews empirical studies regarding the relationship between these three constructs.
______________________________________________________________________________ The grand theory to conduct this study is to find the right brand perceptions and experiences of customers to increase their brand loyalty. Strategic brand management has been considered as the key to the development of competitive advantage over rivals. The brand relationship theory suggests that brand acts as a connection device for both consumers and suppliers (Chang & Chieng, 2006). As said by Smith and Brynjolfsson (2001), brand is an important factor affecting consumers’ choice, and it helps customers to find a specific vendor for a given product or service. Therefore, the brand has been emphasized as an important marketing tool to distinguish a product/service category from its competitors.
In today’s complicated environment, the possibility of differentiating brands depends on their ability to create top consumer experiences that can engage consumers in a long-term relationship. Therefore, managing brand experience is one of the crucial challenges marketing managers currently affected with. Lately, brand experience is recognized as important factors that link to desirable outcomes in brand loyalty (Baek, Kim, & Yu, 2010; Brakus, Schmitt, & Zarantonello, 2009; Ekinci & Hosany, 2006; Ha & Perks, 2005; Lee, Back, & Kim, 2009).
2.1 Pringles potato chips company background
In the late 1960’s, the category for stacked potato chips started with the brand Pringles by P&G (Borkovsky, Goldfarb. Haviv and Moorthy, 2017). P&G wanted to distribute the chips over its existing distribution network and didn’t want it to spoil during transit. Therefore, P&G packed the chips in nitrogen which necessitated an airtight seal, which led to the now-familiar cylindrical containers. This enhanced functionality contributes to the identity of the brand. The user-friendly canister/container is an example of enhanced functionality and brand identity since every customer relates the container to the brand of Pringles (Underwood, 2003).
8 According to Gupta, Raj and Wilemon (1985), the development of the New-Fangled potato chips from Pringles took over a decade. They tested their potato chips in 1968 and got national distribution in the US in 1975. After several complaints about the ‘plastic’ tasted chips they changed and improved the chips and Pringles increased its advertising budget. Through this experience, Pringles learned that technology alone won’t make it a successful product (Gupta, Raj, & Wilemon, 1985). In the mid-1990s, the company had an estimated annual sale of 1 billion dollars (Borkovsky, Goldfarb, Haviv, & Moorthy, 2017). Borkovsky et al. (2017) stated that Pringles had a monopoly within the stacked potato chip industry until the fourth quarter of 2003. At that time Lays entered the stacked potato chip industry with their brand STAX and from then onwards it was a duopoly. In 2001, the estimated Pringles brand value was 2.1 billion dollars. When Lays entered the market with its brand STAX, the market value of Pringles declined with 137 million dollars (Borkovsky et al., 2017). STAX brand value always stayed below the brand value of Pringles. In 2012, the brand Pringles was sold to Kellogg’s for about 2,7 billion dollars (De la Merced, 2012).
Pringles has a variety of flavors, namely sixteen different flavors of potato chips. Pringles consciously chose, within their marketing strategy, to offer sixteen different flavors to influence consumer decisions. Pringles is a product with low customer involvement and therefore customers seek variety. Since there are a lot of different potato chips choices, most of the customers are not loyal and easily switch between brands. Customers use their sense of taste during consumption of the potato chips. The future decision of buying Pringles will be based upon past experiences, if these experiences were pleasant, it is most likely that they will repeat their purchase. The strategy of Pringles is that if the experience is satisfactory, they are more likely to try another taste but still from their portfolio. Pringles periodically enter the market with a new flavor for customers who are curious and want something new. The new flavor will first be tested by a small panel before launching it (J. Jones, 2019).
Pringles planned to engage with their customers to create experiences and use different marketing strategies to reach this goal. For instance, the #YouDontJustEatEm campaign where Pringles tries to interact and co-create ideas of what else they could do with Pringles instead of just eating them.
9 Pringles even opened a special co-creative platform eYeka to further engage with their customers (Vijaykar, 2014).
Zampini and Spence (2004) conducted research on the noise frequencies of biting in potato chips from Pringles. They mentioned that all sounds above 2kHz were perceived as crispier and fresher. These evaluations are based upon sensory perceptions retrieved from the five human senses. The evaluation of a food-related product is obtained through multisensory perceptions. For instance, the sound produced when biting in potato chips, together with the visual, olfactory and gustatory cues determine if the product is still good (Zampini & Spence, 2004). The research on other sensory stimuli is missing in the literature.
2.2 Multisensory Perceptions
Shabgou and Daryani (2014) state that the use of senses; seeing, tasting, smelling, hearing and touching a product is important in giving customers perception and understanding about that product. Perceiving these senses gives customers an image about their daily life, how they perceive products and the way they satisfy their needs and desires. Hulten, Broweus and van Dijk, (2009) emphasized that the five senses are of crucial importance for customers to be aware of and perceive products and brands through them. Every sense contributes to the customers' experience and forms the foundation for their sensory experience. Hulten (2011) defined sensory experience as an individual’s perception of goods and services as an image that challenges the human mind and senses. He mentioned that sensory perceptions evoke favorable emotions and create a positive atmosphere around the brand as well as focus on differentiating, distinguishing and positioning brands in the human mind. Every sense used in sensory marketing aims to give customers a positive purchase experience, satisfaction, and pleasure, which will contribute to a positive overall brand experience (Simonson & Schmitt, 1997). Through the use of the five senses, brands have great potential to differentiate themselves, since sense-based emotional relations are long-lasting (Krishna, 2011; Hulten, Broweus, & van Dijk, 2009). Sensory perceptions are innovative solutions to give customers the opportunity to perceive and experience products and services (Heitzler, Asbury, & Kusner, 2008).
10 According to Shabgou and Daryani (2014), sight is the strongest and most used sense in marketing. Colors and lighting are important to evoke pleasant hues and raise customers' buying intention (Hulten et al. 2009; Kellaris Kent, 1993). Furthermore, colors and lightning would encourage customers to touch the products, which would lead to more purchases (Summers & Hebert, 2001). Considering sound sense, a brand can benefit from background music to evoke emotions and feelings to improve the brand experience. Fournier (1998) stated that the tempo of music affects the perception of time and comfort as slow tempo relaxes the customers while fast tempo creates auditory arousal in its listeners (Cachero-Martinez & Vazquez-Casielles, 2017).
It has been said that consumers may perceive that time passes faster if they are in a scented environment (Spangenberg, Crowley & Henderson, 1996). However, the scent sense is an ignored sense in marketing (Hussain, 2019). But as Lindstrom (2005) said, customers cannot refuse scents, since it is in the air that they breathe. Pleasant scents used by brands will trigger memories and customers can easily identify them (Gobe, 2010).
Referring to the touch sense, it is the largest sensory organ of the human body and through physical contact with the skin, customers can feel the products and make judgments (Shabgou & Daryani, 2014). Customers create a judgment on the material, the weight of the products, the shape, and the temperature which would contribute to the overall touch experience and enhances customer loyalty (Rodrigues, Hulten, & Brito, 2011).
According to Grunert, Juhl, and Poulsen (2001), the taste sense can be experienced after purchasing the products, on forehand, the customer predicts the taste experience on factors such as price, brand, healthiness, freshness and quality label.
The importance of different senses may change during product usage periods. These various senses specialize in different types of information (Schifferstein, 2010), for example, during the purchase time, vision is the main sensory modality, while touch and audition develop to be more important during later stages (Fenko, Schifferstein & Hekkert, 2010).
Holbrook and Hirschman (1982) suggested that consumption partly relies on consumer fantasies, feelings and fun. Multisensory stimuli should be utilized to create enjoyment. Beckman et al.
11 (2013) found that sensory experience was a strong predictor of an individual’s place dependence, which provides emotional benefits to the individual. If consumers experience sensations, it is likely that they are willing to receive such stimulation again (Brakus et al., 2009). Therefore, consumers are encouraged to invest their behavioral inputs in the specific relationship.
Using all the sensory perceptions together can be done through a multisensory approach. An approach where more than one sense is simultaneously used, emotions and feelings can be intensified and linked to the overall experience of the brand (Hulten et al., 2009; Lindstrom, 2005). For instance, using the sense of sound would amplify the sense of sight as the senses are connected while experiencing music. Without sound, the sight sense will be less informative, less attention-demanding and less contrast full. The use of the scent sense would increase the visual imagery and would make customers remember the visual advertisements better (Lwin et al. 2010; Hussain, 2019). The scent and taste are inherent senses and scent strengthen the sense of taste. According to a study by Lindstrom (2005), if a customer is not able to smell the food, the perceived taste experience is reduced by 80 percent. Soars (2009) stated that the quality of the experience increases if you use a number of senses in a congruent way. However, Homburg, Imschloss and Kühnl (2012) emphasized that the use of three sensory stimuli makes customers, not per se sensory overloaded. But with three high arousal sensory stimuli customers may experience sensory overload. Thus, brands must prevent sensory overload and harmonize all the sensory stimuli to create an optimal and impactful experience (Krishna, 2012).
Krishna (2012) defined multisensory marketing as “a marketing strategy that engages the consumers' senses and affects their perception, judgment, and behavior” (p.333). Multisensory marketing could help to overcome the traditional marketing, in which customers feel overloaded with advertisements and information about all the products and brands they are exposed to (Šliburytė & Vaitieké, 2019). Customers are nowadays looking for brands that provide unique and memorable experiences for them (Wiedmann, Labenz, Haase & Hennigs, 2018; Moreira, Fortes & Santiago, 2017).
Hulten (2011) stated that a multisensory perception takes place if more than one of the five senses are being used simultaneously which contributes to the sensory perception of the customer. Verhoef et al (2009) pointed out that creating customer experiences is becoming one of the main
12 objectives in today´s retailing. The five senses can reinforce a positive feeling for a customer who will create a certain value towards the brand.
2.3 Brand Experience
Brand experience describes internal and subjective consumer responses, caused by brand-specific stimuli (Ishida and Taylor, 2012). The intensity of the brand experience varies according to the number of dimensions and its intensity. The intensity of the brand experience also varies by the customer’s profile, as such some consumers like holistic experiences and are involved in overall brand experience, but some consumers are not affected by any dimension of the brand experience. There are hedonistic consumers who connect more to the sensorial and emotional stimulus of the brand; but there are also, action-oriented consumers that focus on brand actions and behaviors (Zarantonello and Schmitt, 2010).
There are four different types of experiential strategic modules introduced by Braskus et al. (2009) that should be managed properly by brands to build a holistic experience: sensory (as in multisensory); emotion (passion); intellect (cognitive); and physics (action). He explained the dimensions with well-known brands that characterize a major dimension, including Victoria’s Secret as Sensory; Disney as Emotional; LEGO as intellectual; and Puma as Action. Generally, his scales are well-received, but there are always some limitations. Kamaladevi (2010) underlined that creating a customer experience is important to compete successfully in today’s retailing environment.
It’s been recognized that the human senses play a crucial part for the experience as well as the emotional connection (Schmitt, 2003; Hultén et al. 2008; Krishna, 2010). Considering the fact that customers always use their senses to perceive products (Hekkert and Schifferstein, 2008), the sensory dimension can be considered as a central dimension of brand experience. Sensory brand experience can be defined as “sensations aroused by brand-related stimuli that are part of a brand’s design and identity, packaging, communications, and environments” (Brakus et al., 2009, p. 52). The sensations aroused by brand related stimuli can be linked to every of the five senses: smell, sound, sight, taste and touch (Hultén, 2011; Fenko et al., 2010). Literature suggests that the larger the number of senses that are stimulated, the stronger and richer the experiences or other outcomes would be (Bahrick and Lickliter, 2000; Ernst and Bülthoff, 2004).
13
2.4 Brand Experience and Multisensory Perceptions
There are many companies which are competing to be recognized by customers in a world which is full of different brands, so it is becoming of high importance to create a brand experience where brand-related stimulus arouses “sensations, feelings, cognitions and behavioral responses” (Brakus et al. 2009, p. 52). Schmitt (1999) emphasized that sensory perceptions can intensify brand experiences. This experience usually comprises the physical environment with environmental signals of lighting, color and music, which have all been shown to have a great impact on consumers, arousing emotional reactions which touch the consumer’s behavior (Hoffman and Turley, 2002; Grönroos, 2008). Hultén (2008) has focused on the importance of creating customer experiences by the human senses, where Kotler (1974) underlined that sensorial signals are able to influence consumers’ purchase decisions.
“A multisensory brand-experience supports individual value creation and refers to how individuals react when a firm interacts and supports their purchase and consumption processes through the involvement of the five human senses in generating customer value, and experiences” (Hulten, 2011, p.259). It is also argued that a multisensory brand-experience should provide customers with an experience of consumption that appeals to the human senses and our mind in an emotional way (Hultén, 2011b). Creating an experience should thereby be directed towards “fantasies, feelings and having fun” (Holbrook and Hirschman, 1982).
Wiedmann et al. (2018) identified that a coherent multisensory strategy has a great influence to induce a memorable brand experience. Moreira et al. (2017) stated that brands who are using multisensory perceptions have a huge advantage since the overall brand experience increased positively. All the experiences the customers aggregated in their mind will merge in an overall brand experience with the brand. If the experiences are perceived positively by the customer, it will contribute a positive overall brand experience (Moreira et al. 2017). Object-related sensory information such as brand, can catch the individual’s attention and stop other stimuli from penetrating the individual’s mind (Biocca and Delaney, 1995; Spangenberg et al., 1996), which assists object-related thought processing and elaboration.
Hulten (2011) claimed that multisensory brand experience is significant in positioning and differentiating a brand as an image in the human mind and ultimate outcome generating value
14 between the supplier and the customer. The value of a brand is embedded in the multisensory brand experience and the customer individually creates the value in their mind (Grönroos, 2006). Hulten (2011) also argued that multisensory brand experiences should be the foundation for brand building and creating a brand as an image.
A previous research has demonstrated that the five senses of touch, sight, taste, smell and sound are important to understand customers´ behavior and evaluation as well as their overall experience (Hultén et al. 2008; Krishna, 2010).
Therefore, a positive relationship between multisensory perceptions and brand experiences is suggested:
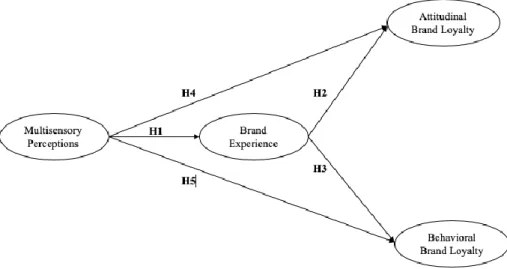
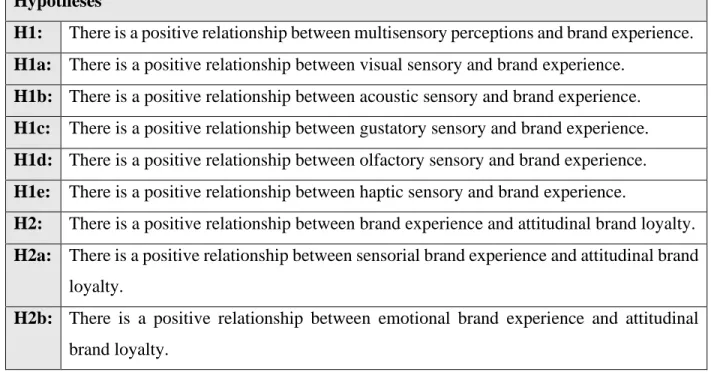
H1. There is a positive relationship between multisensory perceptions and brand experience. H1a. There is a positive relationship between visual sensory and brand experience.
H1b. There is a positive relationship between acoustic sensory and brand experience. H1c. There is a positive relationship between gustatory sensory and brand experience. H1d. There is a positive relationship between olfactory sensory and brand experience. H1e. There is a positive relationship between haptic sensory and brand experience.
2.5 Brand Loyalty
Brand loyalty is defined as ‘a deep commitment to rebuy or reuse a chosen product/service constantly in the future, which would cause repetitive same brand-set purchasing, even though situational impacts and marketing efforts makes the possibility of switching behaviour’ (Oliver 1999, 34). Consumers get loyal to a brand after having a positive emotional experience with the brand which causes satisfaction, then they distribute their positive experiences to other people (Dick and Basu 1994). Therefore, brand recommendation (Gounaris and Stathakopoulos 2003), reduced marketing costs (Chaudhuri and Holbrook, 2001), positive word of mouth (Sutikno, 2011), business profitability (Kabiraj and Shanmugan, 2011), increased market share (Gounaris and Stathakopoulos, 2004) and a competitive advantage in the market (Iglesias et al, 2011) are possible positive impact of brand loyalty on a firm.
15 Wel and Alam and Nor (2011) described the two components of brand loyalty, by expressing that as well as having the intention to repurchase a brand, brand loyalists also should have some degree of emotional connection or commitment towards the brand. Therefore, it grows to be natural for both researchers and marketers to consider brands as having both rational and emotional components. Until now researchers are still not in complete agreement regarding which components to apply for measuring brand loyalty. It has been argued that brand loyalty consists of two separate dimensions – attitudinal brand loyalty and behavioral brand loyalty (Aaker, 1991; Oliver, 1999; Chaudhuri and Holbrook, 2001).
Attitudinal brand loyalty is the degree of dispositional commitment in terms of some unique value associated with the brand, and behavioral brand loyalty consists of repeated purchases of the brand. Consumers that have favorable brand experiences are more likely to buy a brand again (purchase brand loyalty) and recommend it to others (attitudinal brand loyalty) and are less likely to buy an alternative brand (Chaudhuri and Holbrook, 2001). Newman and Werbel (1973; cited in Kabiraj and Shanmugan, 2011) claimed that for a valuable brand loyalty for marketers, the measures should contain the consumer’s unwillingness to switch brands. Khan and Mahmood (2012, p. 33) also suggested a definition as “brand loyalty can be defined as the customer’s unconditional commitment and a strong relationship with the brand, which is not likely to be affected under normal circumstances”.
2.6 Brand experience and Brand Loyalty
As positive brand experience results in pleasurable outcomes, consumers would like to repeat these positive experiences. Brand experience doesn’t only affect brand relationship judgements, but it also led to brand loyalty (Chaudhuri and Holbrook, 2001). Brand experience provides a better understanding of the value proposition a brand offers (Brakus et al, 2009). When consumers perceive greater value in the brand, they are more likely to purchase the brand and recommend it to others. Brand related experiences would be imprinted in long-term memory, playing a huge role in many positive outcomes. The most predominant outcomes are customer satisfaction and loyalty (Khan and Rahman, 2015a). In addition to different customer outcomes by a product such as customer satisfaction, brand loyalty was also investigated in several areas, such as services (Morrison and Crane, 2007) and retail (Khan and Rahman, 2015b).
16 Brakus et al (2009) pointed out that positive brand experiences enhance a brand’s value, so it is likely to make a consumer loyal to the brand. In addition, Gentile, Spiller & Ciuliano (2007) pointed out that a positive customer experience could create an emotional bond between a firm’s brand and its customers, which would result in reinforcing customer loyalty. So, the more experiential dimensions the brand evokes, the greater the experience for the consumer, enticing him/her to repeat the experience over again. Verhoef et al (2009) stated that customer experience is a key factor in making the customer loyal. Barnes, Mattson & Sorensen (2014), studied sensory brand experience in the tourism context and found that sensory brand experience had a positive impact on revisit intention. These sensory perceptions help differentiate the brand in the minds of consumers (Hultén, 2011). Customers need to re-interact with the same brand if they want to relive the experiences, which builds a motivational force toward the brand.
Therefore, a positive relationship between four dimensions of brand experiences and two dimensions of brand loyalty is suggested:
H2: There is a positive relationship between brand experience and attitudinal brand loyalty. H2a: There is a positive relationship between sensorial brand experience and attitudinal brand loyalty.
H2b: There is a positive relationship between emotional brand experience and attitudinal brand loyalty.
H2c: There is a positive relationship between intellectual brand experience and attitudinal brand loyalty.
H2d: There is a positive relationship between behavioral brand experience and attitudinal brand loyalty.
H3: There is a positive relationship between brand experience and behavioral brand loyalty. H3a: There is a positive relationship between sensorial brand experience and behavioral brand loyalty.
H3b: There is a positive relationship between emotional brand experience and behavioral brand loyalty.
H3c: There is a positive relationship between intellectual brand experience and behavioral brand loyalty.
H3d: There is a positive relationship between behavioral brand experience and behavioral brand loyalty.
17 As the literature has suggested that there is a positive relationship between multisensory perceptions and brand experience as well as brand experience and brand loyalty, it can be argued that there is also a relationship between multisensory perceptions and brand loyalty.
H4: There is a positive relationship between multisensory experience and attitudinal brand loyalty. H4a: There is a positive relationship between visual sense and attitudinal brand loyalty.
H4b: There is a positive relationship between acoustic sense and attitudinal brand loyalty. H4c: There is a positive relationship between gustatory sense and attitudinal brand loyalty. H4d: There is a positive relationship between olfactory sense and attitudinal brand loyalty. H4e: There is a positive relationship between haptic sense and attitudinal brand loyalty.
H5: There is a positive relationship between multisensory perceptions and behavioral brand loyalty.
H5a: There is a positive relationship between visual sensory and behavioral brand loyalty. H5b: There is a positive relationship between acoustic sensory and behavioral brand loyalty. H5c: There is a positive relationship between gustatory sensory and behavioral brand loyalty. H5d: There is a positive relationship between olfactory sensory and behavioral brand loyalty. H5e: There is a positive relationship between haptic sensory and behavioral brand loyalty.
The conceptual framework of the study would be as follows: Figure 1: Conceptual framework
18
3. Methodology
______________________________________________________________________________
This chapter will present the research design, strategy, approach, and method. Measurements and sample size will be presented. Data collection process, pre-test, limitations of the method will be discussed next. Finally, validity and reliability of the research method will be checked. The chapter will end by explaining the ethical issues regarding conducting the study.
______________________________________________________________________________
3.1. Research Design
The research design is about the identification and formulation of the research problem. There are three different research designs such as exploratory, descriptive and causal research (Churchill & Iacobucci, 2009). If an issue has never been researched before, researchers would primarily ask exploratory questions because the issue is unknown. Once a clearer picture of the issue appears after the exploratory research, descriptive research occurs. When the picture of the issue is somehow complete, determining exactly how key variables are related would happen. Then the causal research would come up. Each research design has different usages and requires the application of different analysis techniques.
Descriptive research is about describing distinct phenomena, characteristics or functions. It can focus on one variable or on two or more variables at the same time. Descriptive research often builds on previous exploratory research (Churchill & Iacobucci, 2009).
A scientific research can be conducted in three different approaches such as deductive, inductive and abductive (Heit & Rotello, 2010). When there is a theoretical framework and a number of hypotheses derived from that and they would test the theory being studied, it is considered to be a deductive approach. A deductive approach means that a researcher would select a certain field and would deduct one or some hypotheses from the known areas, then remaining hypotheses would be tested by an empirical examination (Bryman and Bell, 2005). In short, a deductive research approach tests the existing theories whereas an inductive approach is a theory generating process (Bryman, 2011). Alvesson and Sköldberg (2008) asserted that the deductive approach is less risky as there is a certain rule applied in a specific condition, and it aims at explaining a certain phenomenon. Bryman and Bell (2005) highlighted that a researcher should be skilled in deducting
19 relevant hypotheses and distinguish how the information can be collected based on the data that constitute the hypotheses.
The current study has been designed as descriptive deductive research to find the relationship between two dependent variables and one independent variable.
3.2. Research Methods
According to Creswell (2009), the research method is the way that the empirical data is collected, analyzed and interpreted by the researchers. According to Bryman and Bell (2005), either the qualitative or the quantitative method can be chosen as a research method. Christensen, Kent & Stewart, (2010) highlighted that quantitative data can be analyzed objectively, so it is proper for generalization. Bryman and Bell (2005) highlighted that a general description of the quantitative research process is to gather a theory from literature, a number of hypotheses would be deducted, and the rest would be tested. Creswell (2009) further adds that quantitative methods normally consist of pre- and post-test measurements which would be done in the current study as well. Since it is not easy to study an entire population with some specific features, Bryman and Bell (2005) underlined the importance of an appropriate random sampling which can reflect the social reality and make the study more feasible. Creswell (2009) and Christensen et al. (2010) stated that the information in quantitative research can be presented in the form graphs or diagrams. Based on this, a quantitative method has been conducted through an online survey for this research since it seemed to be the most relevant method to reach the results, where the aim is to examine the effect of multisensory perceptions on consumers’ brand experience and brand loyalty. In order to generalize our results and make it applicable outside our study, we have aimed at being as objective as possible, which is why a quantitative method is believed to be most appropriate.
3.3. Research strategy
Bryman and Bell (2018) explain that the research strategy specifies how the data will be collected, for example through interviews, observations or surveys and will serve as a guide throughout the research process. According to Yin (2009) there are five different types of research strategies: experiment, survey, archival analysis, history and case study. Since we are interested in measuring consumers' experiences where focus is on the contemporary, we picked a strategy of survey for this research.
20 A descriptive research design with quantitative method with a deductive approach has been used for this study, where theoretical concepts have been described and from which a number of hypotheses have derived to test the theoretical framework. In order to test hypotheses, a research strategy in the form of surveys has been performed in Sweden including responses from international students. General assumptions have then been drawn from the analysis of the results in order to provide sound recommendations for marketers regarding sensory marketing in general and foremost the multisensory perceptions influence on brand-experience and brand loyalty.
3.4. Measurements
The survey consisted of 4 multiple-choice questions and 13 questions that the respondents had to answer with a 7-point Likert scale ranging from 1 (strongly disagree) to 7 (strongly agree). Demographic information included gender, age and ethnicity. The relationship between multisensory perceptions, brand experience and brand loyalty has been measured. Multisensory perception has been measured through five senses (sound, vision, touch, taste, smell) with the questionnaire adopted from (Wiedmann, Labenz, Haase & Hennigs, 2017). Brand experience would be measured by four dimensions such as sensorial, attitudinal, behavioral, intellectual through the questionnaire adopted from (Brakus, Schmitt, & Zarantonello, 2009). Finally, brand loyalty has been measured through two dimensions such as attitudinal brand loyalty through (Chiou & Droge, 2006) and behavioral brand loyalty through (Kuenzel & Halliday, 2008) survey. The study has been conducted through the online survey via Qualtrics link in Sweden from 17-31 March 2020. A respondent was defined as a person who had purchased a Pringles potato chips before and is familiar with the product. The approximate time given for the survey was 10 minutes to fill in the survey anonymously, and there were 222 respondents (n=222). Because not all surveys were fully completed, 137 survey results were included in the analysis and the rest were excluded.
3.5. Sample Size
According to Bryman and Bell (2018) random sampling happens when each unit of a particular population has the same probability to be involved in the collected sample. Random sampling is a proper procedure of probability sampling because it provides precise results than other sampling methods (Kinnear and Taylor, 1996). One of the reasons for making a random selection is to be able to generalize the study (McBurney and White, 2004). It has been said by Malhotra and Birks
21 (2007) that random sampling can be compared to a lottery system in which numbers are strained independent from each other and in an independent way.
For the current study, random sampling means that all customers that are familiar with Pringles potato chips during the time period that we performed our survey had the same probability to be incorporated in our statistics.
3.6. Pre-test
Prior to the main study, we conducted a pre-test to screen the questionnaire for errors and misunderstandings and point out items to measure all three constructs, multisensory perceptions, brand experience and brand loyalty. Regarding all constructs (i.e., multisensory perceptions, brand experience and brand loyalty), we relied on existing and previously tested measures. Based on a profound literature review and expert interviews, we received 49 items for multisensory perceptions, brand experience and brand loyalty. A preliminary questionnaire in the form of an online survey was sent to students for item evaluation. In total, 20 respondents completed the questionnaire. The validity and reliability were checked by factor analysis and Cronbach’s alpha resulting in a reduced set of 3 items. Based on the pre-test results, the questionnaire was redesigned for the main study.
22
3.7. Data collection process
For the purposes of this research, a survey is conducted as primary research. A survey is a research method to gather data from a sample of respondents to gain information and ideas about different topics in order to generalize the results to a bigger population (Qualtrics, 2020). The current study used a self-administered computer survey, which was created on Qualtrics and distributed online through WhatsApp groups, LinkedIn, Instagram and Facebook. A self-administrated questionnaire is a survey “in which the respondent takes the responsibility for reading and answering the questions without having them stated orally by an interviewer” (Babin & Zikmund, 2016, p.187). So, this data collection method implies that the respondents answer the questions autonomously and that the researcher is not present when the survey is being completed. A self-administered computer survey is cost-effective and time efficient as respondents can do it from everywhere at any time. The researchers did not actively participate in the answering of the survey process, they distributed the survey among the sample population and sent them reminders to fill in the survey to get enough responses.
To increase the respondent’s responsibility towards filling out the survey frankly and reliably, researchers told them about the purpose of this research, while distributing the survey, since it’s a part of a master thesis at Jönköping International Business School.
3.8. Limitations of Methodology
It is important to mention that there are several limitations for a quantitative research methodology. Contrasting qualitative studies, quantitative studies do not consider an individual's emotions to the questions asked in the survey. The reaction arousing from these emotions can provide valued information about individuals’ exact inner feelings about a specific question (Babin & Zikmund, 2016). Therefore, only relying on the answers that respondents selected in the survey without considering their feelings could limit the meaningfulness of the study. Furthermore, quantitative studies that make use of self-administered questionnaires, may be more disposed to response errors caused by respondent’s misrepresentation because they don’t have the possibility to ask the researchers whether they completely understand a question or not (Babin & Zikmund, 2016).
23
3.9. Validity
Goldstein and Simpson (1995) defined validity as:” The extent to which an empirical indicator of a concept represents the concept of interest”. In other words, if the questions are measuring what they are intended to measure (Kinnear & Taylor, 1996). In simple terms, researchers make conclusions that are correct and true (McBurney & White, 2009). Saunders Lewis and Thornhill (2016) state that validity is about three main things namely, 1) that the measure actually measures what they intend to measure, 2) that the relationships and the analysis of the results are accurate, 3) and about the generalizability of the findings. According to Yin (2009), there are three tests to judge the quality of the validity of the research design. Yin explained that validity can be tested through internal validity, external validity, construct validity and reliability. Reliability will be further discussed in the paragraph below.
3.9.1. Internal validity
According to Cuncic (2020), internal validity is being able to justify that the independent variable caused the dependent variable. Simply, a study establishes a trustworthy cause-and-effect relationship between the independent variable and the outcome. When a study is internally valid, it is also possible to eliminate alternative explanations for the outcome. The researcher continually tries to avoid confounding that could make the findings questionable. The less confounding takes place the higher the internal validity which results in that the researcher can be more confident with his findings (Cuncic, 2020). Kinnear and Taylor (1996) mentioned that if research does not achieve internal validity the conclusions are from no worth. To assume cause-and-effect, first, the cause needs to be preceded by the effect in terms of time. Second, the cause and effect must vary together and third, there are no other explanations for the observed relationship (Cuncic, 2020). The internal validity can be improved by using different research techniques, the findings can then be triangulated. Combining two or more research techniques will increase the credibility of the findings since they are connected and build on each other (Fisher & Buglear, 2010).
3.9.2. External validity
External validity is important since the researcher wants the findings to be generalized, which means the same study can be done by researchers in a new situation and with a new sample of the population, and that they have the same outcomes.
24 Therefore, external validity is connected to the fact that a cause-and-effect relationship is generalizable or not (Fisher & Buglear, 2010). According to Bryan and Bell (2007), the selection process of the sample population is a crucial part to generalize. To generalize a sample of a population the sample must represent the population in, for instance, age, gender, and geographical area. Yin (2009) stated that some critics argue that single research provides meager proof for generalization since it might not be applicable in different situations. To improve external validity, it is advised to clearly define the population that will be studied and to adjust to problems such as uneven age or gender (Cuncic, 2020).
This research includes responses from 222 respondents that are randomly chosen by the researchers. These 222 respondents are large enough to enable generalizing the outcomes of the survey. Based on this, it is argued that the results obtained from the survey are generalizable for other situations and provide the research paper with high validity.
3.9.3. Construct validity
According to Saunders et al. (2016), construct validity checks if a set of questions measure the presence of the construct that was supposed to be measured. Kinnear and Taylor (1996) mentioned that construct validity concerns the theoretical foundation on which the acquired measurements rely on. Construct validity would check if the used secondary data is supported by the primary data, simply defined if the theory used for the research is supported by the outcome of research results (McBurney & White, 2009). Saunders et al. (2016) stated that construct validity is normally used when referring to constructs such as attitude and loyalty. Yin (2009) mentioned that construct validity can be achieved through three tactics, namely 1) use of multi-source evidence, 2) establish a chain of evidence, 3) have key informants review draft study reports.
Within this research paper, the aim was to go through a great variety of literature in depth to provide a strong theoretical foundation. The chosen variables reflect on the construct from a specific theoretical standpoint and therefore the construct validity will be less likely questioned. Based on this, the variables and measures came about through dialog with the thesis supervisor, to be sure that they were correctly made.
25
3.10. Reliability
According to Saunders et al. (2016), reliability is about the consistency of a measure in the replication of the research. If another researcher is able to replicate the research and achieve the same findings, then research would be considered as reliable. Bryman and Bell (2007) mentioned that reliability is connected to the research question. Within reliability, some researchers make a distinction between internal- and external reliability. Internal reliability concerns the consistency of the research which can be improved by using more than one researcher to analyze the data to be able to evaluate to which extent they agree about the data and analysis (Saunders, Lewis, & Thornhill, 2016). External reliability refers to the data collection techniques and analytical procedures and the possibility if the findings were repeated on another occasion or by a different researcher. Yin (2009) stated that this only concerns doing the exact same study, and not a similar study through another case. There are a lot of threats that could negatively influence the reliability, such as a respondent error (when they are filling in the survey in a hurry) or researcher bias (the subjective view of the researcher) (Saunders, Lewis, & Thornhill, 2016).
3.11. Ethical Issues
It is critical to address ethical issues in order to prevent the potential ethical violation, damages to participants and researchers (Collis & Hussey, 2014). For the current study, the web version of the questionnaire has been conducted and there was no space for respondents to fill their names or other identifying information. In this way, the author was entirely unknown about who accompanied the questionnaire and respondent’s anonymity was fully protected. The respondents were fully informed about the purpose and usage of the data. The participation was fully voluntary. The primary information collected by this study was carefully handled to avoid information leakage. Moreover, the authors kept the data in a secret and safe place and protected them by passwords. The researchers signed a GDPR form provided by the university to keep the confidentiality of the respondents and research ethics. Finally, this study involved no commercial interests.
26
4. Empirical Findings
______________________________________________________________________________
The purpose of this chapter is to present the empirical findings of the study. First, the demographic sample is described. Second, descriptive statistics are presented, followed by the reliability testing and a factor analysis. After that, all the hypotheses are tested using correlation analysis and multiple regression analysis.
______________________________________________________________________________ The three constructs in the model were measured using established scales. Multisensory perceptions were measured through an adopted questionnaire (Wiedmann, Labenz, Haase & Hennigs, 2017). Brand experience was measured using a 7-item scale (Brakus et al, 2009) that has four dimensions – sensory, affective, behavioral, and intellectual. Each dimension was measured by three items. So, the brand experience construct was modelled as a second-order variable with four sub dimensions. Brand loyalty was measured using two two-item scales, one for behavioral loyalty (Kuenzel & Halliday, 2008) and the other for attitudinal loyalty (Chiou & Droge, 2006). The data were analyzed using SPSS 26.00.
4.1 Data cleaning
Before proceeding to the main analyses, data was examined for missing values and potential errors in data entry. In the second step, the data was analyzed for missing values. It is almost impossible to obtain a large set of data without having some missing values (Hair, Black, Babin & Anderson, 2014). The random missing values in the data were excluded from the data (Tabachnick and Fidell, 2001). In total, 222 responses were collected by the distribution of the online survey. However, out of these 222 respondents only 137 could be used for further analysis. Out of these 137 respondents 43.8% were male, 54.7% were female and 1.5% were other. The most represented age group within the 137 respondents were 23 – 28 years old (41.6%), followed by the 17 – 22 years old respondents (29.9%). An explanation for this phenomenon could be the popularity of snacks and chips among younger generations as well as the fact that the sample consisted mostly out of contacts of the authors who were of a similar age. Out of the respondents, 21.2% were from the Netherlands, 16.8% from Iran, 16.1% from Sweden, 14.6% from Germany, 13.1% from China and the rest from other countries.
27
4.2 Descriptive Statistics
In order to check for means and standard deviations (SD) but also for missing items, frequency analyses had been conducted for all dimensions of the survey. It showed that there were no missing values and SDs which were spread around a 1.0 value on a 7-point Likert scale (1=Strongly disagree...7=Strongly agree).
The mean scores of the multisensory perception dimension are shown in table 1. The mean scores vary from 4.50 to 5.18, which shows that the respondents sometimes were indecisive and tended to neither agree nor disagree, but most tended to somewhat agree with the statements.
Table 1: Frequency of multisensory perceptions predictor
Visual Haptic Acoustic Olfactory Gustatory
Mean 4.78 4.67 4.50 4.52 5.18
The mean scores of the Brand Experience dimensions vary from 2.58 to 4.36 (See table 2). Intellectual brand experience value demonstrates respondents were hesitant to somewhat disagree but mostly tended to disagree with the statements. The value of sensorial demonstrates respondents mostly tended to neither agree nor disagree with the statements.
Table 2: Frequency of Brand Experience dimensions
Sensorial Emotional Behavioral Intellectual
Mean 4.36 3.35 2.63 2.58
The mean of attitudinal brand loyalty was 3.74, demonstrating respondents were hesitant to neither agree nor disagree but mostly tended to somewhat disagree with the statements. The mean of behavioral brand loyalty was 4.33, demonstrating respondents mostly tended to neither agree nor disagree with the statements.