Global Health Action
ISSN: (Print) (Online) Journal homepage: https://www.tandfonline.com/loi/zgha20
Routine health management information
system data in Ethiopia: consistency, trends, and
challenges
Abyot Adane , Tewabe M. Adege , Mesoud M. Ahmed , Habtamu A. Anteneh ,
Emiamrew S. Ayalew , Della Berhanu , Netsanet Berhanu , Misrak G.
Beyene , Antoinette Bhattacharya , Tesfahun Bishaw , Eshetu Cherinet ,
Mamo Dereje , Tsega H. Desta , Abera Dibabe , Heven S. Firew , Freweini
Gebrehiwot , Etenesh Gebreyohannes , Zenebech Gella , Addis Girma ,
Zuriash Halefom , Sorsa F. Jama , Binyam Kemal , Abyi Kiflom , Carina
Källestål , Seblewengel Lemma , Yidnekachew D. Mazengiya , Kalkidan
Mekete , Magdelawit Mengesha , Meresha W. Nega , Israel A. Otoro , Joanna
Schellenberg , Tefera Taddele , Gulilat Tefera , Admasu Teketel , Miraf
Tesfaye , Tsion Tsegaye , Kidist Woldesenbet , Yakob Wondarad , Zemzem
M. Yosuf , Kidist Zealiyas , Mebratom H. Zeweli , Lars Åke Persson & Annika
Janson
To cite this article: Abyot Adane , Tewabe M. Adege , Mesoud M. Ahmed , Habtamu A. Anteneh , Emiamrew S. Ayalew , Della Berhanu , Netsanet Berhanu , Misrak G. Beyene , Antoinette
Bhattacharya , Tesfahun Bishaw , Eshetu Cherinet , Mamo Dereje , Tsega H. Desta , Abera Dibabe , Heven S. Firew , Freweini Gebrehiwot , Etenesh Gebreyohannes , Zenebech Gella , Addis Girma , Zuriash Halefom , Sorsa F. Jama , Binyam Kemal , Abyi Kiflom , Carina Källestål , Seblewengel Lemma , Yidnekachew D. Mazengiya , Kalkidan Mekete , Magdelawit Mengesha , Meresha W. Nega , Israel A. Otoro , Joanna Schellenberg , Tefera Taddele , Gulilat Tefera , Admasu Teketel , Miraf Tesfaye , Tsion Tsegaye , Kidist Woldesenbet , Yakob Wondarad , Zemzem M. Yosuf , Kidist Zealiyas , Mebratom H. Zeweli , Lars Åke Persson & Annika Janson (2021) Routine health management information system data in Ethiopia: consistency, trends, and challenges, Global Health Action, 14:1, 1868961, DOI: 10.1080/16549716.2020.1868961
To link to this article: https://doi.org/10.1080/16549716.2020.1868961
© 2021 The Author(s). Published by Informa UK Limited, trading as Taylor & Francis Group.
View supplementary material
Full Terms & Conditions of access and use can be found at
https://www.tandfonline.com/action/journalInformation?journalCode=zgha20 Article views: 749
View related articles
Routine health management information system data in Ethiopia:
consistency, trends, and challenges
Abyot Adane a, Tewabe M. Adegeb, Mesoud M. Ahmedb, Habtamu A. Anteneh b, Emiamrew S. Ayalew b, Della Berhanu c, Netsanet Berhanub, Misrak G. Beyene d,
Antoinette Bhattacharya c, Tesfahun Bishawb, Eshetu Cherinet b, Mamo Derejeb, Tsega H. Destab, Abera Dibabeb, Heven S. Firew d, Freweini Gebrehiwotd, Etenesh Gebreyohannesb, Zenebech Gella b, Addis Girma b, Zuriash Halefomb, Sorsa F. Jama b, Binyam Kemalb, Abyi Kifloma, Carina Källestål c,e, Seblewengel Lemma c, Yidnekachew D. Mazengiya b, Kalkidan Meketed, Magdelawit Mengeshab, Meresha W. Negab, Israel A. Otorob, Joanna Schellenberg c, Tefera Taddele d, Gulilat Teferaa, Admasu Teketela, Miraf Tesfayeb, Tsion Tsegayea, Kidist Woldesenbet b, Yakob Wondarad b,
Zemzem M. Yosufb, Kidist Zealiyasd, Mebratom H. Zeweli b, Lars Åke Persson c,e and Annika Janson c,f aEthiopian Pharmaceutical Supply Agency, Addis Ababa, Ethiopia; bMinistry of Health, Addis Ababa, Ethiopia; cDepartment of Disease
Control, London School of Hygiene & Tropical Medicine, London, UK; dEthiopian Public Health Institute, Addis Ababa, Ethiopia; eDepartment of Women’s and Children’s Health, Uppsala University, Uppsala, Sweden; fDepartment of Women´s and Children’s Health,
Karolinska Institutet, Stockholm, Sweden
ABSTRACT
Background: Ethiopia is investing in the routine Health Management Information System.
Improved routine data are needed for decision-making in the health sector.
Objective: To analyse the quality of the routine Health Management Information System data
and triangulate with other sources, such as the Demographic and Health Surveys.
Methods: We analysed national Health Management Information System data on 19
indica-tors of maternal health, neonatal survival, immunization, child nutrition, malaria, and tuber-culosis over the 2012–2018 time period. The analyses were conducted by 38 analysts from the Ministry of Health, Ethiopia, and two government agencies who participated in the Operational Research and Coaching for Analysts (ORCA) project between June 2018 and June 2020. Using a World Health Organization Data Quality Review toolkit, we assessed indicator definitions, completeness, internal consistency over time and between related indicators, and external consistency compared with other data sources.
Results: Several services reported coverage of above 100%. For many indicators,
denomina-tors were based on poor-quality population data estimates. Data on individual vaccinations had relatively good internal consistency. In contrast, there was low external consistency for data on fully vaccinated children, with the routine Health Management Information System showing 89% coverage but the Demographic and Health Survey estimate at 39%. Maternal health indicators displayed increasing coverage over time. Indicators on child nutrition, malaria, and tuberculosis were less consistent. Data on neonatal mortality were incomplete and operationalised as mortality on day 0–6. Our comparisons with survey and population projections indicated that one in eight early neonatal deaths were reported in the routine Health Management Information System. Data quality varied between regions.
Conclusions: The quality of routine data gathered in the health system needs further
attention. We suggest regular triangulation with data from other sources. We recommend addressing the denominator issues, reducing the complexity of indicators, and aligning indicators to international definitions.
ARTICLE HISTORY Received 8 October 2020 Accepted 22 December 2020 RESPONSIBLE EDITOR Stig Wall, Umeå University, Sweden
KEYWORDS
Data Quality; HMIS; RHIS; Routine Health Information System; WHO data quality review toolkit
Background
A routine Health Management Information System (HMIS) ideally provides accurate, disaggregated, and real-time information from all health system levels to enable disease surveillance, activity mon-itoring, allocation of resources, and policy forma-tion. It can also inform patients and provide feedback to professionals in the health-care system. In the absence of a well-functioning routine HMIS,
most low- and middle-income countries rely upon survey data, such as the Ethiopian Demographic and Health Surveys (EDHS) [1,2]. Such studies usually produce valid and reliable information. However, these surveys are costly, retrospective, and intermittent, which makes their results less suitable for guiding current planning and policy formation [3]. In most cases, national surveys do not provide district-level data for health planning.
CONTACT Annika Janson annika.janson@lshtm.ac.uk London School of Hygiene & Tropical Medicine, London, UK
Supplemental data for this article can be accessed here.
GLOBAL HEALTH ACTION 2021, VOL. 14, 1868961
https://doi.org/10.1080/16549716.2020.1868961
© 2021 The Author(s). Published by Informa UK Limited, trading as Taylor & Francis Group.
This is an Open Access article distributed under the terms of the Creative Commons Attribution License (http://creativecommons.org/licenses/by/4.0/), which permits unrestricted use, distribution, and reproduction in any medium, provided the original work is properly cited.
The Information Revolution was one of the four transformation agendas in Ethiopia’s first Health Sector Transformation Plan [4,5]. The information revolution aimed to advance collection, analysis, pre-sentation, and dissemination of information that could influence decision-making. A particular focus was given to the introduction of new information technology, including the computer software District Health Information System (DHIS2), used in over 60 countries [6,7]. However, many health facilities in Ethiopia lack the necessary infrastructure, such as reliable electricity. Although some structural data quality problems can be expected to improve with the increasing use of information technology, other issues may remain [8–10].
Health data are often expressed as prevalence or coverage and depend both on valid numerator infor-mation and on appropriate definition and assessment of the denominator. Data from the latest Ethiopian census in 2007 frequently serves as a basis for popu-lation estimates based on specific algorithms for each region [11,12, Ministry of Health, Ethiopia, personal communication, 2019].
Extensive routine data are collected in Ethiopia from all health-care levels and outside the health- care system [13]. The routine HMIS, sometimes referred to as the Routine Health Information System (RHIS), includes any regular data collection conducted in the health system and community with an interval of less than 1 year [14]. In the routine HMIS in Ethiopia, over 1000 data elements are reported monthly and around 400 quarterly. Further data are included on specific diseases such as HIV, and on activities such as quality assurance. Some data elements are compiled into indicators for the routine HMIS at the health centre level and above [11]. In 2017, the Ministry of Health (MOH) increased the number of routine HMIS indicators from 122 to 131 [11] (Supplementary Table S1). Information from the lower levels is also forwarded to the Ethiopian Public Health Institute in the Public Health Emergency Management framework, includ-ing the Maternal and Perinatal Death Surveillance and Response, and in the supply and procurement systems to the Ethiopian Pharmaceutical Supply Agency (Supplementary Figure S1). Vital events, such as births and deaths, are reported to the Vital Events Registration Authority that forwards data to the Central Statistical Agency.
Here we report an assessment of the quality of Ethiopian routine HMIS data. We compared 19 indica-tor definitions with the EDHS definitions, assessed com-pleteness, internal consistency of national routine HMIS data, and external consistency with data from other sources, mainly the EDHS; and identified strengths, challenges, and opportunities for improvements in the
routine HMIS data in Ethiopia. The rationale for our study was the pivotal role that can be played by a well- functioning routine HMIS for allocating resources and planning health care.
Methods
Study area, study population, and selected indicators
This study targeted national and regional routine HMIS data from Ethiopia. Ethiopia is the second- most populous country in Africa, with an estimated population of 110 million [15,16]. After re-structuring in 2020, there are 10 administrative regions as well as the two city administrations of Addis Ababa and Dire Dawa. Regions are sub-divided into 98 zones and further into 923 districts, woreda, which in turn are divided into the lowest administrative unit, kebele, having around 5000 inhabitants [17]. The MOH gov-erns the health system with decentralized power to Regional Health Bureaux, which are responsible for management, coordination, and distribution of techni-cal support to the lower levels. The health system has three levels (tiers): primary level (health posts, health centres, primary hospitals); secondary level (general hospitals); and third-level health care (specialised hos-pitals) [4]. Data flow starts at the point of service delivery, and data are compiled at the district, zonal, and regional offices before reaching the national level (Supplementary Figure S1).
Thirty-eight analysts from the MOH, the Ethiopian Public Health Institute, and the Ethiopian Pharmaceutical Supply Agency were selected for a two-year on-the-job capacity-development inter-vention, the Operational Research and Coaching for Analysts (ORCA) project. The ORCA-project was initiated by the MOH and implemented by the London School of Hygiene & Tropical Medicine. Workshops, training, and facilitated analytical work took place in parallel to the participants’ professional responsibilities. The work was performed in six the-matic groups: Maternal Health, Neonatal Survival, Immunization, Child Nutrition, Malaria, and Tuberculosis. The ORCA thematic groups analysed 19 indicators and data elements that contribute to the indicators. Data sources used are shown in Table 1.
Data collection and analysis
The routine HMIS data from the national level, the nine regions that existed at the time of the study, and from the two city administrations were available from the MOH. Each thematic group identified appropriate source documents for external comparisons, such as the EDHS [1,2] (Table 1). The EDHS 2016 data on
neonatal deaths were disaggregated to show early neo-natal deaths by age in days. We also used data from the Health Commodities Management Information System (HCMIS) [4]. Data on pharmaceutical drugs and vac-cines were expressed as standard person doses. For malaria, we compared the routine HMIS data with the World Health Organization (WHO) annual World Malaria Reports for 2015–2018 [18].
We used the second module of the WHO Data Quality Review: a toolkit for facility data quality assess-ment, and Excel sheets for data analysis, which were prepared using the same operational definitions as the WHO toolkit, see below [6,19]. The Ethiopian calendar differs from the Gregorian calendar by 7–8 years, and these differences, were considered in all comparisons
(Table 1).
Study design and operational definitions
The WHO toolkit [19] provides a method for analysing routine HMIS data using four dimensions of data qual-ity. The first dimension concerns whether data are available (completeness, timeliness). The second looks at the internal consistency of routine HMIS data com-pared over time and between indicators that could be expected to have a relation, such as the number of women coming for antenatal care visits, deliveries and newborn vaccinations. The third dimension concerns the external consistency when routine HMIS data are compared with data from other sources such as the number of vaccinations compared to the supply of vaccines, or the ratio of routine HMIS performance over coverage in population surveys. The fourth
dimension compares population estimates. In this study, we assessed the data quality dimensions of com-pleteness, internal consistency, and external consis-tency and used population estimates to predict births.
Definitions of indicators. The definition of the indicators was analysed using the HMIS Indicators Reference Guide [11], and comparison with the indi-cators used by the EDHS [1].
Data Quality Review dimension 1. Completeness of data. We analysed the completeness of routine HMIS data for the 12 months of 1 year for the 14 indicators of all thematic groups, except malaria and tuberculosis. Completeness of data elements was defined as the pre-sence of the reported aggregated data for the specified month.
Data Quality Review dimension 2. Internal consis-tency of reported data (presence of outliers, consisconsis-tency over time, and consistency between related indicators). A value within 2 to 3 standard deviations from the mean for the indicator over 12 months was considered a moderate outlier. A value of 3 or more standard deviations from the mean was considered an extreme outlier. The index year’s performance was divided by the average of the preceding 3 years to represent the consistency over time for each selected routine HMIS indicator or data element. The quality range was set at ±33%. Consequently, we defined consistency over time as a ratio from 0.66 to 1.33 and refer to these values as an acceptable value, ‘within the quality range.’ Using the WHO toolkit and based on the participants’ assumptions for each indicator, we considered whether the trend for each indicator was expected to be con-sistent, decreasing, or increasing. The indicators in the Table 1. Thematic groups, selected indicators and data elements for analysis and source documents used in this study.
Thematic group Indicator or data element analysed
Source documents for analysis of indicator or data element
Maternal Health First antenatal care visit
Four antenatal care visits Skilled birth attendance Postnatal care
HMIS 2014–2018b
EDHS 2016
Neonatal Survival Early neonatal death at community
Early institutional neonatal death rate Total number of births in the same kebele
HMIS 2014–2018a;
EDHS 2016; Mini-EDHS 2019
Immunization Pentavalent vaccine third dose
Measles Fully immunized
HMIS 2014–2018a;
EDHS 2016;
HCMIS 2014–2018a
Child Nutrition Vitamin A supplementation
Deworming
Severe acute malnutrition Growth monitoring promotion
HMIS 2012–2016b;
EDHS 2016
Malaria Suspected malaria
Positive malaria All malaria
HMIS 2014–2018a; HCMIS 2014–2018a;
World Malaria Report (WHO) 2015–2018
Tuberculosis New and relapse tuberculosis
Treated tuberculosis
HMIS 2014–2018a; HCMIS
2014–2018a
a
2014–2018 is Gregorian calendar 8 July 2014 to 7 July 2018 = Ethiopian Fiscal Year 2007–2010 b2012–2016 is Gregorian calendar 8 July 2012 to 7 July 2016 = Ethiopian Fiscal Year 2005–2008 EDHS = Ethiopian Demographic and Health Survey
HCMIS = Health Commodity Management Information System HMIS = Health Management Information System
Kebele = the lowest administrative unit in Ethiopia, around 5000 persons
Penta = vaccine against Diphtheria, Tetanus, Pertussis, Hepatitis B, and Haemophilus Influenzae WHO = World Health Organization
routine HMIS that were expected to have a logical relationship, such as fourth antenatal care visit and skilled birth attendance, or measles vaccinations and fully vaccinated, were used to evaluate the consistency between related indicators. The quality range for con-sistency between related indicators was set at ±10%.
Data Quality Review dimension 3. External con-sistency of reported data. The routine HMIS indica-tors or data elements were compared with data from other relevant data sources, mainly the EDHS [1,2]. The quality range for external consistency was set at ±33%.
Results
Definitions and alignment of indicators and data elements used
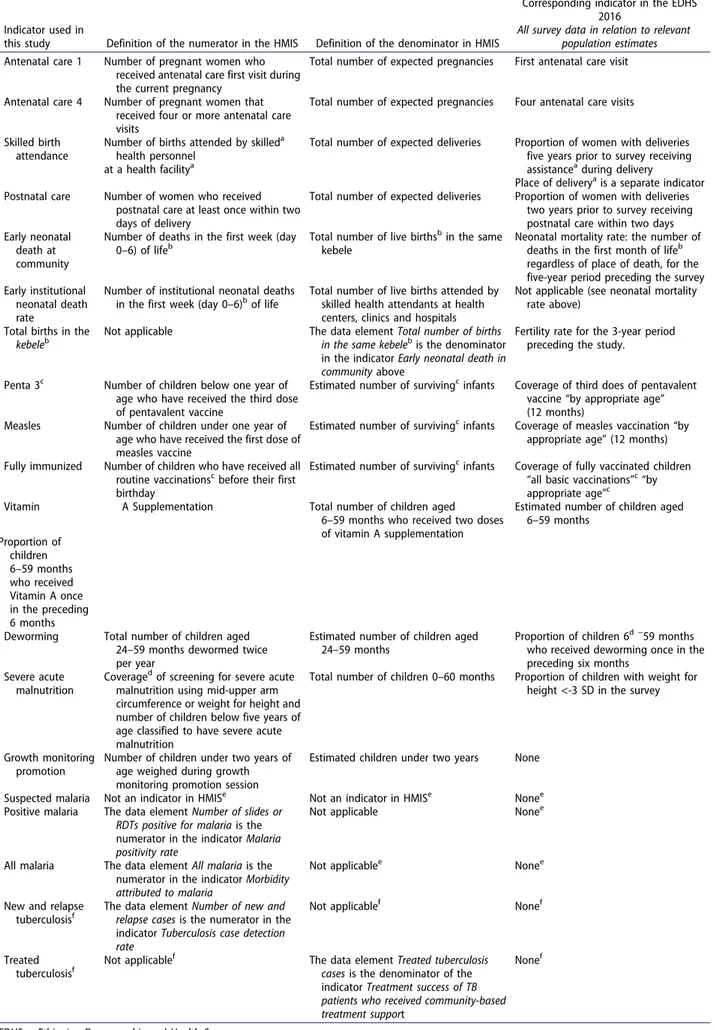
We compared definitions and reporting periods for the 19 routine indicators and data elements between the routine HMIS and the EDHS (Table 2). The four maternal health indicators were well aligned with the corresponding indicators in the latest EDHS. However, the routine HMIS defined a skilled birth attendant as a facility delivery with a skilled attendant who is a nurse, midwife, health officer, or doctor trained in deliveries, but not a health extension worker. In con-trast, the EDHS 2016 categorised the birth attendants including the health extension worker, while the place of delivery was described in a separate indicator [1,11].
The definition of indicators regarding neonatal mortality were poorly aligned. The routine HMIS reported neonatal deaths as deaths on days 0–6 after birth, but did not include deaths from day 7–28. The data element ‘total number of births in the same kebele’ was used as the denominator to determine the community’s early neonatal death rate. The total number of births in the same kebele included all births, whether institutional or at home [11]. In the EDHS, a neonatal death was defined as a death occur-ring on day 0–28 [1].
The definition of fully vaccinated children was similar in the routine HMIS and the EDHS at the time of the comparisons. Since then, some new vaccines have been added to the HMIS definition of fully vaccinated (Table 2). The EDHS presented figures of all basic vaccinations assessed in the group 12–23 months, and ‘vaccinated by appropriate age,’ which can be compared to the routine HMIS data for fully vaccinated children <1 year. The denominators used in the routine HMIS for coverage of the third pentavalent vaccination, measles vaccine, and ‘fully vaccinated’ were the estimated number of surviv-ing infants for all indicators (Ministry of Health, Ethiopia, 2020, personal communication). This algo-rithm-based estimate was the practice despite guidelines that stated the total number of surviving infants should be used for measles vaccine and ‘fully vaccinated’,
implying actual children who survived their first birth-day. The HMIS defined Vitamin A supplementation as two doses in 1 year, whereas the EDHS reported data on one dose of Vitamin A in 6 months. Also, there were minor differences in age groups. The HMIS tuberculosis indicators were numerous [16] and complex, with both numerators and denominators being both highly specific and complex, such as ‘latent tuberculosis infection treat-ment coverage for under 5-years children who are con-tacts of pulmonary TB cases’ (Supplementary Table S1). For malaria and tuberculosis, there were no indicators in the EDHS.
Data quality review dimension 1: completeness of data
Data on immunization in 2017/18 were complete, as were data on child nutrition indicators for 2015/16. Data on skilled birth attendance and first and fourth antenatal care visits 2017/18 were complete, but post-natal care showed 2 months with missing data, both from the same region (Table 3(a)). Data on early neonatal deaths in the community for 2014/2015 were not reported from one city administration
(Table 3(b)).
Data quality review dimension 2: internal consistency
Presence of outliers
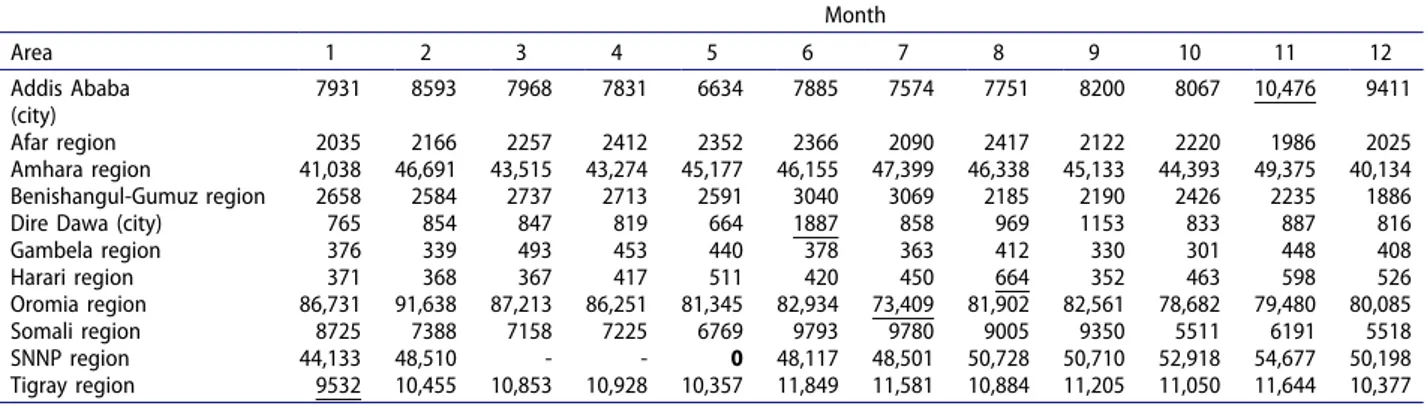
Data on postnatal care showed a few outliers (Table 3(a)), including one extreme outlier with a recorded value of zero. Data on births (data not shown) and early neonatal deaths in the community (Table 3(b)) were both prone to outliers. For Vitamin A supplementation, there were both extreme and moderate outliers, and outliers were also present for deworming. Outliers were often seen in month six and month 12, corresponding to reporting periods.
Consistency over time
The routine HMIS indicator data for 1 year were compared to the average of the preceding 3 years for all 19 indicators (Supplementary Table S2). There was consistency over time for maternal health and immu-nization in most regions and city administrations. In contrast, neonatal health and child nutrition indicators showed consistency over time in less than half of the regions or city administrations (Figure 1). All regions but one, showed an expected positive trend in mater-nal health indicators. However, all remained within the quality range of 33% of the average of the three pre-ceding years (Supplementary Table S2).
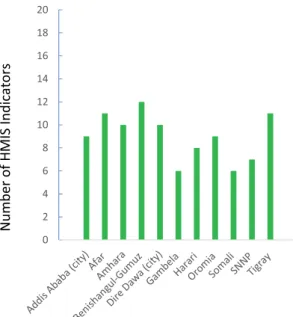
No region or city administration showed consis-tency over time for all selected indicators. The con-sistency over time ranged from six to 12 out of the 19 indicators (Figure 2).
Table 2. Definitions of indicators and data elements in the routine Health Management Information System (HMIS) and the corresponding indicators in the Ethiopian Demographic and Health Survey (EDHS) 2016. HMIS indicator definitions from the Ministry of Health HMIS Indicators Reference Guide.
Indicator used in
this study Definition of the numerator in the HMIS Definition of the denominator in HMIS
Corresponding indicator in the EDHS 2016
All survey data in relation to relevant population estimates
Antenatal care 1 Number of pregnant women who
received antenatal care first visit during the current pregnancy
Total number of expected pregnancies First antenatal care visit
Antenatal care 4 Number of pregnant women that
received four or more antenatal care visits
Total number of expected pregnancies Four antenatal care visits
Skilled birth attendance
Number of births attended by skilleda
health personnel
at a health facilitya
Total number of expected deliveries Proportion of women with deliveries
five years prior to survey receiving
assistancea during delivery
Place of deliverya is a separate indicator
Postnatal care Number of women who received
postnatal care at least once within two days of delivery
Total number of expected deliveries Proportion of women with deliveries
two years prior to survey receiving postnatal care within two days Early neonatal
death at community
Number of deaths in the first week (day
0–6) of lifeb Total number of live births
b
in the same kebele
Neonatal mortality rate: the number of
deaths in the first month of lifeb
regardless of place of death, for the five-year period preceding the survey Early institutional
neonatal death rate
Number of institutional neonatal deaths
in the first week (day 0–6)b of life Total number of live births attended by skilled health attendants at health
centers, clinics and hospitals
Not applicable (see neonatal mortality rate above)
Total births in the kebeleb
Not applicable The data element Total number of births
in the same kebeleb is the denominator in the indicator Early neonatal death in community above
Fertility rate for the 3-year period preceding the study.
Penta 3c Number of children below one year of
age who have received the third dose of pentavalent vaccine
Estimated number of survivingc infants Coverage of third does of pentavalent
vaccine “by appropriate age” (12 months)
Measles Number of children under one year of
age who have received the first dose of measles vaccine
Estimated number of survivingc infants Coverage of measles vaccination “by
appropriate age” (12 months)
Fully immunized Number of children who have received all
routine vaccinationsc before their first
birthday
Estimated number of survivingc infants Coverage of fully vaccinated children
“all basic vaccinations”c “by
appropriate age”c
Vitamin A Supplementation Total number of children aged
6–59 months who received two doses of vitamin A supplementation
Estimated number of children aged 6–59 months Proportion of children 6–59 months who received Vitamin A once in the preceding 6 months
Deworming Total number of children aged
24–59 months dewormed twice per year
Estimated number of children aged 24–59 months
Proportion of children 6d −59 months
who received deworming once in the preceding six months
Severe acute malnutrition
Coveraged of screening for severe acute
malnutrition using mid-upper arm circumference or weight for height and number of children below five years of age classified to have severe acute malnutrition
Total number of children 0–60 months Proportion of children with weight for
height <-3 SD in the survey
Growth monitoring promotion
Number of children under two years of age weighed during growth monitoring promotion session
Estimated children under two years None
Suspected malaria Not an indicator in HMISe Not an indicator in HMISe Nonee
Positive malaria The data element Number of slides or
RDTs positive for malaria is the numerator in the indicator Malaria positivity rate
Not applicable Nonee
All malaria The data element All malaria is the
numerator in the indicator Morbidity attributed to malaria
Not applicablee Nonee
New and relapse
tuberculosisf
The data element Number of new and relapse cases is the numerator in the indicator Tuberculosis case detection rate
Not applicablef Nonef
Treated
tuberculosisf
Not applicablef The data element Treated tuberculosis
cases is the denominator of the indicator Treatment success of TB patients who received community-based treatment support
Nonef
EDHS = Ethiopian Demographic and Health Survey
Consistency between related indicators
There was a particular inconsistency in denomina-tors: only 0.7 million births in the same kebele were recorded, yet 2.4 million early postnatal care visits and 2.7 million children vaccinated with the third dose of pentavalent vaccine were reported in 2017/ 2018. The internal consistency between children vac-cinated with the third dose of pentavalent vaccine and measles was in the quality range in all regions. The number of treated tuberculosis cases was higher than the number of new and relapse cases in two regions, and the reverse was seen in one region (data not shown).
Data quality review dimension 3: external consistency
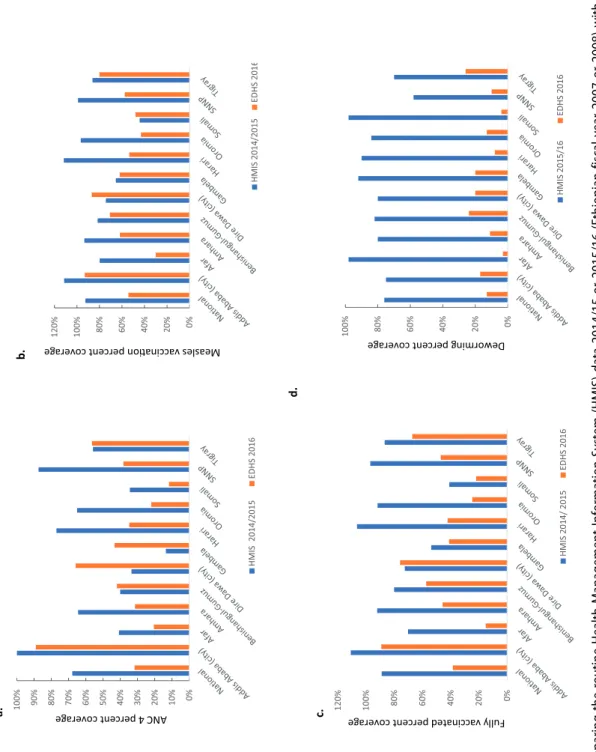
The number of women attending four antenatal care visits varied in a non-systematic way. Nevertheless, most regions reported higher num-bers in the routine HMIS than was recorded in the EDHS (Figure 3(a)). Similar patterns were noted for the first antenatal care visit and early postnatal care (data not shown). The combined national institutional and community early neona-tal deaths in the routine HMIS were 11 755 chil-dren in 2014/15, 7 591 chilchil-dren in 2015/16, and 8
HMIS = Health Management Information System
Penta = vaccine against Diphtheria, Tetanus, Pertussis, Hepatitis B, and Haemophilus Influenzae
aIn the HMIS, a skilled attendant is defined as a health professional (such as a midwife, nurse, health officer or doctor) who has been trained in the skills needed to manage normal (uncomplicated) pregnancies, childbirth and the immediate postnatal period. HMIS also requires that the delivery takes place at a facility. HMIS does not include health extension workers (HEW) or traditional birth attendants (TBA) among skilled attendants. In the EDHS, a skilled attendant is defined as a doctor, nurse, midwife, health officer, or HEW. It does not include TBA.
bEarly neonatal death at community (ECND) and early institutional neonatal death rate (EIND) are reported separately so that ECND and EIND together make up the total early neonatal death. There is no indicator for deaths in day 0–28 in HMIS. In the EDHS, the deaths within day 0–6 can be disaggregated from the total neonatal deaths in day 0–28. Births are registered in another system, the Vital events registration, by the local administration in the kebele (lowest administrative level) that collects data on births and deaths from health facilities and community. The total number of births in the same kebele is the denominator of ECND.
c
HMIS considers a child as having full immunization coverage if he or she received the following vaccines that are in the current Expanded Program of Immunization in Ethiopia: BCG (tuberculosis), 3 doses of Penta, 3 doses of oral polio-vaccine, 3 doses of PCV-vaccine (pneumococcal conjugate), 2 doses of rota-vaccine, 1 dose of IPV-vaccine (inactivated polio vaccine) and 1 dose of measles-vaccine before the age of 1 year. In the EDHS, ‘all basic vaccinations’ is defined as one dose of BCG, three doses of Penta, three doses of polio vaccine and one dose of measles vaccine, whereas ‘all age-appropriate vaccinations’ also include the newer vaccinations: 3 doses of PCV and 2 doses of rota, but not IPV. The denominator ‘estimated number of surviving infants’ refers to the population estimate and is used for denominators as stated in the table (MOH, personal communication). In contrast, the guideline states that the denominator ‘total number of surviving infants’, meaning infants who survive to their first birthday, to be used for measles and fully immunized, but not for Penta 3 where the estimated number of infants is in the guideline.
d
In EDHS, the reported deworming among children 6–24 months for the younger ages may represent treatments rather than prophylaxis. In HMIS, the indicator severe acute malnutrition (SAM) is the proportion of children screened for SAM (coverage) and findings are further classified into prevalence of SAM, using the definitions Middle Upper Arm Circumference (MUAC) <11 cm or weight for height <70% of the median, or <-3 Z score (used in health centers and hospitals) and/or bilateral pitting edema (used in all health facilities). The growth monitoring promotion (GMP) is a preventive activity that includes measuring, analyzing and counseling on nutrition and is therefore not the same as the SAM-screening.
eThe ORCA malaria group studied the suspected, confirmed, and all malaria (=”total malaria”) as reported in the HMIS-framework. These measurements are data elements and ‘All malaria’ is the numerator of the corresponding burden-of-disease HMIS-indicator ‘Morbidity attributed to malaria’, and the estimated total population is the denominator. ‘All malaria’ is ‘positive malaria’ with the addition of ‘Clinical diagnosis of malaria’ (=presumed treatment) (Supplementary Figure S1). In the EDHS, only the use of anti-malarial drugs is surveyed.
fThe ORCA tuberculosis group studied the new and relapse cases and treated cases of tuberculosis as reported in the HMIS (Supplementary Figure S2). Number of new and relapse cases is the numerator of ‘Tuberculosis case detection rate’ where the annual WHO-estimate is the denominator. The treated tuberculosis is the denominator of the indicator ‘Treatment success of TB patients who received community-based treatment’ which aims at determining the proportion of all forms of new TB cases successfully treated (cured plus completed treatment) among those who received treatment adherence support at community for at least full course of the continuation phase treatment. Tuberculosis is not investigated in the EDHS.
Table 3a. Total number of women coming for postnatal care within two days of birth by region and month in the routine Health Management Information System, July 2017-June 2018. Internal consistency. Outliers within 2–3 standard definitions from the mean value per region or city administration are underlined and extreme outlier >3 standard deviation from the mean shown in bold. Month Area 1 2 3 4 5 6 7 8 9 10 11 12 Addis Ababa (city) 7931 8593 7968 7831 6634 7885 7574 7751 8200 8067 10,476 9411 Afar region 2035 2166 2257 2412 2352 2366 2090 2417 2122 2220 1986 2025 Amhara region 41,038 46,691 43,515 43,274 45,177 46,155 47,399 46,338 45,133 44,393 49,375 40,134 Benishangul-Gumuz region 2658 2584 2737 2713 2591 3040 3069 2185 2190 2426 2235 1886
Dire Dawa (city) 765 854 847 819 664 1887 858 969 1153 833 887 816
Gambela region 376 339 493 453 440 378 363 412 330 301 448 408 Harari region 371 368 367 417 511 420 450 664 352 463 598 526 Oromia region 86,731 91,638 87,213 86,251 81,345 82,934 73,409 81,902 82,561 78,682 79,480 80,085 Somali region 8725 7388 7158 7225 6769 9793 9780 9005 9350 5511 6191 5518 SNNP region 44,133 48,510 - - 0 48,117 48,501 50,728 50,710 52,918 54,677 50,198 Tigray region 9532 10,455 10,853 10,928 10,357 11,849 11,581 10,884 11,205 11,050 11,644 10,377 - No value
117 children in 2016/17. The neonatal mortality rate of 30 per 1000 live births [2], population 109 million, and crude birth rate of 32.2/1000 from 2018 [15] would result in an expected number of 3.5 million annual births and 100 000 deaths within the first month of life every year. With 75% of neonatal deaths occurring in the first week [1], the expected number of annual early neonatal deaths on day 0–6 of life would be around 75 000. Hence, our results indicate that only one in eight early neonatal deaths were reported in the routine HMIS.
The immunization indicators generally showed good agreement when comparing the routine HMIS with the Ethiopian Demographic and Health Survey
(Figure 3(b)). Nevertheless, this external consistency
was lower for the indicator ‘fully immunized chil-dren’ (Figure 3(c)) and for ‘vaccinated with the third dose of the pentavalent vaccine’ and for the number of vaccine doses distributed (Supplementary Figure S2). The child nutrition indicators, such as deworming, showed weak consistency when compar-ing the routine HMIS with the Ethiopian Demographic and Health Survey 2016 (Figure 3(d)). Indicators suggested a decreasing incidence of malaria over time, but the number of prescribed antimalarials was higher than malaria cases reported in the routine HMIS (data not shown).
Data quality review dimension 4: external comparison of population data
The 0.7 million births reported in 2017/2018 routine HMIS was compared to the crude birth rate of 32.6 per 1000 population [15]. With Ethiopia´s popu-lation of 110 million [15,16], the expected number of births was 3.6 million per year, and hence we estimate only 19% of births were reported in the routine HMIS.
Discussion
This study of routine HMIS data quality in Ethiopia showed quality problems for all indicators, especially compared to external information sources. Indicators regarding some aspects of maternal health care and immunization were mostly complete and consistent over time. Indicators on child nutrition, malaria, and tuberculosis were more prone to outliers, less consis-tent over time, and showed major differences when triangulated with other information sources. Most notably, the indicators on births and neonatal mor-tality were incomplete and had very low internal and external consistency. We also identified regional dif-ferences in the quality of the routine HMIS data.
Indicator definitions and reporting guidelines The indicators and data elements reflect an ambition to improve health care and a desire to capture new interventions. However, including a large number of complex indicators and data elements may also con-tribute to the burden of reporting and the risk of errors. The HMIS Indicators Reference Guide for routine HMIS [11] provides information in English on the definition of indicators. Work is ongoing efforts to translate the national guidelines to the major languages used in Ethiopia, and this is likely to increase the understanding of indicator definitions at the health system’s lower levels.
Several issues on reporting may need to be addressed: double-reporting, if the first visit by a pregnant woman for antenatal care was registered at a health post and again at a health centre, or over- reporting, if an antenatal care visit close to the expected date of delivery is recorded as the fourth visit irrespective of the number of visits. Another example of a reporting issue is vitamin A supplementation. There may be a lack of clarity over whether the number reported represents the Table 3b. Total number of early neonatal death at community by region and month in the routine Health Management Information System, July 2014-June 2015. Internal consistency. Outliers within 2–3 standard definitions from the mean value per region or city administration are underlined.
Month Area 1 2 3 4 5 6 7 8 9 10 11 12 Addis Ababa (city) - - - -Afar region 2 0 0 2 5 2 4 3 4 0 1 0 Amhara region 8 4 34 19 10 13 14 17 10 13 8 42 Benishangul-Gumuz region 3 1 16 6 5 4 5 6 20 1 11 25
Dire Dawa (city) 0 0 0 0 0 0 0 0 0 0 0 0
Gambela region 0 0 0 6 0 1 0 0 0 1 0 3 Harari region 0 0 0 0 0 0 0 0 0 0 0 1 Oromia region 58 43 44 82 22 59 28 21 14 28 16 24 Somali region - - - 0 - - 0 0 0 1 0 0 SNNP region 1041 43 1701 2008 20 9 160 13 17 24 145 4 Tigray region 19 5 8 3 5 8 7 4 7 5 5 2 - No value
SNNP = Southern Nations, Nationalities, and Peoples
number of children or the number of doses of Vitamin A provided. The data element ‘total number of births in the same kebele’ includes both institu-tional births and births in the community: this data
element was severely under-reported. The reasons for not reporting neonatal deaths in the routine HMIS need to be further explored as part of the efforts to reach the global target of less than 12 deaths per 1000 live births by 2030 [20–22].
The WHO toolkit provided a useful method for analysing data. Triangulating routine HMIS data can increase the awareness of quality problems and help go beyond analysing the accuracy of reporting within the routine HMIS [23,24]. To some extent, discrepancies in external consistency may be due to reporting errors that affect indicators to varying degrees in the surveys used for comparison. A woman likely remembers where she last gave birth, but the exact number of antenatal visits may be more challenging to capture [25]. Integrated and continuous surveying by perma-nent survey teams has been suggested as a model for countries aiming at improving their routine HMIS [26]. An initial step could be to use the already existing surveys for these comparisons, despite the long time interval between surveys which would hamper the analyses. One recent scoping review on child immuni-zation in Ethiopia identified considerable discrepancies in reports from various sources, and used this infor-mation to identify research priorities, consulting an expert panel of stakeholders [27].
0 1 2 3 4 5 6 7 8 9 10 11 N u m b e r o f r e g io n s
Figure 1. Number of regions and city administrations (n = 11) with internal consistency over time per routine Health Management Information System indicator or data element (n = 19).
Kebele = lowest administrative level
0 2 4 6 8 10 12 14 16 18 20 N u m b e r o f H M IS I n d ic a t o r s
Figure 2. Number of routine Health Management Information System indicators (n = 19) that showed internal consistency over time per region or city administration (n = 11).
c. d . 0 % 2 0 % 4 0 % 6 0 % 8 0 % 1 0 0 % 1 2 0 % H M IS 2014/ 2015 E D H S 2 0 1 6 0 % 2 0 % 4 0 % 6 0 % 8 0 % 1 0 0 % H M IS 2 0 1 5 / 1 6 E D H S 2 0 1 6 Fu lly v ac cin at ed p er ce nt c ov er ag e De wo rm in g p er ce nt c ov er ag e a . b . 0 % 1 0 % 2 0 % 3 0 % 4 0 % 5 0 % 6 0 % 7 0 % 8 0 % 9 0 % 1 0 0 % H M IS 2 0 1 4 / 2 0 1 5 EDH S 2 0 1 6 0 % 2 0 % 4 0 % 6 0 % 8 0 % 1 0 0 % 1 2 0 % H M IS 2 0 1 4 / 2 0 1 5 E D H S 2 0 1 6 Me as le s v ac cin a! on p er ce nt c ov er ag e AN C 4 p er ce nt c ov er ag e Figure 3. External consistency comparing the routine Health Management Information System (HMIS) data 2014/15 or 2015/16 (Ethiopian fiscal year 2007 or 2008) with the Ethiopian Demographic and Health Survey (EDHS) 2016 for (a) coverage of four antenatal care visits, (b) coverage of vaccinations against measles, (c) fully vaccinated 1-year old children and, (d) coverage of deworming of children.
Some strengths of this study are that we used a WHO data quality review toolkit [18] and that the work was led by analysts familiar with the routine HMIS data. Implementation research is likely more efficient when conducted by the usual implementation agencies, as in this study [28]. We compared results for indicators defined differently by different but compa-tible sources, and we explored these differences in indicator definitions. Timeliness is one aspect of data quality that was not addressed in this study. In our research, the newly introduced vital events registration was not assessed. Also, we did not evaluate data quality at the district and facility levels.
Conclusion
We analysed the consistency of routine HMIS data and identified strengths and challenges in Ethiopia’s routine HMIS data. We conclude that the internal consistency varied between indicators and regions. In general, internal consistency in the routine HMIS was better for indicators on maternal health and immunization than for other indicators. Internal con-sistency was better than external concon-sistency, where routine HMIS data were compared with data from other sources, mostly survey data. The lack of exter-nal consistency suggests quality problems in the rou-tine HMIS data that go beyond correct reporting. We also conclude that the uncertainty of population esti-mates makes a major contribution to discrepancies. We suggest future reality-checks with triangulation of routine HMIS and data from other sources and align-ment of routine HMIS indicators with those of the EDHS to increase comparability. Together with the ongoing digitalisation that is part of the Information Revolution brought forward by the MOH, our sug-gestions may improve the routine HMIS data quality. In Ethiopia and globally, improved routine HMIS data are pivotal to achieving universal health cover-age [29].
Acknowledgments
The ORCA team wishes to express its sincere gratitude to the Ministry of Health, Ethiopia, the Ethiopian Public Health Institute, and the Ethiopian Pharmaceutical Supply Agency for their strong support.
Disclosure statement
No potential conflict of interest was reported by the authors.
Funding information
The ORCA project was funded by the Bill and Melinda Gates Foundation with a grant to the London School of Hygiene & Tropical Medicine [INV-010320].
Ethical approval
This study only included secondary data analysis.
Paper context
Continuous data generated at the point of service delivery is pivotal for decision-making to ensure quality, equality, and accountability in health services. We analysed routine Health Management Information System data and com-pared it with surveys. We identified variations in quality between indicators and regions and issues on the defini-tions and complexity of indicators. Data on coverage were affected by the low quality of population estimates. We provide recommendations to strengthen the routine Health Management Information System.
ORCID
Abyot Adane http://orcid.org/0000-0001-9831-3248
Habtamu A. Anteneh http://orcid.org/0000-0003-3755-
3357
Emiamrew S. Ayalew http://orcid.org/0000-0002-4857-
5802
Della Berhanu http://orcid.org/0000-0002-4984-893X
Misrak G. Beyene http://orcid.org/0000-0002-6629-756X
Antoinette Bhattacharya http://orcid.org/0000-0001-
5400-9383
Eshetu Cherinet http://orcid.org/0000-0003-2882-5998
Heven S. Firew http://orcid.org/0000-0002-2732-1635
Zenebech Gella http://orcid.org/0000-0001-8881-0152
Addis Girma http://orcid.org/0000-0003-2800-2916
Sorsa F. Jama http://orcid.org/0000-0002-7637-3255
Carina Källestål http://orcid.org/0000-0002-3206-6528
Seblewengel Lemma http://orcid.org/0000-0001-5910-
3723
Yidnekachew D. Mazengiya http://orcid.org/0000-0002-
0224-1890
Joanna Schellenberg http://orcid.org/0000-0002-0708-
3676
Tefera Taddele http://orcid.org/0000-0002-2327-136X
Kidist Woldesenbet http://orcid.org/0000-0003-1016-
6656
Yakob Wondarad http://orcid.org/0000-0001-7415-5767
Mebratom H. Zeweli http://orcid.org/0000-0002-7845-
2790
Lars Åke Persson http://orcid.org/0000-0003-0710-7954
Annika Janson http://orcid.org/0000-0001-5106-5670
References
[1] Central Statistical Agency, Ethiopia. Ethiopia
demo-graphic and health survey 2016 [Internet]. 2016 [cited
2020 Mar 16]. Available from: https://www.csa.gov.et
[2] Ethiopian Public Health Institute and ICF. 2019
Ethiopia mini demographic and health survey. 2019.
[3] Wagenaar BH, Sherr K, Fernandes Q, et al. Using routine health information systems for well-designed health evaluations in low- and middle-income
countries. Health Policy Plan. 2016 Feb;31(1):129–135.
[4] Ministry of Health, Ethiopia. Health sector
transfor-mation plan (HSTP) 2015/16-2019/20 [Internet]. 2015
[cited 2019 Oct 9]. Available from: https://www.global
financingfacility.org/sites/gff_new/files/Ethiopia- health-system-transformation-plan.pdf
[5] Ministry of Health, Ethiopia. Information revolution.
Addis Ababa: Ministry of Health; 2020. http://www.
moh.gov.et/ejcc/am/Information_Revolution_Booklet
[6] Bhattacharya AA, Umar N, Audu A, et al. Quality of routine facility data for monitoring priority maternal and newborn indicators in DHIS2: A case study from
Gombe State, Nigeria. PLoS One. 2019;14(1):e0211265.
[7] Maïga A, Jiwani SS, Mutua MK, et al. Generating statistics from health facility data: the state of routine health information systems in Eastern and Southern
Africa. BMJ Glob Health. 2019 Sep;4(5):e001849.
[8] Maokola W, Willey BA, Shirima K, et al. Enhancing the routine health information system in rural south-ern Tanzania: successes, challenges and lessons
learned. Trop Med Int Health. 2011;16(6):721–730.
[9] Zeleke AA, Worku AG, Demissie A, et al. Evaluation of electronic and paper-pen data capturing tools for data quality in a public health survey in a health and demo-graphic surveillance site, Ethiopia: randomized controlled crossover health care information technology evaluation.
JMIR Mhealth Uhealth. 2019 Feb 11;7(2):e10995.
[10] Lemma S, Janson A, Persson L-Å, et al. Improving quality and use of routine health information system data in low- and middle-income countries: A scoping
review. PLoS One. 2020;15(10):e0239683. Accepted
September 11, 2020.
[11] Ministry of Health, Ethiopia. Indicator reference guide. 2018.
[12] Ministry of Health, Ethiopia. Information use training module, participants' manual. Policy, Planning and Monitoring & Evaluation directorate; 2018.
[13] Bhattacharyya S, Berhanu D, Taddesse N, et al. District decision-making for health in low-income settings: a case study of the potential of public and private sector data in India and Ethiopia. Health
Policy Plan. 2016 Sep;31(suppl 2):ii25–34.
[14] Aqil A, Lippeveld T, Hozumi D. PRISM framework: a paradigm shift for designing, strengthening and eval-uating routine health information systems. Health Policy
Plan. 2009;24(3):217–228.
[15] World Bank. World bank data [Internet]. 2020 [cited
2020 Apr 12]. Available from: https://data.worldbank.
org/indicator/SP.DYN.CBRT.IN?locations=ET
[16] Central Statistical Agency, Ethiopia. Population
pro-jections for Ethiopia 2007–2037. 2013.
[17] Ministry of Health, Ethiopia. Woreda based health
sector annual core plan EFY 2011 (2018/2019). 2019.
[18] World Health Organization. World Malaria report
[Internet]. 2015 [cited 2020 Apr 15]. Available from:
www.who.int
[19] World Health Organization. Data quality review
(DQR) toolkit [Internet]. 2017. Available from: www.
who.int
[20] Persson L-Å. Global investment is needed so that countries can reduce neonatal mortality to below 12 death per 1000 live births by 2030. Acta Paediatrica.
2020 September 12. DOI:10.1111/apa.15530.
[21] Borde MT, Loha E, Johansson KA, et al. Financial risk of seeking maternal and neonatal healthcare in south-ern Ethiopia: a cohort study of rural households.
Int J Equity Health. 2020 Dec;19(1):69.
[22] Borde MT, Loha E, Lindtjørn B. Incidence of post-partum and neonatal illnesses and utilization of healthcare services in rural communities in southern Ethiopia: A prospective cohort study. Farrar D, editor.
PLoS One. 2020 Aug 27;15(8):e0237852.
[23] Mulissa Z, Wendrad N, Bitewulign B, et al. Effect of data quality improvement intervention on health management information system data accuracy: an interrupted time series analysis. Kabir R, editor.
PLoS One. 2020;15(8):e0237703.
[24] Janmohamed A, Doledec D. Comparison of adminis-trative and survey data for estimating vitamin A supplementation and deworming coverage of chil-dren under five years of age in Sub-Saharan Africa.
Trop Med Int Health. 2017;22(7):822–829.
[25] Violán C, Foguet-Boreu Q, Hermosilla-Pérez E, et al. Comparison of the information provided by electronic health records data and a population health survey to estimate prevalence of selected health conditions and multimorbidity. BMC
Public Health. 2013;13(1):251.
[26] Rowe AK. Potential of integrated continuous surveys and quality management to support monitoring, eva-luation, and the scale-up of health interventions in
developing countries. Am J Trop Med Hyg. 2009 Jun
1;80(6):971–979.
[27] Tilahun B, Mekonnen Z, Sharkey A, et al. What we know and don’t know about the immunization pro-gram of Ethiopia: a scoping review of the literature.
BMC Public Health. 2020;20(1):1365.
[28] Alonge O, Rodriguez DC, Brandes N, et al. How is implementation research applied to advance health in low-income and middle-income countries? BMJ Glob
Health. 2019 Mar;4(2):e001257.
[29] United Nations General Assembly. Resolution adopted by the general assembly on 12 December 2012, 67/81. Global health and foreign policy; 2012 [cited 2020 Feb
28]. Available from: https://www.un.org/en/ga/search/
view_doc.asp?symbol=A/RES/67/81