Geometrical aspects of the fatigue behaviour of laser hybrid fillet welds
10
0
0
Full text
(2) samples, (v) FEA for measured micro- and macro-surface geometries, (vi) quantitative and qualitative analysis and discussion of the results. In particular conclusions on the mechanism and contributions from the joint geometry in competition to the weld macro-shape and the topography shall be drawn and described by a theory. 3. HYBRID WELDING EXPERIMENTAL SETUP AND RESULTS. The joint type studied involves two 10 mm thick steel plates in butt configuration, but with m = 5 mm eccentricity, see Fig. 1. This design was stipulated for a specific industrial application. Structural stainless steel SS2333 was used with sample dimensions of w x l x t = 50 x 100 x 10 mm3, prepared by milling and grinding of the joint surface to give zero gap. Fillet welds were made between two base plates with 5 mm eccentricity using the hybrid laser metal inert gas (L/MIG) welding technique, see Fig. 1. After the welding had been completed, all specimens were milled to remove about 12.5 mm from both ends of the weld to remove start and stop defects. Consequently, a small square plate with 25 x 25 x 5 mm3 dimensions was attached by manual arc weld under the eccentric base metal to facilitate sample attachment to the fatigue testing machine. The load condition was 4point bending (see later), applying the force from the bottom. Figure 2 shows a typical top surface and weld cross section. The effective weld throat thickness is 6-7 mm and the leg length is 4 mm. The yield stress of the parent material is 210 MPa (Rp0.2) and the tensile strength is 440 MPa (Rm). As the bending force acts from the bottom, the weld root shape is not important, as this area is under compressive stress. In contrast, the shape of the top of the weld was critical to the fatigue performance of these specimens. Detailed welding process parameters and material properties are described in [8, 9].. Figure 1. Eccentric filler joint. (a) (b) Figure 2. Typical resulting weld: (a) weld top surface appearance, (b) defect-free weld cross section. 4. WELD SURFACE SHAPE ANALYSIS. 4.1 Smooth Surface Shape - Global Geometry Conventionally, the local weld geometry, i.e. weld toe radius, weld angle and notch depth is measured by the non-destructive plastic replica technique [10, 11]. In this experiment, the weld toe radii and weld toe angle was measured by plastic replica method and plotted into Fig. 3. Scattered toe radius and toe angle have been seen into Fig. 3 which indicates toe radii varies along the weld. The measured data (radius and angle) were used to create a two-dimensional FEA model to calculate the stress concentration factor; Kt. Researchers have shown larger toe radii and smaller toe angle gives lower Kt [12]. In order to calculate the stress fields and the stress concentration factors in the weld toes, stress analysis was carried out with the FEA using the ANSYS 11 software [13]. A.
(3) linear elastic 2D model with the assumption of plane stress with thickness was applied, 25000 8-nodes quadrilateral elements were used, with mesh refinement around the toe regions. Due to large scatter of toe radii, different radii-combinations were studied. Figure 4(a) shows stress field of smooth toe radii. Kt as a function of the toe radius is plotted in Fig. 4(b). This figure shows how a smaller lower toe radius induces a much a higher stress peak than the upper toe, but for increasing radius this becomes less pronounced. Nevertheless, the lower toe has a shorter distance (throat) to the root and thus remains dominant. This indicates that the lower toe for eccentric filet joints in a four point bend situation is critical at the macro geometry level.. Figure 3. Measured local weld geometry. (a). (b). Figure 4. Calculated stress (1st principle in MPa) fields: (a) for a smooth surface for 1 mm lower and upper toe radii cross section, (b) stress concentration factor as a function of the upper and of the lower toe radius (Upper toe radius kept constant at 1 mm) 4.2. Surface Topography - Local Geometry. Toe radius is considered the most significant parameter for the stress concentration [14, 15], however out of our thirteen samples, only four specimens were cracked at the lower toe region whereas the rest of the specimens cracked within the weld bead, i.e. in the weld surface ripples. Therefore, the micro-topography (surface microgeometry) of the welds was also studied. A Wyko NT1100 was used as 3D optical profiler. A typical topography scan taken from the lower toe is shown in Fig. 5, showing the resolidification patterns which cover the surface. The measured data for three locations was extracted and imported into the FE code to compare with the ideal toe radius. Compared to the ideal toe radii, the highest stress peak are almost four times higher, see Figure 6 where stress peaks above Kt = 4 were classified as unrealistic. The present study aims to indicate the importance of stress raising resulting from features of the measured topography (compared to a smooth surface) for crack initiation. Once a crack is initiated, the stress level rapidly decays to the typical crack tip raiser values, thus the values of surface curvature and their stress peaks lose importance. Compared to the stress peaks from the toe radii, the welding ripples can cause significantly higher stress concentration. However, in the cases studied, the differences between the ripples were not so significant, therefore a ripple in the toe showed highest stress, as combined with the toe radius and neck impact. However low toe radii will shift the peak value to the most critical ripple in the weld bead..
(4) Figure 5. Typical measured weld surface topography at the lower toe radius; the ripples govern the surface curvature on a micro scale. (a) (b) Figure 6. Stress (1st principle in MPa) fields calculated by FEA for a simplified cross section for the measured topography profile (a) case 1, (b) Stress concentration factors across the (simplified) weld surface for smooth surfaces for three radii and when considering the roughness (case 1, 1.5 mm, cut-off above Kt=4) and corresponding roughness distribution for three cases 5. FATIGUE ANALYSIS. 5.1. Fatigue Testing Set-Up. The four point bend fatigue testing was performed, using a servo- hydraulic machine (Instron 1272 max ± 50 kN). The welded joints were tested by keeping a constant amplitude stress ratio, R = 0 at a frequency of 45 Hz as shown in Fig. 7(a). The specimens were tested in the range from 2.5 kN to 4 kN until complete failure or to an endurance of 2 million cycles if there was no evidence of fatigue cracking as shown in Fig. 7(b). A thicker beam than the base metal was specially prepared and hardened for fatigue testing with two different grooves so that the roller can fit the groove.. (a) (b) Figure 7. Test arrangement and results: (a) four-point fatigue bending test (note: the weld is upside down), (b) cross-section of fatigue crack propagation from lower toe with lack of fusion defect.
(5) 5.2. Nominal Stress Approach. The stresses were calculated by FEA [13]. The fatigue resistance data and stresses were then compiled into a logarithmic S-N curve (Wohler curve) as shown in Fig. 8(a) to describe the fatigue strength. The equation for SN-curves can be written as [16];. N=. C. (1). Δσ m. where, N is the number of cycles to failure, Δσ is the stress range, m is the slope of the S-N curve and C is the load intensity value (Capacity). Since no standard definitions exist so far for fillet joints with 5 mm eccentricity under a four point bending condition, all the calculations for fatigue strength were stand alone and not comparable [16], [17]. The fatigue test properties identified are shown in Table 1. The mean value (Pf 50%) of the fatigue strength was calculated with a slope of m=3, excluding the run outs. Also, the fatigue classes FAT on 50% and 95% survival probability levels were calculated according to IIW recommendations [16]. From the fatigue test data a mean linear regression analysis was carried out, assuming a straight line of the SN-curve. This gave a slightly higher natural slope m of the SN-curves of 3.16. The mean Pf 50% was also increased to 141 MPa. The Kt and C values of each specimen were calculated according to [16] and shown in Fig. 8(b). The tested samples can be divided into two groups, i.e. weld bead failure (WBF) and toe failure (TF). The majority of the cracks were formed in the weld bead even though the toe radius is traditionally considered the most significant influence on crack initiation. In Fig.8(b), WBF specimens show higher fatigue strength and lower stress concentration at the toe than the TF specimens, indicating that a larger toe angle and smaller toe radius creates higher stress concentration. This indicates that large toe radius and low toe angle shift the crack initiation from the weld toe to the weld bead, giving higher fatigue strength. The predicted and experimental fatigue lives for the as welded conditions at selected nominal stress ranges for all eccentric fillet joints are summarized in Fig. 9. The prediction shows good correlation with the experiments, although the fatigue test results are scattered. The local weld geometry and crack growth data used were the average values. A 0.1 mm initial line crack is assumed as a starting crack at the weld toe. Also a crack initiation period and threshold effect could have an influence on the fatigue life prediction at cycles larger than one million cycles.. 13.25. Toe failure. Log(C). Weld bead failure. 12.75. 12.25 2.50. 3.00. 3.50. 4.00. Kt (-). (a). (b). Figure. 8 Fatigue testing results: (a) S-N-curve together with mean line (50% failure probability) evaluated with m=3, natural mean line with m evaluated with linear regression and the FAT (5% failure probability) line according to the IIW-standard, (b) Capacitive value C (m=3) as a function of the stress concentration factor Kt, distinguishing toe failure and weld bead failure specimens.
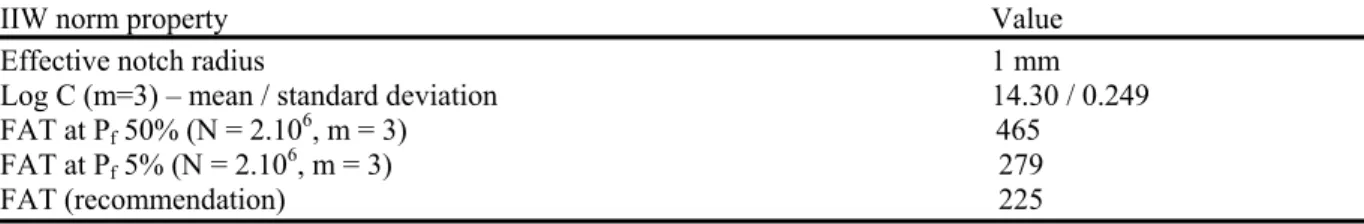
(6) 1000. Nominal stress (MPa). Experimental Predicted. 100 1.E+05. Local weld geometry UTRmean = 1.15 mm LTRmean = 1.45 mm Kt = 3.09 θmean = 45° crack, ai = 0.1mm. Cycles to failure. 1.E+06. Figure 9. Predicted and experimentally obtained fatigue live Table 1. Fatigue testing results IIW norm property Kt – mean / standard deviation Log C (m=3) – mean / standard deviation m – natural slope Mean value, (N = 2.106, m = natural slope) Mean value, Pf 50% (N = 2.106, m = 3) FAT, Pf 5% (N = 2.106, m = 3) 5.3. Value 3.09 / 0.35 12.71 / 0.18 3.16 141 137 95. Effective Notch Stress Approach. The effective notch stress is defined as the total stress at the root of a notch, obtained assuming linear-elastic material behavior. To take account the statistical nature and scatter of the weld shape parameters, as well as the non-linear material behavior at the notch root, the real weld contour is replaced by an effective notch root radius of 1 mm. This is considered to represent a normal weld that has not undergone any post-weld treatment. The effective notch radius is introduced such that tip of the radius touches the root of the real notch. The approach is well suited for the FE-method even though the size of the elements at the notch has to be relatively small, approximately 0.25-0.35 mm, in order to achieve a good resolution of the stress field. A comprehensive review of notch stress methods can be found in Radaj et.al. [18]. The effective notch stress was calculated for each specimen assuming an effective weld toe radius (1 mm) and excluding the actual notch radius as outlined in the recommendations in [16]. The toe angle was set to θ = 45° which has given mean stress concentration factor, Kt=3.36. Maximum principle stresses from notch tip obtained from FE-simulation, is plotted against experimentally observed fatigue cycles into Fig. 10. Effective notch stress fatigue assessment is summarized into Table 2. The characteristic curve (P5% =279 MPa) for all the specimens is above the characteristic curve, FAT 225 MPa, recommended by IIW [16]. The higher characteristic value than recommendation might be due to bending load situation and crack initiation from the weld bead. Table 2. Evaluation of fatigue test result of as welded specimens using effective notch stress method according to IIW. IIW norm property Value Effective notch radius 1 mm Log C (m=3) – mean / standard deviation 14.30 / 0.249 465 FAT at Pf 50% (N = 2.106, m = 3) 279 FAT at Pf 5% (N = 2.106, m = 3) FAT (recommendation) 225.
(7) P50% = 465 MPA. FAT 225 (m=3) P5% = 279 MPA. Figure 10. Evaluation of fatigue test results using the IIW effective notch stress method 5.4. Linear Elastic Fracture Mechanics Approach. Weld defect assessment using linear elastic fracture mechanics (LEFM) crack growth analysis was carried out in order to study the effect of crack like defects that where detected in the welded joints; upper- and lower-weld toe and lack-of-fusion. The objective was to study the impact of different defect sizes, crack propagation interaction and fracture avoidance from the different failure critical positions. The total fatigue life of welds involves both a crack initiation and crack propagation stage. For welded joints an initial crack is assumed to exist due to the presence of weld defects and the major part of the fatigue life is consumed by propagation. This is a conservative way of predicting fatigue life in some cases, especially if a (large) defect is assumed to take the form of a straight-fronted ‘line’ crack (depth/surface length a/2c = 0). However, the crack initiation phase is a negligible part of the fatigue life if accurate inspections are not utilised in the serial production of welds. A 2D plane strain FE model was used for the LEFM calculations together with the crack simulator Franc2D [19]. The weld toe radii, upper and lower, were modelled with a radius of 1 mm. The interaction theory for Mode I/II for the propagating cracks is the σθ,max theory which states that crack will propagate in the direction of maximum circumferential stress around the crack tip [20]. A unity load (1N) was used according to the loading positions in the fatigue test rig for four point bending. The crack starting position, as shown in Fig. 11, is from the lower weld toe (B) including lack of fusion (C). The assumption is that the initial crack in lower toe is surface ripples which is considered as undercuts [21] and with initial size of ainitial = 0.1. The initial LOF size (C) is assumed to be 3 mm in the multiple crack growth interactions. The crack initiation and propagation path from lower toe is shown in Fig. 11. Different crack initiation sites are considered here which are upper toe (A), lower toe (B), LOF (C) and weld bead (D). Of the four different cracks, crack B gives the highest stress intensity and the highest possibility to propagate, see Figure 12 (a). For the combined cases, crack B + C shows the lowest fatigue life comparing all other cracks as shown in Fig. 12(b). Individual cracks i.e. only A, B and D always shows higher fatigue life than combined with C. Thus it can be considered that lack of fusion (C) slightly (< 10%) reduced fatigue life. Since crack C is not propagated under fully compressive load situation competing with other surface cracks, it is not critical.. (a) (b) Figure 11. Simulation of fatigue crack propagation: a) crack initiation and b) crack propagation.
(8) 60. Crack length(mm). ΔKI(MPa√mm). LOF. 40. AC. 3.5. Weld bead 50. A. 4. Upper toe. Low er toe. 30 20 10. B. 3. BC. 2.5. D. 2. DC. 1.5 1 0.5. 0 0. 1. 2. 3. 4. 0 0.E+00. Crack length (m m ). 2.E+06. 4.E+06. 6.E+06. 8.E+06. 1.E+07. Cycles to failure. (a) (b) Fig. 12. Fatigue strength analysis: (a) maximum stress at the key tips as a function of the crack propagation length for the different crack location, (b) fatigue life comparison for different crack situation (A-Upper toe, BLower toe, C-Lack of fusion, D-weld bead) 6. DETECTION AND CHARACTERIZATION OF WELD DEFECTS. In this experiment, there are two different types of crack surfaces observed i.e. cracks in the weld bead and in the weld toe. Both cracks are originated due to undercuts according to J.L. Otegui et al. [21]. Surface ripples or waviness are considered here as undercuts. Crack propagation which follows weld surface ripples and initiation points for weld bead failure specimen are shown in Fig. 14. At 13 (a), crack propagation on different planes exactly follows surface ripples path and joins together afterwards which forms step known as ratchet marks [22]. On the crack face at 13(b), multiple crack initiation point with ratchet mark has been seen. After a few millimeters of crack growth, when the ratchet line vanishes the individual cracks fully coalesce into a single uniform through crack across the specimen [23]. When studying the fracture of specimen at toe failure, several chevron marks are observed with ratchet lines which are shown in Fig. 13(b). Usually chevron marks point to the crack origin. Even though the specimen contains many initiation sites, only a few of them become predominant during the fatigue damage process.. Chevron mark. (a). (b). Figure 13. Typical fractography microscope images: (a) weld surface with crack propagating along the ripples, (b) crack surface along the weld, showing crack initiation points 7. DISCUSSION AND THEORY ILLUSTRATION. In this paper fatigue behavior study of laser hybrid welded eccentric fillet joint was discussed. The surface geometry of the welded joint was mostly focused in this study since all most all cracks initiated from either weld toe or weld bead. FE analysis with the measured toe radius from plastic replica shows maximum stress at the lower toe radii. Subsequently, fatigue test data with combination of FE results, lead to plot a SN curve for eccentric fillet joints where the natural slope increases from 3.0 to 3.16. While comparing global stress with local topography, surface ripples were stress raisers. The cross section of fatigue tested samples and the crack plane were observed to identify the crack initiation and propagation path. A correlation was thus found in local stress raisers and crack initiation points. Linear elastic fracture mechanics crack growth analysis was then carried out by combining information from local stress raisers and fractography. LEFM considers all crack like defects at.
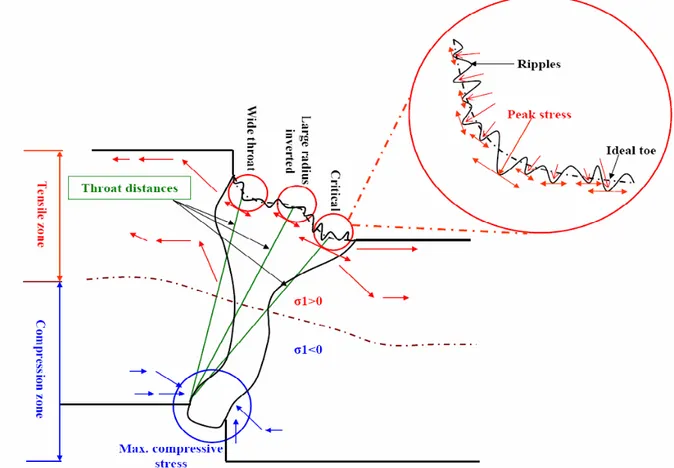
(9) lower toe, upper toe and lack of fusion (LOF) and found that the lower toe has given the highest stress intensity and it propagates exactly the same as observed in the cross section of fatigue tested samples. Four point bend fatigue test were carried out on fillet joint with 5 mm eccentricity at constant stress amplitude ratio. Based on fatigue data, S-N curve was designed as per IIW recommendation for eccentric fillet joint where the fatigue strength at Pf 5% was 95 MPa. Fatigue cracking was observed both in weld toe and weld bead. Multiple crack initiation point was observed in all specimens fracture surfaces with ratchet marks. This ratched mark step vanished when they coalescence. A theoretical description of the findings is illustrated in Fig. 14. Basically it shows that three mechanisms contribute to the maximum stress, namely the throat distance, the toe radius and the ripple radii. Those competing mechanisms determine which region is most critical. Moreover, the root of the weld is uncritical due to its compressive stress environment.. Figure 14. Theoretical description of the competing stress raising mechanisms across the eccentric hybrid weld geometry, including surface ripple topography 8. CONCLUSION. •. The toe radius does not always dominate the fatigue performance, as ripples can become local stress raisers.. •. The lower toe radii are more critical than the upper toe radii in this eccentric fillet joint.. •. If the toe radii are large enough, the stress peak can be shifted to the weld bead; the weld re-solidification ripple pattern guides the cracks.. •. The surface ripples significantly raise stress, but those in the toe normally cause the highest stress, except when the toe radius is small.. •. The effective notch stress method gives higher FAT values then recommendation.. •. LOF is not critical if under fully compressive or at low tensile stresses load which slightly (<10%) reduced fatigue life.. •. Cracking follows the weld ripples at the weld surface..
(10) •. Multiple crack initiation sites were observed on the crack face.. •. The complex geometrical interactions involved (eccentricity under 4-point bending plus throat depth vs. toe radii vs. roughness) can be explained by a theoretical illustration.. •. Standard design rules can be derived for laser hybrid welded eccentric fillet joint.. 9. REFERENCES. [1] S. J. Maddox, Fatigue Strength of Welded Structures, Abington, Cambridge, U.K., 1991. [2] J. A. M. Ferreira, A. A. M. Branco, Int. J. Fatig., 11, 1989, 29-36. [3] V. Caccese, P.A. Blomquist, K.A.Berube, S.R. Webber, N.J. Orozco, Mar. Struct., 19, 2006, 1-22. [4] C.H. Lee, K.H. Chang, G.C. Jang, C.Y. Lee, Eng. Fail. Anal., 16, 2009, 849-855. [5] M.D. Chapetti, J.L. Otegui, Int. J. Fatig., 17, 1995, 531-538. [6] A. Fatemi, L. Yang, Int. J. Fatie., 20, 1998, 9-34. [7] Y. Yao, M. Wouters, J. Powell, K. Nilsson, A. Kaplan, J. Laser App., 18, 2006, 283-288. [8] M.M. Alam, Z. Barsoum, P. Jonsén, H.A. Häggblad,, A. Kaplan, Proc. NOLAMP 12 Conf. 2009, Aug. 2426, Copenhagen, Denmark. [9] M.M. Alam, Z. Barsoum, P. Jonsén, H.A. Häggblad,, A. Kaplan, Proc. ICALEO Conf. 2009, Nov. 2-5, Orlando, Florida, USA ( in press). [10] L.L. Martinez, Fatigue behaviour of welded high-strength steels, Ph.D. thesis, Royal Ins. of Techn, 1997. [11] H. Remes, Strain-based approach to fatigue strength assessment of laser-welded joints, Ph.D. thesis, Helsinki Uni. of Techn., 2007. [12] Z. Barsoum, Residual Stress Analysis and fatigue assessment of welded steel structures, Ph.D. thesis, Royal Ins. of Techn., 2007. [13] ANSYS guide, ANSYS release 11. Houston : Swanson Analysis Systems. [14] J. Martinsson, Fatigue Assessment of complex welded steel structures, Ph.D. thesis, Royal Ins. of Techn., 2005. [15] R. Bell, O. Vosikovsky, S.A. Bain, Int. J. of Fatig., 11, 1989, 3-11. [16] A. Hobbacher, Fatigue design of welded joints and components, IIW document XIII-2151-07/XV-1254-07. [17] H. Narimani, Fatigue strength of laser hybrid welded high strength steel, Master’s thesis, Luleå Uni. of Techn., 2008. [18] D. Radaj, C.M. Sonsino, W. Fricke, Fatigue assessment of welded joints by local approaches, Woodhead publishing, Abington, Cambridge, 2006. [19] FRANC2D. Version 3.2, http://www.cfg.cornell.edu/ [20] F. Erdogan, G.C. Sih, ASME J. of Basic Eng., 85, 1963, 519-527. [21] J.L. Otegui, H.W. Kerr, D.J. Burns, U.H. Mohaupt, Int. J. Press V. Piping, 38, 1989, 385-417. [22] R.W. Hertzberg, Deformation and fracture mechanics of engineering materials, John Wiley and Sons, USA, 1996. [23] Y. Verreman, B. Nie, Fatig. Fract. of Eng. Mat. Struct., 14, 1997, 337- 349..
(11)
Figure


+4


Related documents
Re-examination of the actual 2 ♀♀ (ZML) revealed that they are Andrena labialis (det.. Andrena jacobi Perkins: Paxton & al. -Species synonymy- Schwarz & al. scotica while
The first part describes the general frame- work, including basic observed fatigue crack propagation behaviour of the material when subjected to hold times at high temperature as
Linköping Studies in Science and Technology Dissertation No... Linköping Studies in Science and
Ideella föreningar har lyfts fram som en möjlighet för att ge en god grund för integration, detta genom att de ensamkommande barnen får en möjlighet till att komma i kontakt med
In order to make exclusive claims of property in musical compositions, a monosexual concept of creativity, according to which the composer is the exclusive source
För det tredje har det påståtts, att den syftar till att göra kritik till »vetenskap», ett angrepp som förefaller helt motsägas av den fjärde invändningen,
Department of Management and Engineering Link ¨oping University, SE-581 83, Link ¨oping,
www.liu.se Hugo W ärner High T emper atur e F atigue Behaviour o f Aust enitic St ainless St eel
