This thesis comprises 30 ECTS credits and is a compulsory part in the Master of Science with a Major in Recovery of Energy and material Resources with specialization in Industrial Biotechnology, 120 ECTS
credits
Optimization of NMMO
pre-treatment of straw for
enhanced biogas production
Md. Moniruzzaman Akhand
Abraham Méndez Blancas
Optimization of NMMO pre-treatment of straw for enhanced biogas
production
Md. Moniruzzaman Akhand (monirche4@gmail.com )
Abraham Méndez Blancas(abraham.mendez@rocketmail.com)
Master thesis
Subject Category: Industrial Biotechnology
University of Borås School of Engineering SE-501 90 BORÅS
Telephone +46 033 435 4640
Examiner: Dr Ilona Sárvári Horváth
Supervisor,name: Maryam Kabir, and Dr Ilona Sárvári Horváth Supervisor,address: University of Borås
SE-501 90 BORÅS
Date: 2012-08-29
This thesis comprises 30 ECTS credits and is a compulsory part in the Master of Science with a Major in Recovery of Energy and material Resources with specialization in Industrial Biotechnology, 120 ECTS
credits
Abstract
Modern society depends on fossil fuels to fulfill the increasing energy demand, which could cause further damages in the environment. Therefore, it is mandatory to develop technologies for the production of efficient alternative renewable energy sources, like biofuels. Agricultural waste streams, such as wheat straw, produced in larger amount can be utilized for these purposes, and can be used as raw materials for both ethanol and biogas production. However, the compact structure of lignocelluloses present in these materials makes their biological degradation difficult.
In order to enhance the biogas production, wheat straw milled to 2mm size was pretreated with N-methylmorpholine-N-oxide (NMMO) at 90°C for 7-30 hours in this study. 90°C was applied as treatment temperature for the treatment to be able to investigate if the district heating system could be utilized in the treatment process in the future. The effects of the different pretreatment conditions were then evaluated by running batch anaerobic digestion assays for 45 days at 55°C.
The best result was achieved after 7h treatment, leading to 0.47 Nm3/kg VS of straw methane production, corresponding to an increase by 47% compared to methane production obtained for the untreated straw.
Furthermore, it was possible to recover up to 91.33% of the straw after the NMMO pretreatment. There were no significant changes in the chemical composition of the straw caused by the treatment, however structural analyses, like FTIR for the determination of crystallinity and and Simon Staining for the determination of porosity of the material showed that the crytallinity decreased, while the porosity increased as results of the treatment.
Soaking in water for 72h prior to NMMO treatment was also applied to see whether it can improve the diffusion of NMMO into the material, but without success, due to the dilution of the treatment chemical caused by the soaking. The findings made during the experimental stage indicated that it is possible to run the NMMO pretreatment at an industrial temperature, further evaluation for the economical feasibility of this treatment method is however needed in the future.
Contents
1. Introduction ... 1
1.1 Biogas ... 2
1.2 Biogas production in the world ... 3
2. Biogas Production Process... 4
2.1 Hydrolysis ... 4
2.2 Acidogenesis and Acetogenesis ... 5
2.3 Methanogenesis ... 5
3. Wheat straw as feedstock for biogas production ... 7
3.1 Composition of straw ... 7
3.1.1 Cellulose ... 8
3.1.2 Hemicellulose ... 8
3.1.3 Lignin and Extractives ... 9
3.2 Pretreatment ... 9
3.2.1 Physical Treatment ... 11
3.2.2 Chemical ... 11
3.2.3 Physiochemical Treatment... 12
3.2.4 Biological Treatment ... 12
4. Pretreatment with NMMO ... 13
4.1 Different modes of NNMO treatment ... 14
4.2 De-crystallization of lignocelluloses in NMMO ... 15
5. Material and Methods ... 17
5.1 Raw Materials ... 17
5.2 NMMO Pretreatment ... 17
5.3 Biogas Production ... 18
5.4 Analytical Methods ... 20
5.4.1 Biogas Production/ methane measurements ... 20
5.4.2 NREL Procedures ... 21
5.4.3 Simons’ Stain ... 22
5.4.4 Crystallinity determination by FTIR ... 25
6. Results and Discussion ... 26
6.1 Biogas Production ... 27
6.2 Material Recovery ... 29
6.3 Structural Analysis ... 30
6.4 Straw Composition ... 34
1. Introduction
Energy consumption is an actual global issue and each year the demand increases. Currently around 88% of the employed energy is produced by fossil fuels (Weiland, 2010), but in a close future, fossil fuels would not be able to supply all the required energy demand any longer.
In addition, fossil fuels are not a renewable resource, and the extensive usage of them is responsible for several environmental problems, for instance the increase of global warming, pollution of the environment and several economical/political conflicts around the world. Therefore one of the most crucial and current global challenges is to develop an affordable, efficient and sustainable energy supply that allows us to reduce the dependency on fossil fuels and at the same time reduce the greenhouse gases emissions.
Biogas is an excellent alternative to reduce the dependency on fossil fuels; it is produced by the action of several kinds of microorganisms, which degrade organic matter in anaerobic conditions, also referred as digestion.
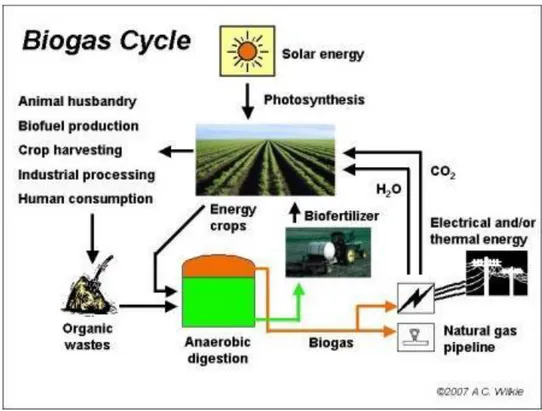
Biogas production can be seen as a sustainable cycle. Figure 1 shows how biogas can be obtained and utilized. It can be produced by the use of crops that fix the carbon dioxide with the help of solar energy to produce biomass, which later is processed to obtain biogas.
Beside of energy crops, organic waste, proceeding from different sources, such as: animal husbandry, biofuel production, crop harvesting, industrial processing or general human consumption can also be used as raw material to produce biogas by anaerobic digestion.
Figure 1Biogas cycle adapted from (Wilkie, 2011)
The biomass obtained from the so called “energy crops”, such as soybean, rapeseed, jatropha or corn, represent a good alternative to produce biogas, but the use of different kind of waste streams, represents an even better option, because these “raw materials” do not have a high
cost, moreover using waste products can be beneficial by giving them a proper bio friendly handling and an economic value.
Moreover, the use of the energy crops is also a controversial issue, because land and resources that can be used to produce food are used instead to produce energy, this problem can be solved by using waste materials as the raw material and at the same time the problem of the leftovers is handled in a sustainable approach.
1.1 Biogas
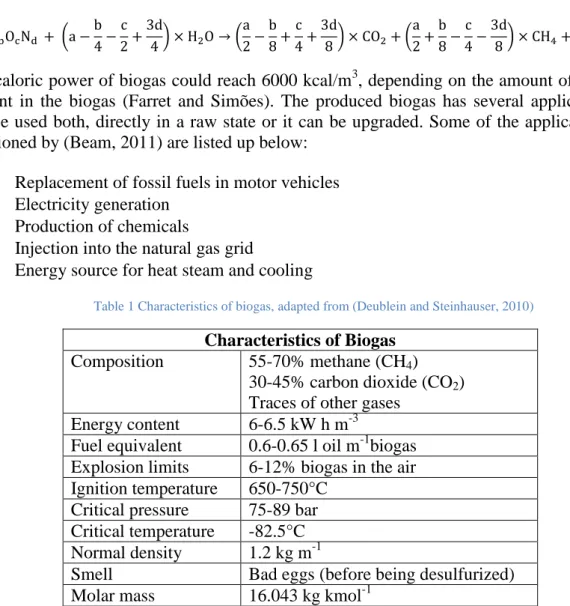
Biogas is composed mainly of methane and carbon dioxide. Depending on the substrate up to 70% of the total composition of biogas can be methane and up to 45% can be carbon dioxide, as it is shown in Table 1. However biogas contains also traces of other gases, such as: hydrogen sulphide, nitrogen, oxygen, and hydrogen (Beam, 2011).
The methane content in biogas depends mainly on the organic matter composition, but other factors such as the pretreatment
of the substrate can affect the final methane yield, that can be theoretically calculated by using the following empirical formula (Lübken et al., 2010).
(
) ( ) ( )
The caloric power of biogas could reach 6000 kcal/m3, depending on the amount of methane present in the biogas (Farret and Simões). The produced biogas has several applications; it can be used both, directly in a raw state or it can be upgraded. Some of the applications are mentioned by (Beam, 2011) are listed up below:
Replacement of fossil fuels in motor vehicles Electricity generation
Production of chemicals
Injection into the natural gas grid
Energy source for heat steam and cooling
Table 1 Characteristics of biogas, adapted from (Deublein and Steinhauser, 2010)
Characteristics of Biogas Composition 55-70% methane (CH4)
30-45% carbon dioxide (CO2) Traces of other gases
Energy content 6-6.5 kW h m-3
Fuel equivalent 0.6-0.65 l oil m-1biogas Explosion limits 6-12% biogas in the air Ignition temperature 650-750°C
Critical pressure 75-89 bar Critical temperature -82.5°C Normal density 1.2 kg m-1
1.2 Biogas production in the world
The biogas production is increasing around the world, but still the production is not competitive enough, compared with the fossil fuels. One of the main disadvantages of biogas is the requirement of a gas cleaning phase, before being used, because raw biogas contains contaminants, such a hydrogen sulphide an aggressive corrosive trace element, which generate damage in pipeline metal (Beam, 2011).
The reasons which motivate the implementation of biogas are the continuous and increasing demand of energy, the depletion of reservoirs of fossil fuels and its high prices, together with the social and political instability in some of the producing countries and the accumulation of CO2 generated by the fossil fuels, which has greatly influenced in the global warming problem.
Producing biofuels also offers the opportunity to develop of new potential agricultural industries which can exploit energy crops and residues to produce renewable energy, without all the problems associated with the use of fossil fuels.
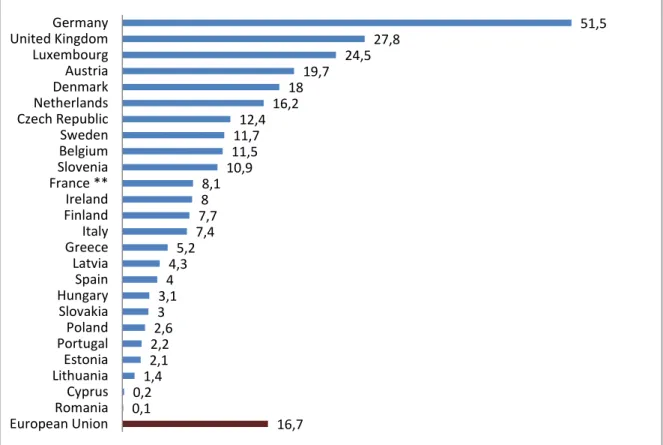
The biogas market is constantly growing, particularly in the European Union region, as it is shown in Figure 2, the average production of biogas per 1000 inhabitants is 16.7 metric tons in a year (EUROBSER’ER, 2010), and the biogas production has increased yearly more than 20% in recent years, being Germany by far the main biogas producer in the world. According to (Weiland, 2010) around 4000 agricultural biogas production plants were operating at the end of 2008 all over Germany.
Figure 2 Primary biogas energy production per inhabitant in the European Union presented in metric tons per 1000 inhabitants (adapted from (EUROBSER’ER, 2010))
51,5 27,8 24,5 19,7 18 16,2 12,4 11,7 11,5 10,9 8,1 8 7,7 7,4 5,2 4,3 4 3,1 3 2,6 2,2 2,1 1,4 0,2 0,1 16,7 Germany United Kingdom Luxembourg Austria Denmark Netherlands Czech Republic Sweden Belgium Slovenia France ** Ireland Finland Italy Greece Latvia Spain Hungary Slovakia Poland Portugal Estonia Lithuania Cyprus Romania European Union
2. Biogas Production Process
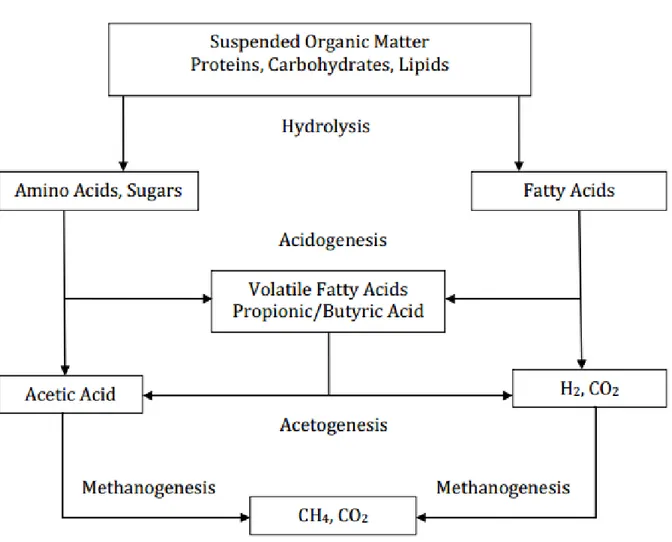
Biogas is produced through a natural biological process called anaerobic digestion, which can be divided in three different stages: hydrolysis, acidogenesis and acetogenesis and finally methanogenesis. However these three stages occur simultaneously, where different types of microorganisms collaborate to decompose the organic matter and produce methane.
The schematic process of the anaerobic digestion can be seen on Figure 3, where the organic matter, composed by the main biopolymers, Proteins, Carbohydrates and Lipids will be degraded into Amino Acids, Sugars, Fatty Acids, Acetic Acid, Volatile Fatty Acids (VFA), Butyric Acid, Hydrogen and finally Carbon Dioxide and Methane, which are the main components of biogas.
Figure 3 Anaerobic Digestion Process (Beam, 2011)
2.1 Hydrolysis
The anaerobic digestion process begins with the Hydrolysis stage, where large organic polymers, like Proteins, Carbohydrates and Lipids are broken down into small monomers,
Hydrolysis is a very important step in anaerobic digestion process because large organic polymers cannot be used as food source by the microorganisms, because they are not able to directly absorb the polymers due to its size.
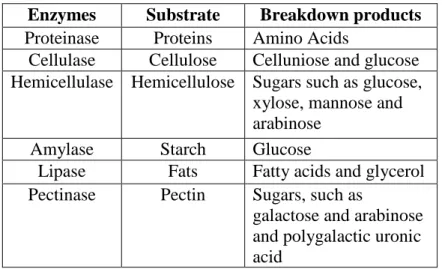
Hydrolysis is performed by a facultative anaerobic bacteria, which hydrolyse the substrate with the help of extracellular enzymes, such as Proteinases, Cellulases, Hemicellulases, Amylases, Lipases and Pectinases as it is shown in Table 2 (Schnürer and Jarvis, 2010). The rate of the decomposition process largely depends on the nature of the substrate, therefore in some cases hydrolysis can be the rate limiting step in the anaerobic digestion process.
Table 2 Enzymes involved in Hydrolysis adapted from (Schnürer and Jarvis, 2010)
Enzymes Substrate Breakdown products Proteinase Proteins Amino Acids
Cellulase Cellulose Celluniose and glucose Hemicellulase Hemicellulose Sugars such as glucose,
xylose, mannose and arabinose
Amylase Starch Glucose
Lipase Fats Fatty acids and glycerol Pectinase Pectin Sugars, such as
galactose and arabinose and polygalactic uronic acid
2.2 Acidogenesis and Acetogenesis
After the hydrolysis of the substrate, the primary fermenting bacteria, which are both obligate and facultative anaerobes carry out the Acidogenesis step (Bruni, 2010). During the Acidogenesis the Amino Acids, Sugars and Fatty Acids are converted into VFAs, among others propionic acid and butyric acid, as well as Carbon dioxide and Hydrogen.
Some of these fermentative products like carbon dioxide, hydrogen and acetate will be use directly by methanogens to produce methane, while other types of products, for instance volatile fatty acids and alcohols, will go through another intermediate steps where acetate, carbon dioxide and hydrogen are produced.
After the Acidogenesis, the longchained VFAs are converted to Acetic Acid and Hydrogen, during the Acetogenesis by the so called secondary fermenting bacteria, which are obligate hydrogen-producing bacteria (Bruni, 2010).
2.3 Methanogenesis
Finally the methanogens take the hydrogen, the acetic acid and the carbon dioxide, formed during the previous steps, and produce methane and carbon dioxide.
Methanogenesis is a complex regulated process performed by the Methanogens, which are obligate anaerobic archae microorganisms. There are two types of methanogens, the acetoclastic methanogens and the hydrogen utilizing methanogens. The first ones use acetate
as substrate and the second ones convert hydrogen and carbon dioxide to methane, respectively (Sterling Jr et al., 2001).
The hydrogen utilizing methanogens use the hydrogen, produced by the secondary fermenting microorganisms, during the acetogenesis. This process must be done as soon as the hydrogen is formed, because otherwise the high pressure of hydrogen would inhibit the growth of the secondary fermenting microorganisms.
On the other hand at the same time, hydrogen pressure must be between 6 and 10 bar, to allow the growth of the hydrogen utilizing methanogens. That is the reason why this two types of microorganisms are in close physical contact, having a syntrophic relationship keeping the partial pressure of hydrogen in an optimal range for both of them (Bruni, 2010).
3. Wheat straw as feedstock for biogas production
Wheat (Triticum spp.) is a cereal cultivated all around the world, the whole grain is employed in the elaboration of several food products, such as bread, which is one staple food for many cultures and is produced after grinding the wheat corn into flour.
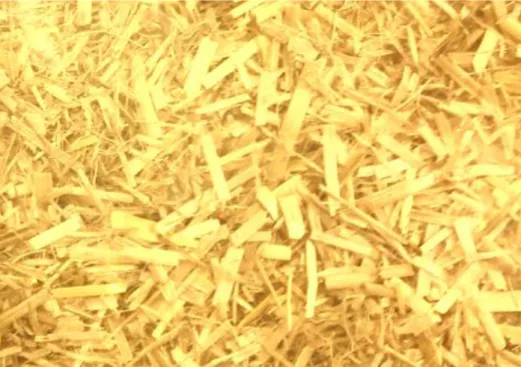
After harvesting the wheat or other cereal plants, the remaining of the plant is called straw, as it can be seen on Figure 4 it is a golden yellow to brown dry stalky fibres, that have a slightly woody structure in some parts. Typically a residue/crop ratio of 1/3 is obtained. It is estimated that around 850 Tg of wheat residues are produced yearly (Talebnia et al., 2010)
Figure 4 Obtained wheat straw, from a farmland located in Sweden in February 2012, before grinding.
Straw can be used as animal feed or also as bedding for cattle. Moreover straw is employed in several places as a construction material and it is used as material to build several types of handicrafts. It can also be simply just left on the fields or it can be collected and used as biomass to produce energy.
The straw as other agricultural by-products or residues have less commercial value and usually the handling of these streams represents a disposal problem for farmers, making wheat straw an abundant, inexpensive, and readily available source of renewable lignocellulosic biomass (Liu et al., 2005).
3.1 Composition of straw
Wheat straw is built up by lignocellulosic material, as all plants are. Lignocelluloses are composed of three main elements: cellulose, hemicellulose and lignin. The chemical properties of these three elements affect the lignocellulose tertiary architecture, constituting a physical and chemical barrier to biodegrade it and exploit the commercial potential of lignocellulose (Malherbe and Cloete, 2002).
The chemical composition of straw varies depending on different factors such as the specie, the nutrients of the soil or the climate conditions where the wheat was cultivated and harvested.
The ratio composition of the three main elements that constituted straw (cellulose, hemicellulose and lignin) oscillates normally in the range of 33-40, 20-25 and 15-20 %(w/w) , respectively (Talebnia et al., 2010).
Apart of the three primary polymers that composed the structure of straw, it also contains other structural polymers for example: waxes and proteins (Malherbe and Cloete, 2002). 3.1.1 Cellulose
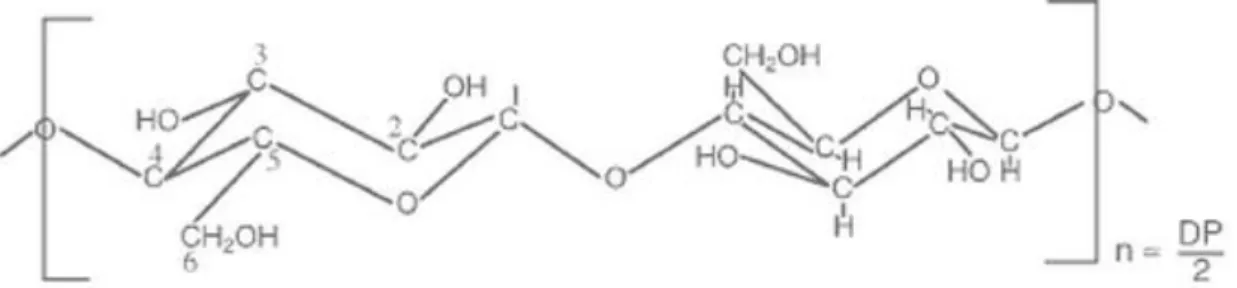
Cellulose is a crystalline polymer mostly found in a fibrous form. It is a very common compound that can be found in the cell wall of the green plants and it is the main component of lignocelluloses.
Figure 4. Schematic diagram of cellulose (Johnson, 2003)
The structure of cellulose is a regular unbranched linear sequence (Johnson, 2003) that is built by β-1,4-glycosidic bounded glucose units as it can be seen on Figure 5, where n is the number of elements conforming the polymer and DP is the degree of polymerization. The size of the chain n i.e. can vary usually between 100 and 14,000 (Bruni, 2010).
The function of cellulose is giving plants their woody structure, by reinforcing the amorphous lignin and hemicelluloses elements.
3.1.2 Hemicellulose
Hemicellulose, contrary to cellulose, has not a crystalline structure. It has a weak amorphous structure, composed mainly by pentoses, but other sugars can also be components of hemicellulose, such as xylose, mannose, galactose and arabinose.
The basic structure of hemicellulose is formed by 1,4-bounded xylose units, having a degree of polymerization between 70 and 200. Hemicellulose is fundamental in lignocellulosic materials, because it helps to build a network together with cellulose, lignin, proteins and other polysaccharides (Bruni, 2010).
The function of hemicellulose in the network is that as a basement working for cellulose homopolymers forming cross linked fibres. Moreover lignin will also help by strengthening the bindings between hemicellulose and cellulose.
3.1.3 Lignin and Extractives
Lignin is a three-dimensional phenolic polymer, which possess a complex chemical structure, conformed by syringyl, guaiacyl and p-hydroxyphenyl units. The arrangement of the conforming molecules depends on the plant.
The function of lignin is to provide the plant resistance and stability and at the same time not to be easily degraded in a biological or chemical way, reinforcing the structural support. Lignin is an almost impermeable compound and its presence is one of the reasons why lignocellulosic materials, such as straw cannot be easily fermented (Chandra et al., 2012). Plant biomass also contains soluble non-structural materials, that is referred as extractives, which includes sugars, nitrogenous compounds, chlorophyll and waxes (Chandra et al., 2012) 3.2 Pretreatment
Lignocellulosic materials like straw, forest residues and paper residuals can be potential raw materials for bio fuel production. However, the rate of utilisation of lignocelluloses for biogas and bioethanol production is drastically limited due to the cross linking structure of cellulose with hemicelluloses and lignin.
Also, the high crystallinity of these substrate resist the penetration of extracellular enzymes from bacteria performing the first step of conversion, hydrolysis. So, the only way to enhance for example the biogas potential of lignocellulosic materials is the application of suitable pretreatment process before going to anaerobic digestion.
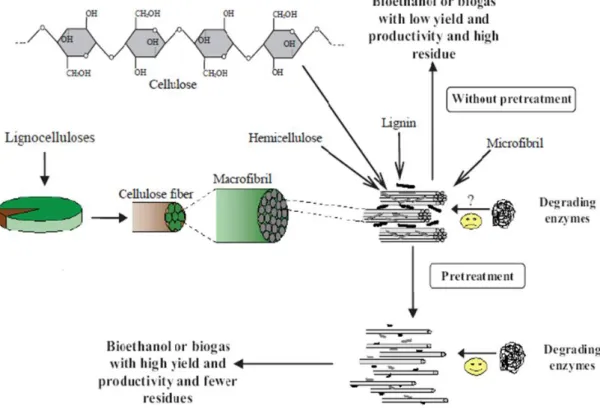
An ideal pre-treatment should decrease the lignin content and crystallinity of the material, and also it should increase accessible surface area and porosity (Mata-Alvarez et al., 2000). In the Figure 6 it can be seen the main aim of the Pretreatment: reduce crystallinity and increase porosity and accessible surface area, allowing the degrading enzymes to increase the methane production.
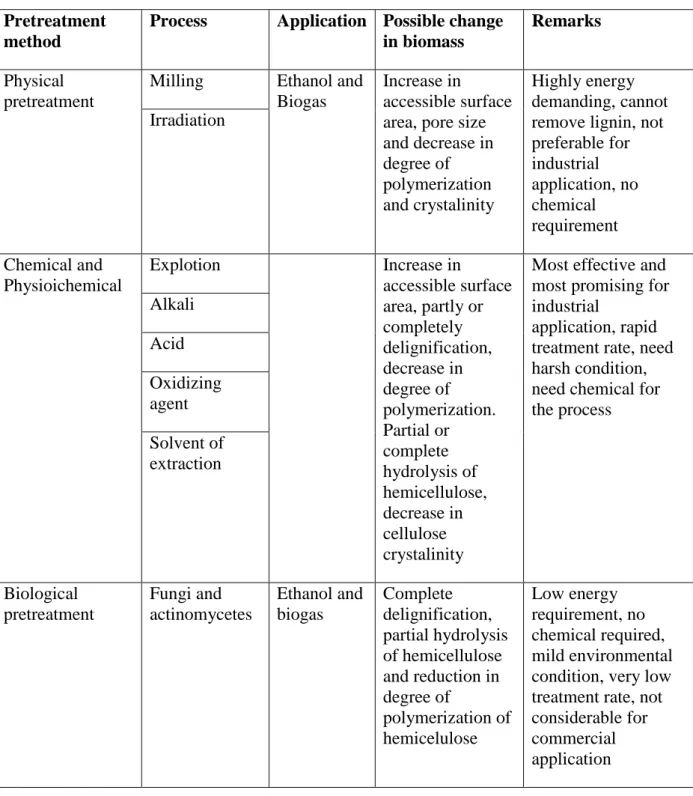
Different pretreatment technologies can be applied, which can be divided to physical, chemical, physiochemical and biological processes (Table 3). Depending on the type of substrate each pretreatment process has its own applicability and effect.
Table 3 Pretreatment process of lignocelluloses (Taherzadeh and Karimi, 2008)
Pretreatment method
Process Application Possible change in biomass
Remarks
Physical pretreatment
Milling Ethanol and Biogas
Increase in
accessible surface area, pore size and decrease in degree of polymerization and crystalinity Highly energy demanding, cannot remove lignin, not preferable for industrial application, no chemical requirement Irradiation Chemical and Physioichemical Explotion Increase in accessible surface area, partly or completely delignification, decrease in degree of polymerization. Partial or complete hydrolysis of hemicellulose, decrease in cellulose crystalinity
Most effective and most promising for industrial
application, rapid treatment rate, need harsh condition, need chemical for the process Alkali Acid Oxidizing agent Solvent of extraction Biological pretreatment Fungi and actinomycetes Ethanol and biogas Complete delignification, partial hydrolysis of hemicellulose and reduction in degree of polymerization of hemicelulose Low energy requirement, no chemical required, mild environmental condition, very low treatment rate, not considerable for commercial
3.2.1 Physical Treatment
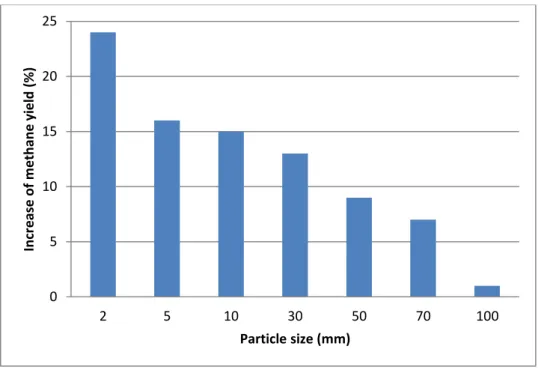
Physical pretreatment can increase the biodigestibility of lignocellulosic waste materials by increasing the accessible surface area and the pore size, furthermore, decreasing the crystallinity and the degree of polymerization.
It involves milling, irradiation, pyrolysis, extrusion etc. The energy required for the physical pretreatment depends on the final particle size as it can be seen on Figure 7. For most cases, the energy required is higher than the excess energy that can be produced as a result of the treatment. So, this pretreatment is not economically feasible for large scale industrial processes.
Figure 7 Methane Yield production, depending on the particle size taken from (Schnürer and Jarvis, 2010)
3.2.2 Chemical
Chemical pretreatment of straw for biogas production involves treatment with alkali, dilute and concentrated acids, urea, ammonia and lime etc.
As an alkaline pretreatment, sodium hydroxide has been used for many years. It can break the lignocellulosic matrix structure of straw and eventually reduce the lignin and hemicellulose content and increase the biogas production during anaerobic digestion.
This type of pretreatment is very efficient for straw. In alkaline pretreatment, the high concentration of alkaline solution will cause production of some potential inhibitors, such as furfural, hydroxymethyl furfural, thus a neutralization step is required after the pretreatment. It is possible to perform the alkaline pretreatment at ambient temperature but in this case it will take long treatment time to achieve same results (Zhong et al., 2011)
In case of acid pretreatment, both dilute and concentrated acid can be used for pretreatment of lignocellulosic materials. The most commonly used acid is dilute sulphuric acid, which can breakdown the compact structure of lignocellulosic material for getting free sugars.
The drawbacks of this process are that severe conditions are required; the production of some potential inhibitors, and also that this acid is very expensive.
0 5 10 15 20 25 2 5 10 30 50 70 100 In cr e ase o f m e th an e y ie ld (% ) Particle size (mm)
3.2.3 Physiochemical Treatment
It is a combination of physical and chemical treatment such as steam treatment with or without explosion, CO2 explosion, liquid hot water pretreatment and microwave chemical pretreatment.
In steam explosion lignocellulosic materials are subjected in a high pressure steam for a few seconds or minutes and then the pressure is suddenly released leading to breakdown the compact crystalline structure of lignocellulosic materials and some phenolic compounds coming from breakdown of lignin will be flushed away (Teghammar et al., 2010).
Microwave assisted alkali pretreatment for straw is another effective type of pretreatment process. This treatment can remove more quantity of lignin than the conventional alkali pretreatment process.
It can be used with higher microwave power with lower retention time or lower microwave power with higher retention time. Both of these methods have the same effect on lignin removal and weight loss of wheat straw (Zhu et al., 2006).
3.2.4 Biological Treatment
Biological pretreatment means the use of microorganism to treat the ligocellulosic material for enhancing enzymatic hydrolysis.
Pretreatment of wheat straw with white rot fungi Phanerochaete chrysosporium can remove the lignin content of straw drastically which will enhance the bacterial hydrolysis during anaerobic digestion (Müller and Trösch, 1986). Furthermore, in some case even hemicelluloses are broken down by the microorganisms.
In addition, some antimicrobial agents which can be potential inhibitors for the anaerobic microorganisms can also be removed. However, the cellulose remains intact because of its high crystallinity.
The two main advantages of biological pretreatment are no need of any chemicals and mild treatment conditions and low energy requirement. On the other hand, in most cases, the reaction rates in biological pretreatments are low, that’s why more time is needed for efficient treatments (Sun and Cheng, 2002).
4. Pretreatment with NMMO
The different pre-treatment processes discussed above are available for breaking down the complex structure of lignocellulosic materials, however they have their disadvantages as well. The main problem with most of the chemical pretreatment methods, like dilute acid and sodium hydroxide, is that they can result in the production of inhibitory by-products, for example: furfural and hydroxy methyl furfural and the reduction of sugar yield after the treatment (Kuo and Lee, 2009).
Moreover, often harsh conditions are required for performing these types of treatments and also they have adverse environmental effects. In contrast, most of the biological pretreatments are time consuming.
On the other hand, a novel pre-treatment process was developed for breaking down the rigid and compact structure of lignocelluloses by using a biodegradable and eco-friendly solvent, called N-methylmorpholine-N-oxide (NMMO), which is an organic solvent (Figure 8) capable to dissolve cellulose and efficiently decrease its cristallinity.
Figure 8 Structure of NMMO
NMMO is today commercially used as an industrial solvent in the fiber-making industry known as the Lyocell process. As it was mentioned earlier, lignin is responsible for the structural rigidity and integrity of lignocellulosic materials which is responsible for restricted enzymatic degradation.
This solvent has a polar N-O bond in his structure, which can attack the inter and intramolecular hydrogen bonds, and also van der Waals forces in the structure of cellulose, resulting in the formation of new bonds with the solvents.
The crystalline structure of the cellulose will be converted to an amorphous form, leading to that the biodegradability of lignocelluloses will be increased to a great extent (Teghammar et al., 2012a).
Moreover, this treatment will not affect the composition of cellulose and hemicelluloses, while reducing the crystallinity of cellulose by a large extent (Aslanzadeh, 2011). An additional advantage of using this treatment is that it is possible to recover around 98% of NMMO after the pre-treatment. (Kuo and Lee, 2009).
at least 80 °C, in order to use 85 wt% NMMO for the pretreatment of lignocellulosic materials.
Figure 9. Phase diagram NMMO water mixture (Biganska and Navard, 2003)
4.1 Different modes of NNMO treatment
The mixture of NMMO and water at any ratio is not a good solvent for the cellulose. As it is shown in Table 4 the water content of the mixture should be maximum 17 wt% for dissolving the cellulose.
If we use water more than this amount, the treatment can achieve some structural changes of lignocelluloses but this is not enough for our desired pretreatment (Cuissinat and Navard, 2006)
When the water content is less than 17 wt% in the NMMO and water mixture, the dissolution of lignocelluloses will occur by disintegration in spindle. Being this a rapid process, which is the reason why NMMO treatment in this mode can be a very efficient pretreatment method in converting lignocelluloses into biofuels.
Table 4. Different swelling and dissolution mechanism of lignocelluloses in NMMO and water mixture at different water content. (Cuissinat and Navard, 2006)
4.2 De-crystallization of lignocelluloses in NMMO
After dissolving the lignocelluloses in the solvent the cellulose and hemicelluloses have to be precipitated out from the mixture by using a liquid coagulating agent.
This coagulating agent has to be miscible with NMMO and non-solvent for cellulose. Polar liquids, like water or alcohols, are used for this purpose (Biganska and Navard, 2004).
The ratio for solvent and lignocelluloses should also be optimized. As it is shown in figure 10, if we use more than 6 wt% lignocellulose in the solvent, it will take a longer time to precipitate out (Biganska and Navard, 2004)
5. Material and Methods
5.1 Raw Materials
The lignocellulosic material of interest was wheat straw (Triticum spp.) and was obtained from a farmland located in Sweden in February 2012 (Figure 11). In order to perform the pretreatments and then the anaerobic digestion assays, the straw was milled to 2 mm size pieces with a sieve shaker (Octagon 200, United Kingdom).
Figure 11. Straw milled in 2mm size
5.2 NMMO Pretreatment
To perform the pretreatment a commercial grade NMMO (BASF, Ludwig-Shafen, Germany) was used, with an initial concentration of 50% w/w in aqueous solution, which was then concentrated to 85% in a rotary vacuum evaporator(Heidolph, Germany) equipped with a vacuum pump (Wertheim, Germany). In order to avoid degradation of NMMO during pretreatment, 0.625 g/kg proplylgallate was added (Bang et al., 1999).
The pretreatment was performed by mixing 6g of dry weight 2mm straw with 94g of 85% NMMO solution in a 500 ml bottle. The samples were heated using an oil bath at 90° C for 7hours, 15 hours and 30 hours
Another series of pretreatments were carried out in 3 hours, 7 hours and 15 hours, with samples which were previously soaked in water for 72 hours. This was in order to analyse if with soaking a better results could be achieved, considering that the soaked straw would offer a higher diffusion rate for the NMMO solution.
In order to avoid the formation of clusters and to enhance a proper mixing, the samples were stirred every 15 minutes for the first 7 hours, after that, the samples were stirred every 2 hours for the next 15 hours and in the case of the 30 hours treatment, during the rest of the time the sample was left overnight without stirring.
Boiling water was added immediately after the pretreatment, to stop the reaction, and then the pretreated straw was collected by filtration using textile bags. The treated sample was further
the collected water containing NMMO was kept and as it can be seen on Figure 12 the NMMO was removed gradually.
NMMO needs to be removed, before the anaerobic digestion; otherwise it might affect the methanogens activity during biogas production. The washing/filtration process was repeated at least 3 times to ensure that all of the NMMO was separated.
Figure 12 Collected NMMO after stepwise washing steps
The pretreated straw was properly labelled and stored in the fridge until it was used in anaerobic digestion assays. In addition some of the material was freeze dried to prepare samples for further structural and analytical analyses.
5.3 Biogas Production
After the NMMO pretreatment, the anaerobic digestion was carried out for triplicate samples at termophilic conditions (55°C) according to the method described by Hansen et al., (2004), using inoculum from the local large scale municipal solid waste digester, Sobacken in Borås, Sweden.
The pretreated straw was placed in small bio reactors (sealed serum glass bottles of 118 ml). Each bioreactor contained 30 ml inoculum and untreated or pretreated straw as substrate, as it can be seen in Figure 13.
The amount of substrate for each sample was determined according to their VS% value, keeping the VS ratio between the inoculum and substrate to 2:1, as it is shown in Table 4. A bioreactor containing untreated straw was run to determine the effect of the NMMO pretreatment performed at different conditions on the biogas production.
Figure 13 Sealed serum glass bottles of 118 ml used as Bioreactors
There was also a control bioreactor running in triplicate, which contained cellulose in order to test the quality of the inoculum and a blank, containing only inoculum, was also run in triplicate, in order to measure the methane produced by the inoculum.
Table 4 Bioreactor setup content
Sample Amount of Straw [g] Amount of Inoculum 7 Hours 1.20 30 ml 15 Hours 1.16 30 ml 30 Hours 1.19 30 ml 3 Hours (Soaked) 1.30 30 ml 7 Hours (Soaked) 1.34 30 ml 15 Hours (Soaked) 1.10 30 ml Untreated Straw 0.31 30 ml Cellulose 0.25 30 ml Innoculum 0.00 30 ml
Finally, all the bioreactors were filled up to a final reaction volume of 40 ml with water and flushed for 2 minutes, by injecting a gas mixture of 80%N2 and 20%CO2, in order to ensure anaerobic conditions in the headspace of the bioreactors.
After this experimental set up, the flasks were placed in the incubator at 55°C and in order to decrease the effect of temperature variation inside the incubator, the bioreactors were gently shaken daily and moved around in the incubator. The incubation time was 45 days, to ensure a complete degradation of the organic matter.
5.4 Analytical Methods
The percentage value of the Total solids (TS) and Volatile solids (VS) in the different samples were determined by first oven drying them to a constant weight at 105°C and then continue the ignition at 575°C in a furnace, respectively (Sluiter, 2008).
The methane production was monitored by taking samples regularly from the head space of the reactors according to the method employed previously by Teghammar et al., (2012a) and using Gas Chromatography, as it is described in details in chapter 5.4.1.
The content of extractives, cellulose, hemicellulose and lignin was determined following the National Renewable Energy Laboratory (NREL) standard procedures and are described in detail in chapter 5.4.2.
To analyse the pores in the structure a new technique called Simons Staining (SS) was used, SS is a highly effective procedure, employed to determine the size and quantity of pores from lignocellulosic substrates, such as wheat straw.
The performed technique was a modified method proposed by Chandra et al (2008), being a simplified version of the original method and it is described in detail in chapter 5.4.3.
5.4.1 Biogas Production/ methane measurements
The Biogas production was monitored by Gas Chromatography (GC), an analytical process used for separating the compounds of a sample based on their volatilities.
The methane and carbon dioxide production was measured twice a week during the first two weeks of the experimental period and then it was measured only once a week.
The gas samples were taken from the head space of the bioreactors using a pressure tight syringe as it shown in Figure 14, then the samples were directly injected into the gas chromatograph (Auto System Perkin Elmer, USA) equipped with a packed column (Perkin Elmer, 6’ x 1,8"OD, 80/100, Mesh, USA), a thermal conductivity detector (Perkin Elmer,USA) and with the inject temperature of 150°C. The carrier gas was nitrogen and was operated with a flow rate of 20 ml/min at 60 °C.
In order to avoid overpressure in the bioreactors, the biogas produced in excess of the head space was released systematically, by inserting a needle in the rubber stopper of the sealed serum glass bottles, keeping the overpressure no higher than two bars in the head space of the bioreactors and then a new sample was taken from the head space and the methane content was measured again (Teghammar et al., 2012a).
The produced amount of methaneand carbon dioxide was calculated using the ideal gas law and based on the volume of the headspace of the bioreactor and the volume of the sample that was taken by the syringe and injected on the GC.
The amount of produced methane by the bioreactor containing just the inoculums was then deducted from the methane production obtained in the sample containing flasks and the values were plot as a function of the incubation time, obtaining the accumulative methane production. All of the values for the methane production were calculated in normal conditions (at 273K and 1013 mbar and are given as normal cubic meter per kg of volatile solids (Nm3/kg VS of straw).
5.4.2 NREL Procedures
In order to determine the composition of straw, the NREL procedure to determine the Structural Carbohydrates and Lignin in Biomass (Sluiter, 2008) was carried out.
Prior to the NREL analysis, the extractives were removed and determined, to prevent interference with later analytical steps, due to the presence of remaining non-structural material (Sluiter, 2005).
The extractives were removed by performing water extraction for 24 hours using a Soxhlet apparatus. The water used as solvent was removed using a rotary evaporator and then the remaining extractives were dried in a vacuum oven at 35°C for 24 hours to determine the amount of extractives in the samples. The extractives were cooled down to room temperature in a desiccator, followed by a determination of the weight and the amount of extractives was calculated.
After the removing of the extractives the straw samples were hydrolysed, using 72% H2SO4 at 30°C for 1 hour in a water bath. Then the acid concentration was diluted to 4% by adding 84 ml deionized water.
The samples were then autoclaved and after cooling down, the analysis for acid insoluble lignin was performed, as follows: the autoclaved hydrolysed samples were filtered using vacuum filtration crucibles.
The crucibles containing the acid insoluble lignin were dried at 105°C for 4 hours and then the samples were weighted and finally placed at a muffle furnace at 575°C for 24 hours. The obtained aliquot was stored in a refrigerator and was later used to determine the acid
To determine the content of the acid-soluble lignin, a UV spectrophotometer (Libra biochrom, Nordic Biolabs) was used.
The sugars were quantified by High Performance Liquid Chromatography (HPLC) (Waters 2695, Millipore, Milford, USA) equipped with a refractive index (RI) detector (Waters 2414). Glucose and xylose were measured by an ion-exchange column (Aminex HPX-87P, Bio-Rad, USA) with pure water as eluent with a flow rate of 0.6 ml/min at 85°C.
.
5.4.3 Simons’ Stain
The two dies used to perform the Simons’ Stain technique were direct blue (DB, Pontamine Fast Sky Blue 6BX) and direct orange (DO, Pontamine Fast Orange 6RN), provided by Pylam Products Co., (Garden City, NY, USA).
The Molecular diameter of the direct blue dye is 1 nm and has a low affinity for cellulose, while Direct Orange has a Molecular diameter of 5-36 nm and presents a high affinity for cellulose (Meng et al., 2012).
First, the Fast Direct Blue and Direct Orange were prepared in order to have the desired concentration of 10 mg/ml for each of them.
The purchased DO dye from Pylam is a heterogeneous mixture of high and low molecular weight molecules. For that reason the mixture must be filtered by ultrafiltration to separate the high molecular weight (HMW) molecules which are the ones used in the assay. In order to separate the molecules an Amicon ultrafiltration apparatus with a 100,000 MWCO membrane was employed.
The samples selected to be analysed were: the untreated straw, and the unsoaked straw pretreated during 7, 15 and 30 hours. For each one of these four samples six testing tubes were labelled, each one containing an increasing dye concentration.
For each tube, 100 mg of dry weight of the selected samples were measured, according to the corresponding dry matter content, expressed as Total Solids percentage (TS%), as it is shown in Table 5.
Table 5 Amount of Straw for Simon’s Stain Sample TS% Amount of straw to have 100 mg dry weight 1. Untreated 89 112.4 mg 2. 7 Hours 26 384.6 mg 3. 15 Hours 25 400.0 mg 4. 30 Hours 23 434.8 mg
Table 6 Amount of water for each tube, depending on the moisture content
Sample Testing tube
1 2 3 4 5 6
Untreated 8.488 7.988 7.488 6.988 5.988 4.988 7 Hours 8.2154 7.7154 7.2154 6.7154 5.7154 4.7154 15 Hours 8.2 7.7 7.2 6.7 5.7 4.7 30 Hours 8.1652 7.6652 7.1652 6.6652 5.6652 4.6652
The final volume of all the tubes was fixed at 10 ml, by adjusting the quantity of water, depending of the moisture content of each sample (Table 6) together with PBS, HMW Direct Orange dye and Direct Blue dye, according to Table 7.
Table 7 Composition of testing tubes to perform modified Simons’ Stain structural analysis Testing tube 1 2 3 4 5 6 PBS [ml] 1.0 1.0 1.0 1.0 1.0 1.0 Water * * * * * * 10 mg/ml HMW Direct Orange dye [ml] 0.25 0.5 0.75 1.0 1.5 2.0
10 mg/ml Direct Blue dye [ml]
0.25 0.5 0.75 1.0 1.5 2.0
TOTAL [ml] 10 10 10 10 10 10
*According to Table 6
The tubes were then tightly caped and placed in a shaking water bath for 16 hours at 70°C, to enhance the mixing between the samples and the dyes.
After that the samples were cooled down at room temperature and then 1 ml of mixture from each tube was transferred to a respective micro-centrifuge tube and was centrifuged for 10 minutes at 10000 rpm. The obtained supernatant was then diluted in order to get an absorption value between 0.7 and 1.0 and the absorption of each tube was measured at 455 and 624 nm using a spectrophotometer (Libra biochrom, Nordic Biolabs, Sweden).
The extinction coefficients of the two dyes were calculated from the slopes of the respective standard curves of the absorbance, measured at 455 and 624 nm (Chandra et al., 2009). The extinction coefficients calculated were: εDO/455= 33.676, εDO/624=0.117, εDB/455=2.691, and εDB/624=13.900 Lg-1cm-1, for DO and DB dye, respectively.
The collected data was then analyzed in an Excel spreadsheet to determine the amount of dye absorbed by the fibers to get the exact amount of orange and blue dye that was adsorbed by the samples.
5.4.4 Crystallinity determination by FTIR
To the cellulosic crystallinity, Fourier transform infrared spectroscopy (FTIR) was performed on the unpretreated and pretreated straw.
The straw samples were milled to powder in order to ensure homogeneity of the samples, and then the spectra were measured using the FTIR spectrometer apparatus (Impact,410, Nicolet Instrumemt Corp.Madison, W1). The spectra were obtained with an average of 64 scans and a resolution of 4 cm-1, in the range from 600 to 4000 cm-1.
The crystallinity was determined by measuring the absorption bands at 1420 and 898 cm−1, these bands correspond to the respective crystalline cellulose I and cellulose II (Carrillo et al., 2004), then the absorbance ratio (A1422/A898) was calculated, which gives the crystallinity index (CI).
6. Results and Discussion
The complete process of pretreatment followed by anaerobic digestion to enhance the biogas production is schematized in Figure 15. The raw straw was milled into 2 mm size pieces to facilitate the digestion.
Figure 15 Biogas Production Process, using NMMO Pretreatment
Anaerobic digestion was performed for 45 days with straw pretreated with 85% NMMO at 90°C. Additionally a batch assay containing straw, previously soaked in water, and then treated with NMMO was also run in parallel to study the effect of soaking the lignocellulosic material on the diffusibility of treatment chemical in straw.
Table 8 TS% and VS% values Sample TS (%) VS (%) Untreated 89.75 78.45 7 Hours 23.79 21.39 15 Hours 23.76 21.65 30 Hours 23.70 21.60 3 Hours (Soaked) 21.86 19.19 7 Hours (Soaked) 19.73 18.61 15 Hours (Soaked) 24.22 22.72
After the pretreatment the NMMO was washed out. At this step samples were taken to perform the analytical analysis. Then the effect of the pretreatment was evaluated by measuring the methane production during a 45 day long anaerobic batch digestion assay. Additionally the changes in the composition, crystallinity, porosity and structure were also studied.
6.1 Biogas Production
The methane production was calculated and recorded (Table 9) in order to determine the accumulative methane production from the unsoaked and soaked samples that are shown on Figure 16.
The best methane production result obtained was 0.47 Nm3 Methane/kgVS from the unsoaked samples pretreated with NMMO for 7 hours, while and in the case of soaking samples, the best methane production of 0.42 Nm3 Methane/kgVS was achieved after 15h NMMO treatment.
Table 9 Methane production of the different samples measured during 45 days of batch anaerobic digestion
Sample
Days
Accumulated Methane production (Nm3/kgVS)
0 3 6 11 14 17 24 31 38 45 UNTREATED 0.00 0.06 0.16 0.25 0.25 0.24 0.27 0.30 0.32 0.32 7 HOURS 0.00 0.09 0.23 0.31 0.31 0.35 0.41 0.44 0.46 0.47 15 HOURS 0.00 0.11 0.23 0.34 0.32 0.35 0.38 0.40 0.43 0.43 30 HOURS 0.00 0.12 0.26 0.34 0.34 0.34 0.39 0.41 0.40 0.41 CELLULOSE 0.00 0.02 0.10 0.26 0.34 0.37 0.38 0.38 0.38 0.38 SOAKED 3 H. 0.00 0.08 0.18 0.29 0.30 0.29 0.35 0.37 0.39 0.38 SOAKED 7 H. 0.00 0.08 0.19 0.26 0.28 0.27 0.33 0.35 0.37 0.37 SOAKED 15 H. 0.00 0.09 0.21 0.28 0.29 0.31 0.35 0.39 0.42 0.42
The theoretical methane production value of straw is: 415 Nml CH4/g carbohydrates (Teghammar et al., 2012) or it can be expressed as 0.415Nm3 Methane/kg carbohydrates.
The literature reports an specific methane yield production values of untreated straw between 162 lN kg−1 VS and 275 lN kg−1 VS (Bauer et al., 2010, Møller et al., 2004) that can be expressed as: 0.162 Nm3 Methane/kgVS and 0.275 Nm3 Methane/kgVS. Which are compareable of our results of 0.32 Nm3/kgVS. The higher value obtained in this study can be explained by the fact that the straw was milled to 2 mm particle size before the treatment. Decreasing the partice size can itself increase the methane production providing larger surface area for the microorganisms to attach to the material, which can enhance the degradation process (Bauer et al., 2009)..
Table 10 Improvement in accumulated methane production after NMMO pretreatment
SAMPLE % Increase in Methane production after NMMO treatment 7 HOURS 47 15 HOURS 36 30 HOURS 29 CELLULOSE 21 SOAKED 3 H. 19 SOAKED 7 H. 18 SOAKED 15 H. 33
Table 10 summarizes the percentage of increase of the methane production after NMMO pretreatment compare to the methane production of untreated straw.
6.2 Material Recovery
The amount of straw recovered after the NMMO pretreatment and washing and filtering stages, was determine, by measuring the amount of dry straw before and after these steps, as it is shown in Table 11.
Table 11 Straw Mass Balance SAMPLE BEFORE PRETREATMENT AFTER PRETREATMENT RECOVERY % Total Weight Amount of Solids Total Weight Amount of Solids 7 Hours 19.5 17.36 60.05 15.85 91.33 15 Hours 19.54 17.39 60.78 15.41 88.61 30 Hours 19.5 17.36 60.69 14.25 82.10 3 Hours (soaked) 63.06 11.98 44.54 10.13 84.56 7 Hours (soaked) 63.06 11.98 52.13 10.27 85.73 15 Hours (soaked) 63.06 11.98 40.63 9.84 82.14
As it can be seen from Table 11 and on Figure 17 the recovery percentage is over 80% in all the samples, having a recovery average of 85.75%.
Figure 17.Production of Methane in m3/kg VS of straw
This data point out that the wheat straw can be pretreated with NMMO without suffering significant mass loses. These observations also indicate that NMMO can be collected during the washing step and later it can be recovered by evaporating the water and concentrating again the NMMO up to 85%.
0 2 4 6 8 10 12 14 16 18 20
7 Hours 15 Hours 30 Hours 3 Hours
(soaked) 7 Hours (soaked) 15 Hours (soaked) A m o u n t o f str aw [g ]
Material Recovery
IN OUTBy studying the porosity it is possible to determine if the surface area of the lignocellulosic material has undergone any change as a result of the NMMO pretreatment, allowing enzymes to have a widespread access to the fibres.
It has been indicated that enzyme accessibility is a major limiting factor affecting the enzymatic hydrolysis of lignocellulosic material (Ishizawa et al., 2007), therefore it is necessary to determine if the applied NMMO pretreatment affect the porosity of the sample. As it was mentioned before the Direct Orange dye has a high affinity for cellulose, and the Direct Blue has a very low affinity for cellulose, therefore it is possible to determine if the surface area for cellulose has been increased, when the amount of DO increases.
Figure 18. Simons Staining results
It can be seen on Figure 18 that the number of overall pores increases with increasing pretreatment time, which indicates that after performing a pretreatment with NMMO, the overall number of pores has increased.
Moreover, it is important to mention that the number of big pores with a molecular diameter between 5-36 nm (indicated by the absorption of DO) increases in a higher yield which is beneficial for enhancing the enzymatic hydrolysis of the samples, because cellulase has a similar dimension as DO(Teghammar at al,. 2012b).
Untreated 7 hours 15 hours 30 hours
Amax orange 66,4 73,0 91,1 98,6 Amax blue 20,2 24,1 32,4 34,4 0,0 20,0 40,0 60,0 80,0 100,0 120,0 140,0
A
ma
x
In order to determine the crystallinity of the samples, Fourier transform infrared spectroscopy (FTIR) was used.
The spectra obtained from the FTIR apparatus (Figure 19), shows different bands that correspond to different components of the molecule, in order to determine the Crystallinity Index (CI), two bands values were considered, the bands at 1420 and 898 cm−1, that correspond to the crystalline cellulose I and cellulose II respectively.
.
Figure 19a FTIR spectra in the range from 600 to 4000 cm-1. Corresponding to NMMO pretreated straw for 7 Hours
the Table 12. CI is an indicator of the level of crystallinity of the analyzed samples and the results of obtained Crystallinity Indexes (CI) are shown on Figure 20.
As it can be seen on the Figure 20, that the crystallinity was reduced in the 7 and 15 hours samples, showing that after the NMMO pretreatment has affected the crystallinity of the straw.
Table 12 absorption bands at 1420 and 898 cm−1
The CI for the 7 hours sample shows the lowest values, and it also was the sample that has a highest amount of methane production (Figure 20 and Figure 16). It can therefore be concluded that there is a correlation between the increase of biogas production and the reduction of the cristallinity, as it was previously reported also by Teghammar et al (2012b).
UNTREATED
No A1420 A898 C.I A1420 A898 C.I A1420 A898 C.I A1420 A898 C.I
1 0.019 0.033 0.58 0.063 0.153 0.41 0.066 0.146 0.45 0.065 0.083 0.78 2 0.059 0.116 0.51 0.036 0.085 0.42 0.072 0.166 0.43 0.11 0.144 0.76 3 0.07 0.146 0.48 0.056 0.132 0.42 0.071 0.151 0.47 0.122 0.154 0.79 4 0.07 0.147 0.48 0.06 0.133 0.45 0.072 0.155 0.46 0.133 0.165 0.81 5 0.082 0.152 0.54 0.057 0.125 0.46 0.071 0.1557 0.46 0.138 0.174 0.79 AVERAGE 0.518 0.432 0.454 0.786 Crystalinity of Straw
Figure 20 Crystallinity Indexes (CI) obtained by FTIR
In the case of the 30 Hours sample, the CI shows an increase, which can be related to the presence of waxes that interfered with the analysis.
Also because the CI is a ratio between the amorphous and crystalline cellulose, it can be inferred that somehow the value of one of this parameters was affected in a considerable way, that the overall ratio show an increase. However this increase in CI can also be correlated to the biogas production which was the lowest one (Figure 16)
6.4 Straw Composition
Carbohydrates, lignin and ash content were analyzed following the NREL procedure. However, only the unsoaked samples were analyzed, because these samples showed a better performance in the biogas production.
0 0,1 0,2 0,3 0,4 0,5 0,6 0,7 0,8
UNTREATED 7 HOURS 15 HOURS 30 HOURS
0,518
0,432 0,454
0,786
Table 13 Straw Composition Samples Untreated (% of TS) 7 Hours pretreatment (% of TS) 15 Hours pretreatment (% of TS) 30 Hours pretreatment (% of TS) Cellulose 34.57 34.44 33.51 37.18 Hemicellullose 13.11 14.02 13.28 13.9 Lignin 21.41 21.96 21.63 19.79 Ash 1.18 2.78 1.07 2.00 Extractives 10.18 9.45 9.60 7.45
As it can be seen on Table 13, the composition analysis shows that the straw composition was not seriously affected by the NMMO pretreatment. It is also evident that there is the presence of some other elements, such as minerals. The fraction corresponding to minerals in plants like straw can vary, depending on the soil conditions. One of the major mineral component of straw is silica (Antongiovanni and Sargentini, 1991).
7. Conclusions and Future Work
It was confirmed that performing a chemical pretreatment with NMMO, results in an enhancement of the methane production, with an increase of a range varying from 18% to 47%, depending on the pretreatment time.
It was also shown that the pretreatment temperature can be reduced up to 90°C and still represents an improvement in the biogas production, which makes the process even more feasible to perform at an industrial scale operational. If 90°C is applied the district heating system can be utilized in the pretreatment process.
The soaking step, prior to the pretreatment, did not increase the methane production in a significant way, which indicates that the presence of water led to a dilution of NMMO, and pretreatment at this lower concentration was not effective enough.
It was also verified that the use of new techniques, like the modified Simons Staining is extremely helpful for structural analyses of the pretreated material. This method allows us to determine in a precise and simple way if there was a change in the structural composition of the lignocellulosic material, which can then be collated to the performance of the following anaerobic digestion.
The NMMO used in the process was recovered by washing the straw with water and the solution from these washing steps were collected in order to study in a near future the possibility to reuse the NMMO. In a future it is necessary to develop a method that allow us to recover the used NMMO from the washing steps. Moreover,
It is necessary to design evaluate the economic feasibility of an industrial scale treatment process which can lead to the establishment of a more robust and sustainable process, easy to implement in a commercial biogas production plant.
The activity of the recovered NMMO should be studied under various conditions like different temperature and different mixing ratio with water, to find the optimal operation parameters with recycled NMMO.
References
ANTONGIOVANNI, M. & SARGENTINI, A. C. 1991. Variability in chemical composition of straws. CIHEAM - Options Mediterraneennes, n.O 16.
ASLANZADEH, S., TAHERZADEH, M. J., AND SÁRVÁRI HORVÁTH, I. 2011. Pretreatment of straw fraction of manure for improved biogas production.
BioResources, 6(4), 5282-5306.
BANG, Y. H., LEE, S., PARK, J. B. & CHO, H. H. 1999. Effect of coagulation conditions on fine structure of regenerated cellulosic films made from
cellulose/N-methylmorpholine-N-oxide/H2O systems. Journal of Applied Polymer Science, 73, 2681-2690.
BAUER, A., BÖSCH, P., FRIEDL, A. & AMON, T. 2009. Analysis of methane potentials of steam-exploded wheat straw and estimation of energy yields of combined ethanol and methane production. Journal of Biotechnology, 142, 50-55.
BAUER, A., LEONHARTSBERGER, C., BÖSCH, P., AMON, B., FRIEDL, A. & AMON, T. 2010. Analysis of methane yields from energy crops and agricultural by-products and estimation of energy potential from sustainable crop rotation systems in EU-27.
Clean Technologies and Environmental Policy, 12, 153-161.
BEAM, R. G. 2011. Enhanced biogas production through the optimization of the anaerobic
digestion of sewage sludge. M.S. 1495589, The University of Alabama.
BIGANSKA, O. & NAVARD, P. 2003. Phase diagram of a cellulose solvent: N-methylmorpholine–N-oxide–water mixtures. Polymer, 44, 1035-1039.
BIGANSKA, O. & NAVARD, P. 2004. Dissolution, crystallisation and regeneration of cellulose in N-methylmorpholine N-oxyde. MACRO-2004 International Conference
on Polymers for Advanced Technologies Thiruvananthapuram India.
BRUNI, E. 2010. Improved anaerobic digestion of energy crops and agricultural residues. PhD Thesis, Technical University of Denmark.
CARRILLO, F., COLOM, X., SUÑOL, J. J. & SAURINA, J. 2004. Structural FTIR analysis and thermal characterisation of lyocell and viscose-type fibres. European Polymer
Journal, 40, 2229-2234.
CUISSINAT, C. & NAVARD, P. 2006. Swelling and Dissolution of Cellulose Part 1: Free Floating Cotton and Wood Fibres in N-Methylmorpholine-N-oxide–Water Mixtures.
Macromolecular Symposia, 244, 1-18.
CHANDRA, R., EWANICK, S., CHUNG, P., AU-YEUNG, K., RIO, L., MABEE, W. & SADDLER, J. 2009. Comparison of methods to assess the enzyme accessibility and hydrolysis of pretreated lignocellulosic substrates. Biotechnology Letters, 31, 1217-1222.
CHANDRA, R., TAKEUCHI, H. & HASEGAWA, T. 2012. Methane production from lignocellulosic agricultural crop wastes: A review in context to second generation of biofuel production. Renewable and Sustainable Energy Reviews, 16, 1462-1476. DEUBLEIN, D. & STEINHAUSER, A. 2010. Biogas. Biogas from Waste and Renewable
Resources. Wiley-VCH Verlag GmbH & Co. KGaA.
EUROBSER’ER 2010. biogas barometer. SYSTÈMES SOLAIRES le journal des énergies
renouvelables
FARRET, F. A. & SIMÕES, M. G. Integration of Alternative Sources of Energy. John Wiley & Sons.
HANSEN, T. L., SCHMIDT, J. E., ANGELIDAKI, I., MARCA, E., JANSEN, J. L. C., MOSBÆK, H. & CHRISTENSEN, T. H. 2004. Method for determination of methane potentials of solid organic waste. Waste Management, 24, 393-400.
ISHIZAWA, C. I., DAVIS, M. F., SCHELL, D. F. & JOHNSON, D. K. 2007. Porosity and Its Effect on the Digestibility of Dilute Sulfuric Acid Pretreated Corn Stover. Journal
of Agricultural and Food Chemistry, 55, 2575-2581.
JOHNSON, R. M. 2003. Biopolymers, Shrewsbury, iSmithers Rapra Publishing.
KUO, C.-H. & LEE, C.-K. 2009. Enhanced enzymatic hydrolysis of sugarcane bagasse by N-methylmorpholine-N-oxide pretreatment. Bioresource Technology, 100, 866-871. LIU, R., YU, H. & HUANG, Y. 2005. Structure and morphology of cellulose in wheat straw.
Cellulose, 12, 25-34.
LÜBKEN, M., GEHRING, T. & WICHERN, M. 2010. Microbiological fermentation of lignocellulosic biomass: current state and prospects of mathematical modeling.
Applied Microbiology and Biotechnology, 85, 1643-1652.
MALHERBE, S. & CLOETE, T. E. 2002. Lignocellulose biodegradation: Fundamentals and applications. Reviews in Environmental Science and Biotechnology, 1, 105-114. MATA-ALVAREZ, J., MACÉ, S. & LLABRÉS, P. 2000. Anaerobic digestion of organic
solid wastes. An overview of research achievements and perspectives. Bioresource
Technology, 74, 3-16.
MENG, X., FOSTON, M., DEMARTINI, J., WYMAN, C. E. & RAGAUSKAS, A. A. J. 2012. Assessing Cellulose Accessibility of Lignocellulosic Biomass before and after Pretreatment. In: BIOENERGY SCIENCE CENTER (ed.). Atlanta: U.S.
DEPARTMENT OF ENERGY.
MØLLER, H. B., SOMMER, S. G. & AHRING, B. K. 2004. Methane productivity of manure, straw and solid fractions of manure. Biomass and Bioenergy, 26, 485-495. MÜLLER, H. W. & TRÖSCH, W. 1986. Screening of white-rot fungi for biological
pretreatment of wheat straw for biogas production. Applied Microbiology and
Biotechnology, 24, 180-185.
SCHNÜRER, A. & JARVIS, Å. 2010. Microbiological Handbook for Biogas Plants Swedish Waste Management U2009:03 Swedish Gas Centre Report 207. Malmö: Avfall Sverige Development.
SLUITER, A., RUIZ, R., SCARLATA, C., SLUITER, J., TEMPLETON, D. 2005.
Determination of Extractives in Biomass. National Renewable Energy Laboratory. SLUITER, A., RUIZ, R., SCARLATA, C., SLUITER, J., TEMPLETON, D. 2008.
Determination of Structural Carbohydrates and Lignin in Biomass (Version 07-08-2011). National Renewable Energy Laboratory.
STERLING JR, M. C., LACEY, R. E., ENGLER, C. R. & RICKE, S. C. 2001. Effects of ammonia nitrogen on H2 and CH4 production during anaerobic digestion of dairy cattle manure. Bioresource Technology, 77, 9-18.
SUN, Y. & CHENG, J. 2002. Hydrolysis of lignocellulosic materials for ethanol production: a review. Bioresource Technology, 83, 1-11.
TAHERZADEH, M. J. & KARIMI, K. 2008. Pretreatment of lignocellulosic wastes to improve ethanol and biogas production: a review. International journal of molecular
sciences, 9, 1621-1651.
TALEBNIA, F., KARAKASHEV, D. & ANGELIDAKI, I. 2010. Production of bioethanol from wheat straw: An overview on pretreatment, hydrolysis and fermentation.
Bioresource Technology, 101, 4744-4753.
TEGHAMMAR, A., KARIMI, K., SÁRVÁRI HORVÁTH, I. & TAHERZADEH, M. J. 2012. Enhanced biogas production from rice straw, triticale straw and softwood spruce by NMMO pretreatment. Biomass and Bioenergy, 36, 116-120.
TEGHAMMAR, A., YNGVESSON, J., LUNDIN, M., TAHERZADEH, M. J. &
HORVÁTH, I. S. 2010. Pretreatment of paper tube residuals for improved biogas production. Bioresource Technology, 101, 1206-1212.
WEILAND, P. 2010. Biogas production: current state and perspectives. Applied Microbiology
and Biotechnology, 85, 849-860.
WILKIE, A. C. 2011. Digesters for Biogas Production [Online]. Gainesville, FL: Bioenergy Summer School. Available: http://biogas.ifas.ufl.edu/digesters.asp.
ZHONG, W., ZHANG, Z., LUO, Y., SUN, S., QIAO, W. & XIAO, M. 2011. Effect of biological pretreatments in enhancing corn straw biogas production. Bioresource
Technology, 102, 11177-11182.
ZHU, S., WU, Y., YU, Z., CHEN, Q., WU, G., YU, F., WANG, C. & JIN, S. 2006. Microwave-assisted Alkali Pre-treatment of Wheat Straw and its Enzymatic Hydrolysis. Biosystems Engineering, 94, 437-442.