1
Strain localization and crack formation
effects on stress‐strain response of
ductile iron
Keivan A. Kasvayee1,a, Ehsan Ghassemali1, Kent Salomonsson1, S. Sujakhu2, S. Castagne2, Anders E.
W. Jarfors1
1School of Engineering, Jönköping University, Box 1026, 551 11 Jönköping, Sweden 2School of Mechanical and Aerospace Engineering, Nanyang Technological University, Singapore,
639798
aCorresponding author email: Keivan.Amiri-Kasvayee@ju.se
Abstract
The strain localization and crack formation in ferritic-pearlitic ductile iron under tension was investigated by in-situ tensile tests. In-situ tensile tests under optical microscope were performed and the onset of the early ferrite-graphite decohesions and micro-cracks inside the matrix were studied. The results revealed that early ferrite-graphite decohesion and micro-cracks inside the ferrite were formed at the stress range of 280-330 MPa, where a kink occurred in the stress-strain response, suggesting the dissipation of energy in both plastic deformation and crack initiation. Some micro-cracks initiated and propagated inside the ferrite but were arrested within the ferrite zone before propagating in the pearlite. Digital Image Correlation (DIC) was used to measure local strains in the deformed micrographs obtained from the in-situ tensile test. Higher strain localization in the microstructure was measured for the areas in which the early ferrite-graphite decohesions occurred or the micro-cracks initiated.
Keywords: In-situ tensile test; Digital image correlation; Micro-crack, Graphite-matrix decohesion, Cracking
1 Introduction
The material microstructure governs the material properties and the component performance. Inhomogeneous microstructure can give rise to local variations in the microstructural properties, e.g. the elastic-plastic behavior [1], volume fraction and phase arrangement [2, 3]. This can result in local stress concentration causing crack initiation. Similarly, microstructure defects such as inclusions and pores can cause local stress concentration resulting in crack initiation during loading through particle cracking or particle-matrix decohesion. In-situ tensile test can be used to characterize the crack initiation processes associated to the multi-phase materials [4, 5]. Combining in-situ tensile testing with digital image correlation (DIC) [6, 7] allows quantitative studies of strain distribution in the microstructure [8] and in the vicinity of cracks [9-11].
2 Ductile iron is a multiphase material with ferrite, pearlite and graphite as constituents [12]. The properties between the constituents are very different resulting in a heterogeneous deformation at the micro-scale, in particular around graphite particles [13-15]. The arrangement of the phases will result in a significant scatter in the local response of the material to the loading, especially during deformation, crack initiation and propagation.
Graphite particles (both nodules and degenerated nodules) in ductile iron cause stress and strain concentration on loading [16]. If the local strain exceeds a critical level, a micro-crack may form [11]. The differences in elastic and plastic properties between graphite and matrix can raise the stress in the interface of the graphite particles and eventually can cause interfacial decohesion and/or crack initiation [17]. Stokes et al. [18] considered the graphite-matrix decohesion as the critical micromechanisms for initiation and growth of micro-cracks. Decohesion was mostly reported when a perfectly round nodule was surrounded by a ferrite phase [5, 19]. In addition, the irregular surface and sharp corners of graphite can promote the interfacial crack initiation [20].
Several studies have been focused on simulating the strain distribution and crack formation for multiphase materials at the microstructural level [21-23]. Different modeling techniques have been used to model crack initiation and propagation. The predominant method used over the past decade is the extended Finite Element Method (XFEM) due to its advantage of crack path independence [24, 25]. The most common way to validate the simulation predication is the capability to reproduce the macroscopic experimental stress-strain [26, 27]. However, multiscale modelling requires more deformation details at the microstructural scale. One potential route to obtain this information is through DIC, enabling a quantitative comparison of the strain distribution at the microstructural scale with validation of events such as decohesion and micro-cracking.
The aim of this study is to investigate the effect of matrix-graphite decohesion and micro-crack initiation on the localized strain and stress-strain response of the ferritic-pearlitic ductile iron. In-situ tensile tests under optical microscope were performed to record the deformation micrographs up to fracture of the samples. The stress and strain at the onset of the early plastic deformation, ferrite-graphite decohesion and micro-cracks inside the matrix were investigated in relation to the changes in the slope of the tensile curve. Applying DIC to the deformed micrographs, localized strains at the onset of the micro-cracks were measured. This study is an extension of a previous work in which the strain distribution was quantified in the deformed microstructure excluding crack formation [28]. The scope of this work is to study the microstructural deformation including crack formation.
2 Experimental
2.1 Material
Ductile iron grade GJS-500-7 was sand cast as plates in a variety of the thicknesses. In the current study, the 30 mm thick plate was used as it showed a suitable variation in microstructure to study crack formation and decohesion. Table 1 represents the chemical composition of the material. The material had a eutectic composition. The carbon equivalent was calculated based on Eq.(1).
3
% 0.25 % 0.33 % 0.41 % (1)
Where %C, %Si, %P, and %S are the carbon, silicon, phosphorous and sulfur content (Wt%), respectively.
Table 1. Chemical composition of the cast material.
Element C Si Mg Cu Mn P S Ceq Fe
Weight percent (Wt.%) 3.510 2.360 0.037 0.294 0.408 0.009 0.004 4.11 Balanced
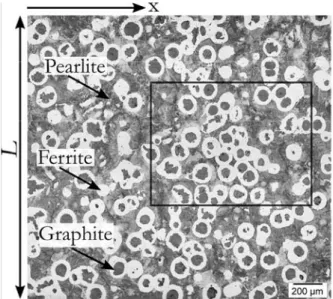
The microstructure consisted of nodular and irregular-shaped graphite particles surrounded by a ferritic-pearlitic matrix, see Figure 1. The amount of the constituents was 29±1% ferrite, 63±1% pearlite and 7±1% graphite. The nodularity (by area) was 71±3%, based on ASTM E 2567 [29].
Figure 1. Microstructure of the cast material obtained from the surface of the in-situ tensile sample 5; graphite particles (dark grey), ferrite (white) and pearlite (lamellar light grey). Etched in 5% Nital. L denotes the width
of the in-situ tensile sample (2 mm). The rectangle shows the area relating to the microscope field of view during the in-situ tensile test. Tension was applied in the X direction.
2.2 In-situ tensile test
In-situ tensile test was performed at room temperature using a miniature tensile stage (TSL Solution KK., maximum load cell capacity (1200 N) mounted on an inverted optical microscope (Olympus GX81). Five samples identified as sample 1 to 5 were machined from the cast plate and were tested. Figure 2 shows a sample schematic with dimensions in mm. The tests were performed with a crosshead speed of 3.3 µm/s. To allow for microscopy, the surface of the samples was grinded and polished. The thickness of the samples was machined to 1±0.1 mm to enable tensile testing to be undertaken in the range of the maximum load capacity. The 1 mm thick samples showed similar tensile properties
4 compared to a 0.7 mm thick sample. In addition, these samples fulfilled the mechanical properties according to standard (see Table 2), hence, no significant size effect was observed for the 1 mm thick samples.
Figure 2. Schematic of the sample adopted for the miniature tensile stage. The dimensions are in mm with a tolerance of ±0.1 mm.
The direct data output from the miniature tensile stage was overall load and crosshead displacement, which were used to measure the overall stress and strain of the samples. The values were recorded every second during in-situ tensile test. To compensate the tensile stage stiffness, a correctional equation was developed to reduce errors of displacement data and obtain reliable results. The equation was calculated by tensile testing a stiff sample, in which an extensometer was mounted on the tensile sample to measure the displacement during the tensile test. Then, the differences between the displacement data obtained using the machine and the extensometer were compared at various force amplitudes to determine the correction equation. Table 2 presents the average of tensile properties measured by the miniature tensile stage for the 5 samples.
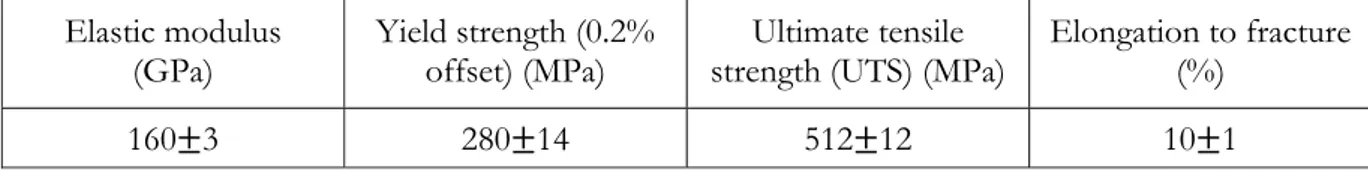
Table 2. Tensile properties of the cast material obtained from the in-situ tensile test. Elastic modulus
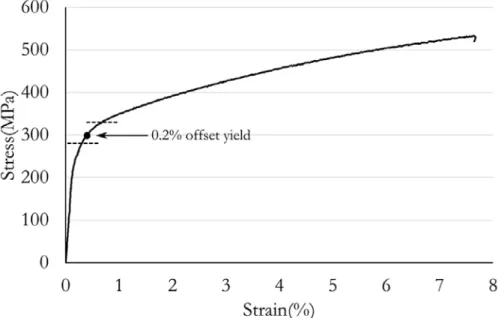
(GPa) Yield strength (0.2% offset) (MPa) strength (UTS) (MPa)Ultimate tensile Elongation to fracture (%) 160 3 280 14 512 12 10 1
The optical micrographs were recorded during deformation by a microscope camera (Olympus UC30), using one autofocusing function after each record, resulting in a picture every 6 seconds. Autofocusing compensated the out of plane deformation of the samples, due to the Poisson effect. Images were recorded in gray scale with the size of 2080 1544 pixels, giving a pixel size and imaging area of 0.54 µm/pixel and 0.96 mm2, respectively.
After fracture of the in-situ tensile samples, scanning electron microscope (SEM), model JSM-700IF, in a secondary electron mode was used to examine the micro-cracks that were developed on the surface of the samples.
In this work, a micro-crack was defined as a microstructurally short crack, which was developed at the interface of the graphite and the ferrite phases and was propagated for a few micrometers inside ferrite. A relatively large plastic zone ahead of the crack tip, compared to the length of the crack, often characterizes a micro-crack. These micro-cracks do not necessarily coalesce to form a larger crack.
5
2.3 Digital image correlation
DIC was performed using the software MatchID 2D, Version 2014.1.2 [30], on the deformed micrographs, which were recorded during the in-situ tensile test. A developed pit etching procedure [31] was utilized to generate a suitable random speckle pattern on the surface of the samples. The DIC settings were set based on the principles in previous studies [28, 31]. The correlation was performed by continuously updating the reference image between deformed micrographs and summing up the strain values at each step to obtain true strain and reduce the errors which originate from the out of plane deformation that occurred in the microstructure.
DIC was used to measure the local strain at the onset of ferrite-graphite decohesion and micro-cracks inside the matrix. The local strain was measured from an average of several strain points within an area of 27µm 27µm (50 50 pixels) in the region of the micro-crack. The area was equal to 10 10 step size, which contained 100 strain data points.
3 Results and discussion
3.1 Deformation and crack initiation
3.1.1 Strain distribution before cracking
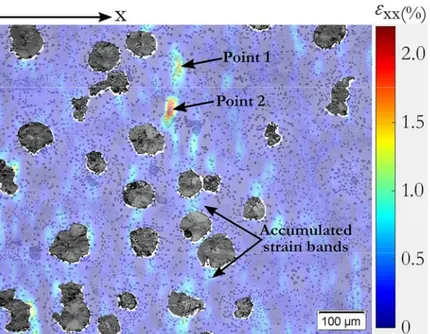
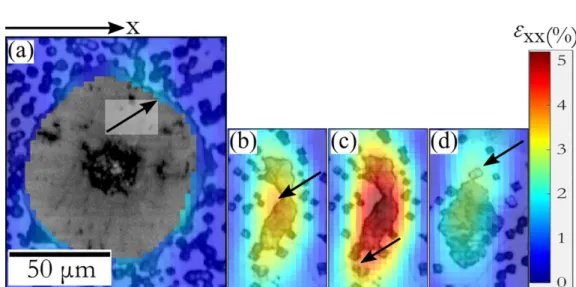
The results of the in-situ tensile tests showed several random cracks inside graphite particles but no cracking in the matrix at stress levels below 280 MPa for all the samples. However, the strain distribution at this stress level was heterogeneous in the microstructure. Figure 3 shows the DIC strain map (εxx) in the microstructure of the sample 5 (area inside the rectangle in Figure 1) at the overall
stress and strain level of 280 MPa and 0.4%, respectively. It should be noted that the graphite particles were excluded from the DIC strain measurements due to the lack of proper contrast of the speckles (pits) within the graphite particles. Therefore, the DIC strain maps were only measured in the matrix and in graphite particles smaller than the subset size used in DIC software. No cracking in the matrix was observed at this stress level. High amount of strain concentration was observed in vicinity of the irregular shaped graphite (e.g. see point 1 and 2 in Figure 3). The strain accumulated bands appeared at approximately 45° to the loading direction, and were located between the graphite particles (see Figure 3). The strain bands locations in the DIC results did not change by increasing the overall stress demonstrating that the bands were not due to the aliasing error.
6
31
Figure 3. DIC strain map (εxx) at the overall stress level of 280 MPa. Different colors indicate different values of
εxx which can be interpreted from the color bar. Point 1 and 2 show two irregular shape graphite.
3.1.2 Overall stress at the onset of decohesion and micro-crack
The early decohesions occurred only at the interface of ferrite-graphite. Table 3 shows the stress level at which the first ferrite-graphite decohesion occurred together with the stress level at which the first micro-crack formed in the field of view during the in-situ tensile tests. The onset of ferrite-graphite decohesion and micro-cracks were approximately at the stress range of 280-330 MPa. By increasing the stress level, more decohesions and micro-cracks occurred in the microstructure for all the samples. However, no trend could be found to show if the ferrite-graphite decohesion initiates earlier or the micro-cracks. Although, this could be due to the limited field of view of the microscope during the in-situ tensile test, which enabled observation of only a small part of the gauge.
Note that final fracture did not occur in the field of view of the microscope for any of the samples. This did not contradict the aim of this paper, which was to investigate the response of the material at the onset of micro-cracks around the graphite particles.
Table 3. The stress level at the onset of the first ferrite-graphite decohesion and the first micro-crack in the ferrite in the in-situ tensile samples.
Sample Ferrite-graphite decohesion (MPa) Micro-crack in ferrite (MPa)
1 280 285
2 306 300
3 304 297
4 290 290
7 3.1.3 Ferrite-graphite decohesion
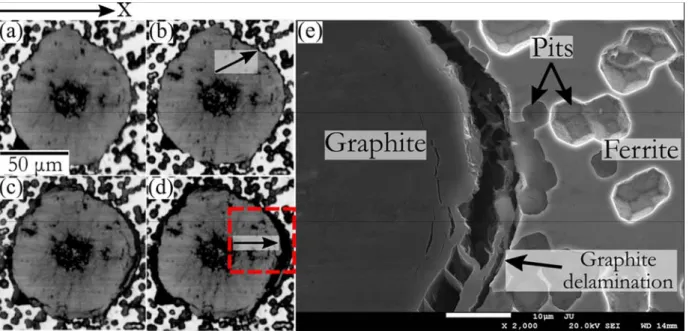
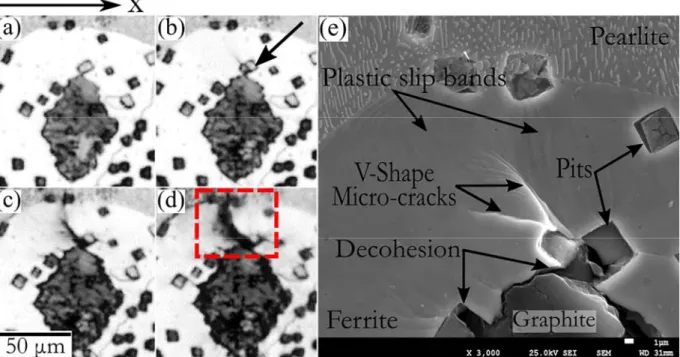
Figure 4 shows a sequence of micrographs from a typical nodular graphite (sample 3) surrounded by ferrite in four different overall stress levels (load was applied in the x-direction). The onset of ferrite-graphite decohesion for this ferrite-graphite was found to be at the overall stress level of 304 MPa (Figure 4(b)). The location of this decohesion is shown with an arrow in Figure 4(b) which was occurred at approximately 45° to the loading direction. The decohesion initiated at the maximum shear stress direction, along the directions of the accumulated strain bands similar to those observed in sample 5 (Figure 3). The amount of ferrite-graphite decohesion gap was increased around the nodule by increasing the load. At the overall stress of 516 MPa (before fracture of the sample), the maximum amount of decohesion gap for this graphite was measured to be approximately 11 µm, as indicated by the arrow in Figure 4(d). The maximum decohesion gap was parallel to the loading direction which was not the same as the initiation location. This could be due to the Poisson effect which reduced the decohesion gap in the directions which were not parallel to the loading direction, and reoriented decohesion to the loading direction. Figure 4(e) shows the SEM micrograph at this decohesion location. The graphite nodule was not fully separated from the ferrite and was delaminated with a part stuck to the ferrite.
Figure 4. The decohesion sequence of a nodular graphite particle embedded in ferrite at an overall stress level of: (a) 0 MPa (before deformation), (b) 304 MPa (onset of decohesion), the arrow shows the location of decohesion initiation (c) 474 MPa, (d) 516 MPa (before the fracture of the tensile sample), the arrow shows the
location of the maximum decohesion gap, (e) SEM micrograph of the decohesion taken from the dashed rectangle area shown in (d) after fracture of the tensile sample.
Figure 5 shows a sequence of micrographs from a typical irregular-shape graphite surrounded by ferrite in four different overall stress levels. This graphite belonged to the sample 5, also shown as point 1 in
8 Figure 3. Decohesion was initiated at the stress level of 315 MPa for this graphite (Figure 5(b)). The location of decohesion is shown by the arrow in Figure 5(b). By increasing stress to 347 MPa, several plastic slip bands were initiated in the ferrite phase around the sharp corners of this graphite (indicated by two arrows in Figure 5(c)). By increasing the load, the size of the decohesion gap and amount of plastic slip bands increased. The amount of maximum decohesion gap was measured as 12 µm at the overall stress of 493 MPa. This is indicated by the black arrow in Figure 5(d). Figure 5(e) shows a SEM micrograph taken from the area which is indicated by a dashed rectangle in Figure 5(d). The plastic slip bands were formed in the ferrite around the sharp corner of the graphite but did not continue into the pearlite region, as the yield stress of pearlite is higher than that of ferrite.
Cracking in the ferrite phase might have occurred around this graphite particle in the plastic slip bands. However, it was not evident in the optical micrographs, since the plastic slip bands produced localized out of plane deformation and appeared as dark areas in the matrix. Moreover, it was not possible to clearly identify micro-cracks in the SEM since the SEM imaging was done after the fracture of the sample while the load was removed.
Figure 5. Decohesion and plastic slip band formation around an irregular-shape graphite embedded in ferrite phase at overall stress levels of: (a) 0 MPa (before deformation), (b) 315 MPa (at the onset of decohesion), the arrow shows the location of decohesion, (c) 450 MPa, the arrows show the location of the slip bands, (d) 492 MPa (before the fracture of the sample), the arrow shows the location of the maximum decohesion, (e) SEM micrograph of the decohesion and slip bands taken from the dashed rectangle area shown in (d), after the
fracture of the tensile sample.
3.1.4 Micro-crack development in the ferritic matrix
Figure 6 shows a series of micrographs for an irregular-shape graphite from the sample 5. This graphite is shown as Point 2 in Figure 3 with the highest amount of strain measured by DIC at the top corner of this graphite. Therefore, the initiation of the early micro-crack could be expected at the top corner
9 of this graphite (note that the strain map shown in Figure 3 is before formation of any micro-crack). As expected, a micro-crack was formed at this area, indicated by an arrow in Figure 6(b). The overall stress at the onset of micro-crack was measured to be 327 MPa. This micro-crack was the earliest, which could be detected in the field of view for this in-situ tensile test sample.
Figure 6. Formation of two micro-cracks and plastic slip bands around an irregular-shape graphite embedded in ferrite at overall stress levels of: (a) 0 MPa (before deformation), (b) 327 MPa (micro-crack initiation), the arrow shows the location of the micro-crack (c) 450 MPa, (d) 492 MPa (before the fracture of the sample), (e) SEM micrograph of the two micro-cracks and slip bands, taken from the dashed rectangle area shown in (d)
after the fracture of the tensile sample.
Plastic deformation in the form of slip bands in the ferritic matrix occurred because of strain concentration (see Point 2 in Figure 3). The combination of these slip bands and micro-cracks is shown inside a dashed rectangle in Figure 6(d). For a clear view, Figure 6(e) shows an SEM micrograph taken from the dashed rectangle area shown in Figure 6(d), indicating graphite decohesion with significant plastic deformation and two micro-cracks in the ferrite. Similar to the Figure 5(e), the plastic slip bands formed in the ferrite phase at the corner of the graphite, but did not continue into the pearlite. The micro-crack initiated at the corner of the graphite and branched into two micro-cracks (V-shape) during the propagation. The micro-crack initiated approximately at 45˚ to the loading direction, in the direction of the plastic slip bands. Crack initiation was thus possibly caused by the shear slip bands parallel to the plane of the maximum shear stress. The propagation of the micro-cracks was stopped inside the ferrite region before reaching the ferrite-pearlite interface (Figure 6(e)). A similar phenomenon was previously reported during cyclic loading [32]. The reason for that might be the work hardening effect that was continuously developed in front of the micro-crack, which was acted as a barrier for further propagation and forced branching and changes in the propagation direction.
10 Moreover, the stress relaxation that occurred due to the initiation of the other micro-cracks in the microstructure throughout the entire gauge length of the sample may have influenced the micro-crack propagation and caused the micro-crack to arrest before reaching the hard pearlite structure.
3.1.5 Localized strain measurment
Figure 7 shows the DIC results around the above mentioned graphite at the onset of decohesion,
formation of plastic slip bands and micro-crack initiation.
Figure 7(a) shows the DIC strain results at the onset of decohesion for the nodular graphite shown in
Figure 4(b). At this stress level (304 MPa), the overall strain was measured by the miniature tensile stage to be 0.5%. The local strain at the location of decohesion (shown by the arrow in Figure 7(a))
was measured by DIC to be 0.6 0.2%, which was 15% higher than the overall strain.
Figure 7(b) and (c) show the DIC strain results at the onset of decohesion and plastic slip bands,
respectivly, for the irregular-shape graphite, which was shown in Figure 5. The overall strain at the onset of decohesion (315 MPa) and plastic slip band (347 MPa) were measured to be 0.6% and 1%, respectively. The local strain at the location of decohesion was measured to be 2.9 0.6%, indicating strain localization for 4.8 times higher than the overall strain. The local strain at the location of the early plastic slip band was measured to be 3.1±0.8%, which was 3.1 times higher than the overall strain. Figure 7(d) shows the DIC strain results at the onset of micro-crack for the irregular-shape graphite
shown in Figure 6(b). The overall strain at the onset of the micro-crack (327 MPa) was 0.7%. The local strain at the onset of this micro-crack was 1.9 0.4%. This indicates 2.7 times higher local strain at the onset of the micro-crack compared to the overall strain.
Figure 7. The DIC strain around the graphite particles at: (a) the onset of the decohesion of the nodular graphite embedded in ferrite, the arrow shows the location of the decohesion, (b) the onset of the decohesion
of the irregular graphite embedded in ferrite, the arrow shows the location of the decohesion, (c) the onset of the plastic slip band formation at the sharp corner of the irregular graphite embedded in ferrite, the arrow
11 shows the location of the slip band, (d) the onset of the micro-crack for the irregular graphite embedded in ferrite, the arrow shows the location of the micro-crack. The different colors indicate the different values of εxx
which can be interpreted from the color bar.
3.1.6 Effect of cracking on the stress-strain response
Figure 8 shows stress-strain curve measured for the sample 5 as a typical in-situ tensile test. According to the in-situ tensile tests results, the early ferrite-graphite decohesion and micro-cracks in ferrite were initiated at the stress range of 280-330 MPa. This stress range is indicated by the two horizontal dashed lines on the overall stress-strain response of the material in Figure 8. A kink occurred in the curve exactly at this stress range, indicating a transition to lower stress increment for further deformation. This change in the slope has usually been related to the plastic deformation and work hardening in the material. However, the initiation of decohesion and cracking inside the matrix has influenced the stress-strain response of the material. At this stress range, the dissipation of energy occurred in both plastic deformation and crack development. When a micro-crack initiated, the stress increment for further deformation decreased due to the higher stress concentration at the crack tip which facilitated the crack propagation and thus the tensile deformation. Since all of the early micro-cracks initiated around the graphite particles, it can be interpreted that the graphite particles have a determinative influence on the cracking and, thus, on the shape of the stress-strain curve of ductile iron materials.
Figure 8. True tensile stress-strain response measured during the in-situ tensile test of sample 5. The area between the dashed lines indicates the stress range of 280-330 MPa in which a kink occurred in the slope of the
12
4 Conclusions
During the tensile deformation, heterogonous strain distribution containing accumulated strain bands was measured by DIC at overall stress levels below 280MPa. Decohesion of graphite from ferritic matrix and initiation of micro-cracks inside the ferrite occurred at the overall stress range of 280-330 MPa. At this stress range, a kink occurred in the stress-strain response of the material indicating, a transition to lower stress increment for further deformation. This slope change could be related to the dissipation of energy in plastic deformation and cracking in ductile iron.
Slip bands in the ferrite around the irregular-shape graphite particles were found, and in conjunction to the slip-bands, micro-cracks were formed. These micro-cracks initially propagated but arrested before reaching the pearlite. The reason for this was not clear but could be due to either ferrite work hardening or stress relaxation due to the initiation of the other micro-cracks in the microstructure. The micro-cracks propagated near the 45˚ angle to the loading direction, which suggested propagation in the direction of maximum shear stress. The DIC results showed strain localization higher than the overall strain at the onset of ferrite-graphite decohesion and micro-crack initiation. This knowledge can be used for validation of the numerical simulations that predict microstructure-mechanical properties relationships of ductile iron.
5 Acknowledgments
The authors wish to acknowledge the Swedish Knowledge Foundation for financial support under the CompCAST project (20100280) and SKF Mekan AB and Nya Arvika Gjuteri AB for providing the cast material. This work was also supported by the Singapore Ministry of Education (MOE) Academic Research Funding (AcRF) Tier 1 Grant RG26/12.
13
6 Reference
[1] C.C. Tasan, J.P.M. Hoefnagels, M. Diehl, D. Yan, F. Roters, D. Raabe, Strain localization and damage in dual phase steels investigated by coupled in-situ deformation experiments and crystal plasticity simulations, International Journal of Plasticity 63(0) (2014) 198-210.
[2] A. El Bartali, V. Aubin, S. Degallaix, Fatigue damage analysis in a duplex stainless steel by digital image correlation technique, Fatigue & Fracture of Engineering Materials & Structures 31(2) (2008) 137-151.
[3] C.C. Tasan, M. Diehl, D. Yan, C. Zambaldi, P. Shanthraj, F. Roters, D. Raabe, Integrated experimental–simulation analysis of stress and strain partitioning in multiphase alloys, Acta Materialia 81 (2014) 386-400.
[4] K.C. Kim, S.W. Nam, Effects of Mn-dispersoids on the fatigue mechanism in an Al–Zn–Mg alloy, Materials Science and Engineering: A 244(2) (1998) 257-262.
[5] F. Iacoviello, O. Di Bartolomeo, V. Di Cocco, V. Piacente, Damaging micromechanisms in ferritic– pearlitic ductile cast irons, Materials Science and Engineering: A 478(1–2) (2008) 181-186.
[6] Z. Sun, J.S. Lyons, S.R. McNeill, Measuring microscopic deformations with digital image correlation, Optics and Lasers in Engineering 27(4) (1997) 409-428.
[7] K. Jonnalagadda, I. Chasiotis, S. Yagnamurthy, J. Lambros, J. Pulskamp, R. Polcawich, M. Dubey, Experimental investigation of strain rate dependence of nanocrystalline Pt films, Experimental mechanics 50(1) (2010) 25-35.
[8] T. Sjögren, P.E. Persson, P. Vomacka, Analysing the deformation behaviour of compacted graphite cast irons using digital image correlation techniques, Key Engineering Materials 457 (2011) 470-475. [9] J.D. Carroll, W. Abuzaid, J. Lambros, H. Sehitoglu, High resolution digital image correlation measurements of strain accumulation in fatigue crack growth, Int J Fatigue 57 (2013) 140-150.
[10] J. Tong, B. Lin, Y.-W. Lu, K. Madi, Y. Tai, J. Yates, V. Doquet, Near-tip strain evolution under cyclic loading: In situ experimental observation and numerical modelling, Int J Fatigue (2014). [11] K.A. Kasvayee, E. Ghassemali, A.E. Jarfors, Micro‐Crack Initiation in High‐Silicon Cast Iron during Tension Loading, TMS2015 Supplemental Proceedings 947-953.
[12] C. Labrecque, M. Gagné, Review ductile iron: fifty years of continuous development, Canadian Metallurgical Quarterly 37(5) (1998) 343-378.
[13] A. Ghahremaninezhad, K. Ravi-Chandar, Deformation and failure in nodular cast iron, Acta Materialia 60(5) (2012) 2359-2368.
[14] G. Nicoletto, T. Marin, G. Anzelotti, R. Roncella, Application of high magnification digital image correlation technique to micromechanical strain analysis, Strain 47(s1) (2011) e66-e73.
[15] X. Dai, F. Yang, L. Wang, D. Zhang, Q. Pu, X. He, Load capacity evaluated from fracture initiation and onset of rapid propagation for cast iron by digital image correlation, Optics and Lasers in Engineering (2013).
[16] M.L.M. Lundberg, M. Calmunger, R.L. Peng, In-situ SEM/EBSD Study of Deformation and Fracture Behaviour of Flake Cast Iron, ICF13, 2013.
[17] C. Guillemer-Neel, X. Feaugas, M. Clavel, Mechanical behavior and damage kinetics in nodular cast iron: Part I. Damage mechanisms, Metallurgical and Materials Transactions A 31(12) (2000) 3063-3074.
[18] B. Stokes, N. Gao, P. Reed, Effects of graphite nodules on crack growth behaviour of austempered ductile iron, Materials Science and Engineering: A 445 (2007) 374-385.
[19] V. Di Cocco, F. Iacoviello, M. Cavallini, Damaging micromechanisms characterization of a ferritic ductile cast iron, Engineering Fracture Mechanics 77(11) (2010) 2016-2023.
14 [20] G. Hütter, L. Zybell, M. Kuna, Micromechanisms of fracture in nodular cast iron: From experimental findings towards modeling strategies – A review, Engineering Fracture Mechanics 144 (2015) 118-141.
[21] G. Nicoletto, L. Collini, R. Konečná, P. Bujnová, Strain heterogeneity and damage localization in nodular cast iron microstructures, Materials Science Forum, Trans Tech Publ, 2005, pp. 255-258. [22] W. Gaudig, R. Mellert, U. Weber, S. Schmauder, Self-consistent one-particle 3D unit cell model for simulation of the effect of graphite aspect ratio on Young’s modulus of cast-iron, Computational materials science 28(3) (2003) 654-662.
[23] S. Pundale, R. Rogers, G. Nadkarni, Finite element modeling of elastic modulus in ductile irons: effect of graphite morphology, AFS Transactions 106(7) (1998).
[24] H. Hosseini-Toudeshky, M. Jamalian, Simulation of micromechanical damage to obtain mechanical properties of bimodal Al using XFEM, Mechanics of Materials 89 (2015) 229-240.
[25] J. Dolbow, T. Belytschko, A finite element method for crack growth without remeshing, Int. J. Numer. Meth. Eng 46(1) (1999) 131-150.
[26] W. Brocks, S. Hao, D. Steglich, Micromechanical modelling of the damage and toughness behaviour of nodular cast iron materials, Le Journal de Physique IV 6(C6) (1996) C6-43-C6-52. [27] G. Bernauer, W. Brocks, Micro‐mechanical modelling of ductile damage and tearing–results of a European numerical round robin, Fatigue & Fracture of Engineering Materials & Structures 25(4) (2002) 363-384.
[28] K.A. Kasvayee, K. Salomonsson, E. Ghassemali, A.E.W. Jarfors, Microstructural strain distribution in ductile iron; comparison between finite element simulation and digital image correlation measurements, Materials Science and Engineering: A 655 (2016) 27-35.
[29] ASTM Standard E2567-13a, 2013,"Standard Test Method for Determining Nodularity And Nodule Count In Ductile Iron", ASTM Internationals, West Conshohocken, PA, 2013, DOI:10.1520/E2567–13A, www.astm.org.
[30] P. Lava, S. Cooreman, S. Coppieters, M. De Strycker, D. Debruyne, Assessment of measuring errors in DIC using deformation fields generated by plastic FEA, Optics and Lasers in Engineering 47(7) (2009) 747-753.
[31] K.A. Kasvayee, L. Elmquist, A.E.W. Jarfors, E. Ghassemali, Development of a pattern making method for strain measurement on microstructural level in ferritic cast iron, PFAM XXIII, India, 2014. [32] T. Palin‐Luc, S. Lasserre, Y. Berard, Experimental investigation on the significance of the conventional endurance limit of a spheroidal graphite cast iron, Fatigue & Fracture of Engineering Materials & Structures 21(2) (1998) 191-200.