LINA ALDÉN AND MATS HAMMARSTEDT
2014:9
Integration of immigrants on
the Swedish labour market
– recent trends and explanations
Integration of immigrants on the Swedish labour
market
– recent trends and explanations
by
Lina Aldén
♣Mats Hammarstedt
♠Abstract
This paper uses new data to illustrate the position of the foreign-born on the Swedish labour market. Foreign-born Africans and Asians have a lower employment and a higher unemployment rate than other groups. They are overrepresented in fixed-time employment and underrepresented in managerial positions. Employment is particularly low among family and refugee immigrants. Educated people from these regions are more likely than others to have jobs requiring lower competencies than their educational level. Lack of human capital acquired in Sweden and lack of access to networks as well as prevalence of discrimination are put forward as explanations for this.
♣ Linnaeus University Centre for Labour Market and Discrimination Studies at Linnaeus University,
Växjö.
♠ Linnaeus University Centre for Labour Market and Discrimination Studies at Linnaeus University,
1. Introduction
In 2014 the number of foreign-born individuals in Sweden amounted to about 1.5 million, or more than 15 percent of the national population. In Sweden, the foreign-born constitute a somewhat higher proportion of the total population than in all OECD countries.1 In Sweden, as in other OECD countries, the position of the foreign-born on the labour market has gradually worsened in recent decades. At least in Sweden, unemployment is high and employment low among people who were born abroad.2
This paper uses new data to paint a picture of the position of the foreign-born on the Swedish labour market and discuss, on the basis of existing research, factors which may explain that position. We use data from three sources obtained from Statistics Sweden. The Labour Force Surveys (LFS) are carried out by Statistics Sweden on an ongoing basis to describe the current conditions and the development on the labour market in Sweden. The Occupational Register contains information about occupation and educational attainment for the population living in Sweden. Finally, the data base STATIV is a longitudinal data base for integration studies and include information about all residents in Sweden. This data base includes information about reasons for immigration for all foreign-born residents of in Sweden. We use the concepts of foreign-born and native-born. The foreign-born are people born outside of Sweden; native-born people were born in Sweden. We also study refugee immigrants -- people who have obtained residence permits and are eligible for protection or for equivalent reasons -- as well as family reunion immigrants, who have received a residence permit as relatives of foreign-born residents of Sweden.
This is how the rest of the article is structured. In Section 2, immigration into Sweden is presented from a historical perspective. It also includes a profile of today's foreign-born population in Sweden. Section 3 describes the 21st-century labour market situation for Sweden's foreign-born. The final discussion, including possible explanations of the results is found in Section 4.
2. Immigration and the foreign-born in Sweden
Since the 1940s immigration into Sweden has exceeded emigration. Between the 1940s and, more than three million people immigrated into Sweden, and 1.8 million emigrated. Over the decades, the scale of the immigration has changed, as have the reasons and the origins of the immigrants. In the late 1940s, most immigrants were refugees from Eastern Europe. From the 1950s to the mid-1970s the largest group consisted of labour immigrants, even though some refugee immigration from countries in Eastern Europe continued in the 1950s and 1960s. The greater part of the labour immigrants in this period came from the Nordic countries (especially Finland), West Germany, Austria, Italy, Greece and Yugoslavia. The labour immigration was a result of the demand surplus caused by the economic and industrial expansion in Sweden from the late 1940s to the mid-1970s. At this time, foreign labour was recruited by individual companies and through recruitment campaigns organized by the National Labour Market Board (AMS) in cooperation with the recruiting companies. Labour immigration was also facilitated by institutional changes. The establishment of a joint Nordic labour market in 1954 opened up the Swedish labour market for immigrants
1 See OECD (2013a).
2 One of the latest overarching studies of foreign-born in the labour market was conducted by Eriksson
from the other Nordic countries. The liberalization of general immigration policy also made immigrants eligible for residence in Sweden if they had employment, so immigration was in practice nearly free for foreign citizens.
The second half of the 1960s brought the introduction of more restrictive regulations for labour immigration into Sweden. Under the new law, immigrants had to obtain labour permits before their arrival in Sweden. However, the Swedish labour market was still open to Nordic immigrants. As a consequence of the restriction and economic recessions, immigration from the 1970s onwards assumed the character of refugee immigration. In the 1970s, a great many refugee immigrants came from Latin America and Asia. The 1980s brought refugees from the Middle East and Africa. More European refugees arrived in the 1990s, fleeing the civil war in what had been Yugoslavia. In the late 1990s and in the first decade of the 21st century, people from the Middle East and Africa again formed the major immigrant groups.
Since the mid-1990s the opportunities for labour immigration into Sweden have again increased. In connection with Sweden’s membership of the EES in 1994, citizens from other EES countries were given the right to work in Sweden. After the EU extensions in 2004, 2007 and 2013, foreign-born people from the new member countries were entitled to labour immigration. In addition, in 2008 citizens from countries outside the EU/EES area obtained the right to be granted labour and residence permits in Sweden if they had found employment.
During both the labour and the refugee immigration epochs, family reunion immigration has taken place. The rules for family reunion immigration have changed over time. In some periods, family members have been granted residence permits as long as their maintenance and housing have been arranged, while in other periods such immigration has been possible even without the maintenance requirement. The right to immigrate as a family member has always comprised husband and wife with under-age children. Even in other respects the group has altered somewhat, so that sometimes aged parents and other relatives have been allowed to immigrate as family members.
The changing character of immigration with regard to reason and country of origin has also led to changes in the composition of Sweden's foreign-born population. These changes are presented Table 1. In 1970 Nordic immigrants comprised approximately 60 percent of the foreign-born population in Sweden, and they still constituted the majority in 1980. Since the 1980s, the percentage of foreign-born from non-European countries has, however, steadily increased. In 1980 the non-European foreign-born population amounted to less than 12 percent of the total number of foreign-born in Sweden. In 1990 this proportion had increased to nearly 28 percent. In 2000 those born in countries outside Europe represented less than 40 percent of the foreign-born.3
3 It should be noted that population statistics of foreign-born people suffer from some deficiencies. For a
Table 1. Proportion of foreign-born in Sweden distributed by region of origin, 1950-2012. Region of birth 1950 1960 1970 1980 1990 2000 2012 Nordic countries 50.1 58.1 59.7 54.4 40.3 27.9 17.4 Other European countries 43.2 37.0 34.9 33.8 32.1 32.9 34.2 Non-European countries 6.7 4.9 5.4 11.8 27.6 39.2 48.4 Total 100 100 100 100 100 100 100 Source: Statistics Sweden, Statistical Yearbook and Population Statistics, various years.
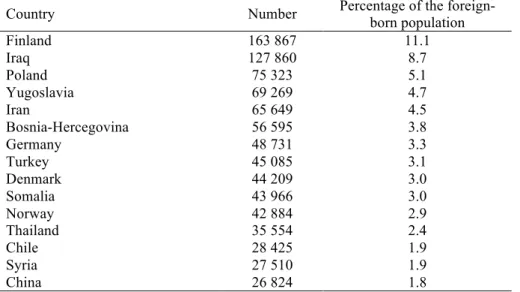
Hence, in the 21st century the foreign-born population from countries outside Europe has grown. Table 2 shows the fifteen most frequent countries of birth among the foreign-born in Sweden in 2012. Finland is the most frequent country of birth among all foreign-born in Sweden. More than 11 percent of the foreign-born in Sweden were born in Finland. Iraq follows with approximately 9 percent, Poland with just above 5 percent and Yugoslavia and Iran with just below 5 percent each. Other salient non-European countries include Somalia, Chile and Syria. These groups make up approximately 2–3 percent each of the foreign-born population.
Table 2. Number of foreign-born from the fifteen most frequent countries of birth in 2012.
Country Number Percentage of the foreign-born population Finland 163 867 11.1 Iraq 127 860 8.7 Poland 75 323 5.1 Yugoslavia 69 269 4.7 Iran 65 649 4.5 Bosnia-Hercegovina 56 595 3.8 Germany 48 731 3.3 Turkey 45 085 3.1 Denmark 44 209 3.0 Somalia 43 966 3.0 Norway 42 884 2.9 Thailand 35 554 2.4 Chile 28 425 1.9 Syria 27 510 1.9 China 26 824 1.8 Source: Statistics Sweden, Population Statistics.
To illustrate one dimension of how immigration into Sweden has changed over time, we present in Table 3 a survey of the reasons for granting residence permits between 1980 and 2012. These reasons vary. The proportion of those who obtained a residence permit as refugees was peaked during the early 1990s in connection with the civil war in former Yugoslavia. In the 21st century, family reasons have been the most common reason for granting residence permits. However, the number of residence permits given to people from EU/EES countries and to those who have immigrated for labour market reasons has increased in the 21st century.
During this period, nearly 35 percent of the residence permits were granted to refugees or their family members; "other family members” amounted to slightly more than 32 percent. Slightly less than 15 percent of the residence permits were given to citizens of EU/EES countries as opposed to 10 percent for labour market reasons. It should be noted that most of the latter were temporary permits.
Table 3. Reasons for granted residence permits 1980-2012.
Reasons for residence permits Number Proportion Refugees or the equivalent 413 334 25.2 Refugee family members 145 966 8.9 Other family members 528 571 32.2 Adopted children 23 820 1.5 EU/EES 240 754 14.7 Labour market 166 235 10.1 Visiting students 122 076 7.4 Unknown 402 0.0 Total 1 640 978 100 Source: The Migration Board, Permit Statistics.
To sum up, immigration into Sweden has changed, both in the reasons for immigration and the origins of the immigrants. Until the mid-1970s, it was largely a matter of labour immigration. The percentage of refugees and family members then increased, so that in the last thirty years immigration into Sweden has been dominated by refugee and family reunion immigration. Still, the share of labour immigrants has grown somewhat in connection with Sweden’s EU/EES membership, with EU extensions in the 21st century and with the legislative changes taking place concerning foreign-born from countries outside the EU/EES area.
3. Foreign-born on the Swedish labour market
3.1 Employment rate, unemployment, and proportion outside the labour market
During the labour immigration period the foreign-born were usually quickly established on the Swedish labour market.4 From the end of the Second World War until the mid-1970s the employment rate among the foreign-born was higher than for the native-born population. Still, in the mid-1970s the employment rate among the foreign-born fell below that of the native born, and it has remained lower ever since.5
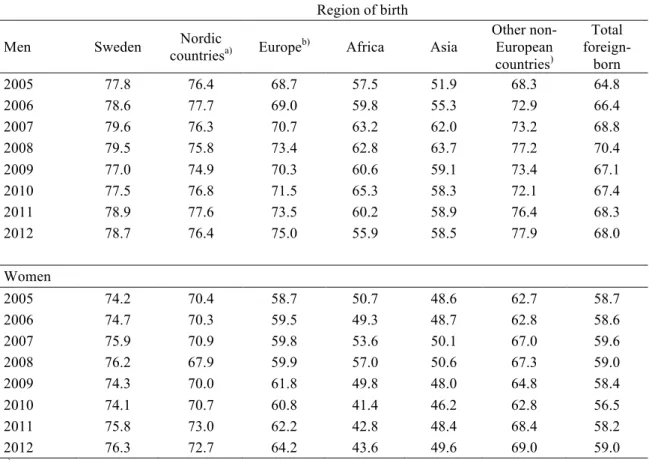
Table 4 shows how patterns in the employment rate from 2005 to 2012 for different groups of foreign-born men and women. There are great differences among these groups. The employment rate increased somewhat for most groups and that was generally higher among men than among women. In addition, foreign-born people from Africa and Asia have a considerably lower employment rate than those coming from other regions. The Africa group is further distinguished by being the only group whose employment rate (for both men and women) actually dropped between 2005 and 2012. For African men the employment rate decreased from just above 57 percent in 2005 to just below 56 percent in 2012. For African women this percentage fell from slightly less than 51 percent in 2005 to slightly less than 44 percent in 2012. Even among foreign-born Asians, the employment rate was very low. For this group, however, the level increased among the men from approximately 52 percent in 2005 to just below 59 percent in 2012. Among Asian women, too, the employment rate increased somewhat during the period, but extremely marginally.
4 The current literature on the foreign-born on the Swedish labour market is extensive. See e.g., Ekberg
and Gustafsson (1995), Edin and Åslund (2001), Hammarstedt (2001) and Eriksson (2011).
5 A survey of changes in immigrants’ relative labour market position is provided, for instance,
Table 4. Employment rate for various groups of foreign-born and native-born men and women (aged 16-64) 2005-2012.
Region of birth Men Sweden Nordic
countriesa) Europeb) Africa Asia
Other non-European countries) Total foreign-born 2005 77.8 76.4 68.7 57.5 51.9 68.3 64.8 2006 78.6 77.7 69.0 59.8 55.3 72.9 66.4 2007 79.6 76.3 70.7 63.2 62.0 73.2 68.8 2008 79.5 75.8 73.4 62.8 63.7 77.2 70.4 2009 77.0 74.9 70.3 60.6 59.1 73.4 67.1 2010 77.5 76.8 71.5 65.3 58.3 72.1 67.4 2011 78.9 77.6 73.5 60.2 58.9 76.4 68.3 2012 78.7 76.4 75.0 55.9 58.5 77.9 68.0 Women 2005 74.2 70.4 58.7 50.7 48.6 62.7 58.7 2006 74.7 70.3 59.5 49.3 48.7 62.8 58.6 2007 75.9 70.9 59.8 53.6 50.1 67.0 59.6 2008 76.2 67.9 59.9 57.0 50.6 67.3 59.0 2009 74.3 70.0 61.8 49.8 48.0 64.8 58.4 2010 74.1 70.7 60.8 41.4 46.2 62.8 56.5 2011 75.8 73.0 62.2 42.8 48.4 68.4 58.2 2012 76.3 72.7 64.2 43.6 49.6 69.0 59.0
a) Referring to those born in the Nordic countries apart from Sweden. b) Referring to those born in Europe apart from the Nordic countries.
c) The group includes people born in South America, North America and Oceania.
Source: Statistics Sweden, special processing by Labour Force Surveys.
A survey of the proportion of employed, unemployed and people outside the labour market in 2012 is found in Table 5. The pattern of employment emerging from Table 4 recurs for the proportion of unemployed and of those outside the labour market. The situation for those born in European countries essentially reflects that which applies to the native born. Unemployment is, however, somewhat higher among Europeans born outside the Nordic region than for the native born. In addition, the proportion of women outside the labour market is higher among European women born outside the Nordic countries than among native-born women.
The picture differs with regard to Asia and Africa. Alongside a relatively low employment rate, the proportion of unemployed is high. Among foreign-born men from Africa the proportion of unemployed was nearly 30 percent in 2012. The corresponding figure for African women was just below 27 percent. The share of unemployed among men born in Asia amounted was nearly 25 percent, compared to approximately 20 percent for Asian women. Further, the proportion of those outside the labour market was especially high for women in these groups. Among women born in Africa and Asia about 40 percent stood outside the market. This may be compared to the corresponding figure for native-born women, which was less than 19 percent.
The "Other non-European" group differs from the African and Asian groups with regard to labour market outcomes. It should, however, be noted that this group also includes foreign-born immigrants from North and South America. Those born in North America
are likely to have both a command of Swedish and an education that are relatively well adapted to the Swedish labour market. Those born in South America have generally spent a long time in Sweden, which may explain why they are well established on the labour market.
Table 5. Proportion of employed, unemployed and people outside the labour market among groups of foreign- and native-born men and women (aged 16-64) in 2012.
Region of birth Men Sweden countriesNordic a) Europeb) Africa Asia
Other non-European countriesc) Total foreign-born Employment rate 78.7 76.4 75.0 55.9 58.5 77.9 68.0 Proportion of unemployed among the labour
6.6 7.1 11.6 29.6 24.9 10.2 16.9 Proportion of
people outside the labour market
15.7 17.7 15.2 20.5 22.1 13.3 18.2 Women
Employment rate 76.3 72.7 64.2 43.6 49.6 69.0 59.0 Proportion of
unemployed among the labour
6.2 5.6 12.9 26.7 20.4 11.6 15.0 Proportion of
people outside the labour market
18.7 23.0 26.3 40.4 37.6 21.9 30.6
a) Referring to those born in the Nordic countries apart from Sweden. b) Referring to those born in Europe apart from the Nordic countries.
c) The group includes people born in South America, North America and Oceania.
Source: Statistics Sweden, special processing by Labour Force Surveys.
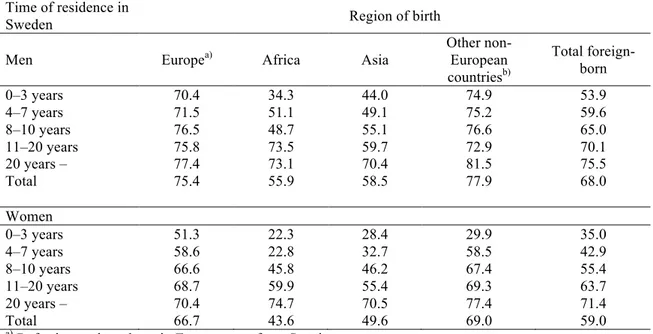
It is reasonable to assume a connection between length of residence in the country and labour market outcome. In Table 6 we present the employment rate for the different groups divided by length of residence in Sweden. As expected, groups which have spent a fairly long time in Sweden show a higher employment rate than those with a shorter time of residence. The employment rate among foreign-born men averaged approximately 54 percent during their first three years in the country. Again, the groups differed widely. The employment rate among those born in Europe who had spent at most three years in Sweden was approximately 70 percent as against 34 and 44 percent, respectively, among African and Asian men who had spent an equally long time in Sweden.
Among men born in Europe the employment rate among those who had spent at least eight years in Sweden was clearly comparable to that of the native born. The rate is considerably lower for men from Africa and Asia. Among Africans who had spent between eight and ten years in Sweden, it was still lower than 50 percent. Among men from these two regions only those who had been in Sweden for more than 20 years had an employment rate that exceeded 70 percent.
Among women with a short period of residency in Sweden the employment rate was considerably lower than among men with the corresponding length of residence. Among women born abroad who had spent three years or less, it was 35 percent. Even here there were great differences between the groups. Women born in Africa who had
been in Sweden for less than three years showed an employment rate of just above 22 percent. Of women from Asia who had been as long in the country the employment rate was approximately 28 percent. As with men, less than half of the African and Asian women who had spent between eight and ten years in the country were employed. Still, among women who had been in Sweden more than 20 years the rate of employment was higher than 70 percent.
Consequently, the differences among the groups are very large. Among those born in Africa and Asia the rate of employment during the first years after immigration into Sweden is extremely low. Nevertheless, even these groups gradually reach an employment level that is close to that of the native born. This, however, applies only to individuals from Africa and Asia who have spent at least 20 years in Sweden.6
Table 6. Employment rate of foreign-born men women (aged 16-64) by time of residence in 2012.
Time of residence in
Sweden Region of birth Men Europea) Africa Asia
Other non-European countriesb) Total foreign-born 0–3 years 70.4 34.3 44.0 74.9 53.9 4–7 years 71.5 51.1 49.1 75.2 59.6 8–10 years 76.5 48.7 55.1 76.6 65.0 11–20 years 75.8 73.5 59.7 72.9 70.1 20 years – 77.4 73.1 70.4 81.5 75.5 Total 75.4 55.9 58.5 77.9 68.0 Women 0–3 years 51.3 22.3 28.4 29.9 35.0 4–7 years 58.6 22.8 32.7 58.5 42.9 8–10 years 66.6 45.8 46.2 67.4 55.4 11–20 years 68.7 59.9 55.4 69.3 63.7 20 years – 70.4 74.7 70.5 77.4 71.4 Total 66.7 43.6 49.6 69.0 59.0
a) Referring to those born in Europe apart from Sweden.
b) The group includes people born in South America, North America and Oceania.
Source: Statistics Sweden, special processing by Labour Force Surveys.
3.2 Educational level group differences
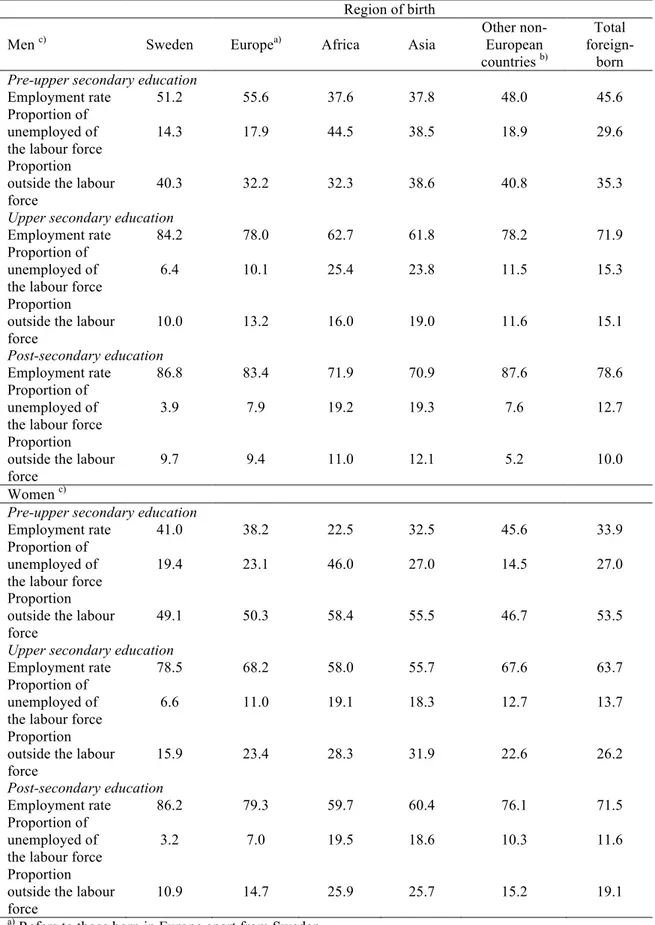
Another way of studying differences in labour market outcomes among the groups is to divide them by education. In Table 7 the groups have been divided into pre-upper secondary school, upper secondary school and post-secondary school education. The same pattern emerges in the groups independently of education level. The low employment rate and the high proportion of unemployed are especially noticeable among people born in Africa and Asia and who have a secondary and post-secondary education. The employment rate among men with post-secondary education from these regions was slightly above 70 percent, but exceeded 87 percent among native-born men with the equivalent education. Among women from Africa and Asia with post-secondary education the employment rate was only about 60 percent, but above 86 percent among native-born women with the same amount of education.
6 The results confirm what has emerged from, e.g., le Grand and Szulkin (2002), Hammarstedt (2003) and
If we study unemployment, we note that among African and Asian men with upper secondary education the proportion of unemployed is approximately 25 percent. The corresponding proportion among native-born men with the same amount of education is just above 6 percent. The share of unemployed among women with upper secondary level education from Africa and Asia was just below 20 percent, as against barely 7 percent among native-born women.
For men and women from these regions who have post-secondary education, we find that both among men and women from these regions the proportion of unemployed was close to 20 percent. In comparison, the unemployed represented slightly less than 4 percent among native-born men and was approximately 3 percent for native-born women with the post-educational background.
Also of note is the large share (more than 25 percent) of African and Asian women with post-secondary education outside the labour force. The comparable figure among native-born women was slightly above 10 percent.
Thus, we may conclude that the problem of low employment and high unemployment among those born in Africa and Asia is not limited to people with a limited education. Even well- educated men and women from these regions have disproportionately low rates of employment and disproportionately high rates of unemployment. It can also be stated that a very high percentage of women with post-secondary education from these regions are outside the labour force.
Having said this, the percentage of employed persons is considerably higher and the share of unemployed considerably lower among foreign-born immigrants with upper secondary or post-secondary education than among foreign-born immigrants with only pre-upper secondary education. This is true of all groups. Obviously, educational investment also pays off for the foreign-born, even though their employment rate is less than that of native-born persons with the same educational level.
Table 7. Proportion of employed, unemployed and persons outside the labour force among different groups of foreign- and native-born men and women (aged 16-64) divided by educational level in 2012.
Region of birth
Men c) Sweden Europea) Africa Asia Other non-European
countries b)
Total
foreign-born
Pre-upper secondary education
Employment rate 51.2 55.6 37.6 37.8 48.0 45.6 Proportion of
unemployed of the labour force
14.3 17.9 44.5 38.5 18.9 29.6 Proportion
outside the labour force
40.3 32.2 32.3 38.6 40.8 35.3
Upper secondary education
Employment rate 84.2 78.0 62.7 61.8 78.2 71.9 Proportion of
unemployed of the labour force
6.4 10.1 25.4 23.8 11.5 15.3 Proportion
outside the labour force 10.0 13.2 16.0 19.0 11.6 15.1 Post-secondary education Employment rate 86.8 83.4 71.9 70.9 87.6 78.6 Proportion of unemployed of the labour force
3.9 7.9 19.2 19.3 7.6 12.7 Proportion
outside the labour force
9.7 9.4 11.0 12.1 5.2 10.0 Women c)
Pre-upper secondary education
Employment rate 41.0 38.2 22.5 32.5 45.6 33.9 Proportion of
unemployed of the labour force
19.4 23.1 46.0 27.0 14.5 27.0 Proportion
outside the labour force
49.1 50.3 58.4 55.5 46.7 53.5
Upper secondary education
Employment rate 78.5 68.2 58.0 55.7 67.6 63.7 Proportion of
unemployed of the labour force
6.6 11.0 19.1 18.3 12.7 13.7 Proportion
outside the labour force 15.9 23.4 28.3 31.9 22.6 26.2 Post-secondary education Employment rate 86.2 79.3 59.7 60.4 76.1 71.5 Proportion of unemployed of the labour force
3.2 7.0 19.5 18.6 10.3 11.6 Proportion
outside the labour force
10.9 14.7 25.9 25.7 15.2 19.1
a) Refers to those born in Europe apart from Sweden.
b) The group includes people born in South America, North America and Oceania. c) Persons whose educational level is unknown are not included.
3.3 Fixed-term employment, persons in managerial positions and academics with qualified work
In this section we turn to the extent to which foreign-born persons have fixed-term employment. We further focus on their likelihood of being employed in managerial positions and of foreign-born academics having qualified jobs (jobs which, according to Statistics Sweden’s definition require theoretical specialist competence, university education or the equivalent knowledge). Table 8 shows the proportion of people with fixed-term employment. According to the table, about 12 percent of all native-born men have fixed-term employment. The comparable figure for foreign-born persons was around 20 percent. Even here differences exist between different groups of foreign-born, revealing the same pattern. The proportion of African men with fixed-term employment amounted to just above 35 percent and that of Asian men just below 25 percent.
Table 8 also shows that the proportion of people with fixed-term employment is somewhat higher among women than among men. Slightly below 17 percent of native-born women had fixed-term employment as against barely 23 percent for women native-born abroad. Among women born in Africa, barely 38 percent had fixed-term employment while the corresponding proportion of Asian women was just below 29 percent.
Table 8. Proportion of fixed-term employment among all employed men and women (aged 16–64 years) with different educational levels divided by region of birth in 2012.
Region of birth
Men c) Sweden Europea) Africa Asia Other non-European
countries b) Total foreign-born Pre-upper secondary education 19.8 20.6 48.1 31.9 24.5 27.6 Upper secondary education 11.7 11.8 31.4 24.2 16.2 16.9 Post-secondary education 11.3 15.2 30.9 24.7 22.5 20.1 Total 12.5 14.4 35.4 25.8 20.4 19.9 Women) Pre-upper secondary education 34.0 20.3 48.9 36.0 23.7 29.6 Upper secondary education 16.9 18.2 34.6 29.9 20.9 22.5 Post-secondary education 14.2 17.7 35.3 25.1 21.7 21.1 Total 16.9 18.3 37.6 28.9 21.8 22.9
a) Refers to those born in Europe apart from Sweden.
b) The group includes people born in South America, North America and Oceania. c) Persons whose educational level is unknown are not included.
Source: Statistics Sweden, special processing by Labour Force Surveys.
This pattern also emerges if we study the probability of being employed in a managerial capacity (according to Statistics Sweden’s Occupational Register). Table 9 also shows that slightly more than eight percent of employed native-born men and just above four
percent of employed native-born women had a managerial position. Roughly the same proportion is found for men and women born in other Nordic countries. For non-European countries the proportion is, however, considerably lower. Among employed men born in Africa, only 1.6 percent were employed as managers, whereas the proportion of African women employed in a managerial position was less than one percent.
Table 9 further shows that the share of persons in a managerial position increases with length of residence in Sweden. The proportion is still very low, even among long-term residents. Among men who had spent between 11 and 20 years in Sweden the proportion of those in a managerial position was barely above 3 percent. The corresponding share of women who had spent 11 to 20 years in Sweden was less than 2 percent.
Table 9. Proportion among the total number of employed of foreign-born individuals (percent) in managerial positions and the proportion among all employed of individuals with post-secondary education (aged 16-64) with a qualified job in 2011, divided by region of birth and time of residence.
Men Women Region of birth Managerial
positiona)
Qualified workb) Managerial positiona) Qualified workb) Nordic countriesc) 7.8 64.5 4.5 72.6 Other European countriesd) 4.1 51.9 2.1 58.3 Africa 1.6 32.2 0.8 40.3 Asia 3.0 46.3 1.7 51.5 South America 2.6 46.7 1.6 53.5 North America 5.8 58.7 3.2 63.9 Other countries 7.6 52.3 4.6 67.6 Time of residence 0–3 years 2.2 39.3 1.5 42.1 4–7 years 2.1 39.7 1.0 42.9 8–10 years 3.0 45.7 1.4 51.1 11–20 years 3.3 48.2 1.7 56.5 >20 years 6.3 63.9 3.5 71.0 Native born 8.2 67.3 4.4 73.5 a)
Refers to individuals with managerial work according to Statistics Sweden’s Occupational Register. Political work is not included.
b) Proportion of individuals with a job requiring theoretical competence or university education or the
equivalent knowledge.
c) Refers to people born in the Nordic countries apart from Sweden. d) Refers to people born in Europe apart from the Nordic countries.
Source: Statistics Sweden’s Occupational Register.
Further, persons with post-secondary education from non-European countries are less likely to have a qualified job. The proportion of men born in Africa who had completed post-secondary education who had a qualified job was just above 32 percent. The comparable figure among native-born men with post-secondary education was just above 67 percent. Among African women with post-secondary education the corresponding proportion was approximately 40 percent, but in excess of 73 percent among native-born women.
Table 9 also illustrates that even among people with post-secondary education who had spent over 20 years in Sweden the proportion of those with a qualified job was roughly
similar to that of native-born persons. Of those born abroad with post-secondary education who had spent more than 20 years in Sweden, 64 percent of the men had a qualified job, and 71 percent of the women did.
3.4 Employment among refugees and family reunion immigrants
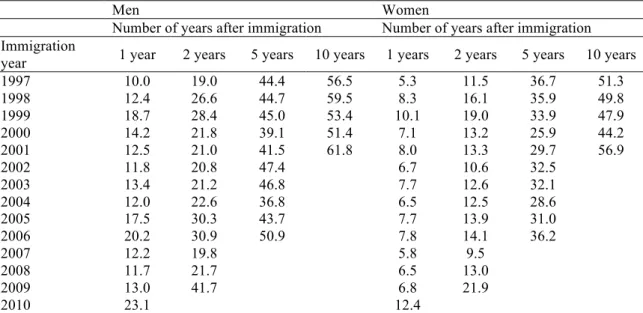
We stated earlier that immigration into Sweden in recent decades has consisted mainly of refugee and family reunion immigration. It is therefore interesting to study how long it takes for these immigrant categories to become established on the labour market. Tables 10 and 11 show the proportion of employed persons in different years after the arrival of refugees and family immigrants into Sweden in the 1997-2010 period.
Immediately after arrival, employment rates are very low. Between 10 and 20 percent of the men and fewer than ten percent of the women with a refugee background have found employment one year after arrival, and even after five years fewer than half of them are employed. As late as ten years afterwards only 60 percent of the men and approximately 50 percent of the women with a refugee background have received employment.
Table 10. Proportion of employed (aged 16-64; by percent) 1-10 years after arrival among refugees with different years of arrival.
Men Women
Number of years after immigration Number of years after immigration Immigration
year 1 year 2 years 5 years 10 years 1 years 2 years 5 years 10 years 1997 10.0 19.0 44.4 56.5 5.3 11.5 36.7 51.3 1998 12.4 26.6 44.7 59.5 8.3 16.1 35.9 49.8 1999 18.7 28.4 45.0 53.4 10.1 19.0 33.9 47.9 2000 14.2 21.8 39.1 51.4 7.1 13.2 25.9 44.2 2001 12.5 21.0 41.5 61.8 8.0 13.3 29.7 56.9 2002 11.8 20.8 47.4 6.7 10.6 32.5 2003 13.4 21.2 46.8 7.7 12.6 32.1 2004 12.0 22.6 36.8 6.5 12.5 28.6 2005 17.5 30.3 43.7 7.7 13.9 31.0 2006 20.2 30.9 50.9 7.8 14.1 36.2 2007 12.2 19.8 5.8 9.5 2008 11.7 21.7 6.5 13.0 2009 13.0 41.7 6.8 21.9 2010 23.1 12.4
Source: STATIV, Statistics Sweden.
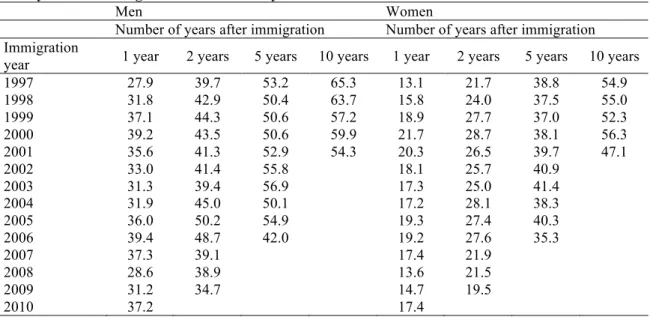
It is reasonable to expect family immigrants to become more quickly established on the labour market than refugees, as the former are more likely to have access to a network of family, relatives and friends, which may improve the chances of securing employment. It also emerges from Table 11 that the proportion of employed persons among family immigrants is higher immediately after arrival than it is among refugees. More than 30 percent of male family immigrants were employed one year after immigrating into Sweden. The proportion was lower for female family immigrants, amounting to between 10 and 20 percent. After ten years in Sweden the share of employed male family immigrants was about 60 percent, and among employed female family immigrants, the comparable figure was about 50 percent.
Table 11. Proportion of employed persons (aged 16-64; by percent) 1-10 years after arrival among family reunion immigrants with different years of arrival.
Men Women
Number of years after immigration Number of years after immigration Immigration
year 1 year 2 years 5 years 10 years 1 year 2 years 5 years 10 years 1997 27.9 39.7 53.2 65.3 13.1 21.7 38.8 54.9 1998 31.8 42.9 50.4 63.7 15.8 24.0 37.5 55.0 1999 37.1 44.3 50.6 57.2 18.9 27.7 37.0 52.3 2000 39.2 43.5 50.6 59.9 21.7 28.7 38.1 56.3 2001 35.6 41.3 52.9 54.3 20.3 26.5 39.7 47.1 2002 33.0 41.4 55.8 18.1 25.7 40.9 2003 31.3 39.4 56.9 17.3 25.0 41.4 2004 31.9 45.0 50.1 17.2 28.1 38.3 2005 36.0 50.2 54.9 19.3 27.4 40.3 2006 39.4 48.7 42.0 19.2 27.6 35.3 2007 37.3 39.1 17.4 21.9 2008 28.6 38.9 13.6 21.5 2009 31.2 34.7 14.7 19.5 2010 37.2 17.4
Source: STATIV, Statistics Sweden.
3.5 Employment, unemployment and proportion outside the labour force among foreign-born immigrating after 2008 with labour market reasons for residence permit Since 2008, citizens of countries outside the EU/EES area have been entitled to work and residence permits in Sweden if they find employment. Table 12 shows employment level, proportion of unemployed and of people outside the labour force in 2012 among foreign-born who immigrated into Sweden in 2008 or later with labour market reasons for being granted a residence permit. The table shows a high level of employment and a low level of unemployment among men and women from both European and non-European countries. For all categories the employment rate is over 90 percent. The highest rate is found among foreign-born women from non-European countries. In that group the share of employed people exceeded 93 percent.
Furthermore, the proportion of unemployed among foreign-born labour force immigrants from non-European countries is lower than among the native born. Somewhat more than 5 percent of men and just below 4 percent of women who have immigrated from non-European countries for labour reasons were unemployed in 2012, which can be compared with 6 and 7 percent unemployed among native-born men and women.
Table 12. Proportion of employed and unemployed persons and persons outside the labour force in 2012 among foreign-born (aged 16-64 years) immigrating in 2008 or later with labour market reasons for being granted residence permit.
Region of birth
Men Europea) Non-European countries Total foreign-born
Employment rate 91.2 91.0 91.1 Unemployment rate
among the labour force
7.0 5.1 6.3 Proportion outside the
labour force
1.9 4.2 2.8
Women
Employment rate 90.7 93.1 91.1 Unemployment rate
among the labour force
3.0 3.6 3.1 Proportion outside the
labour force
6.4 3.4 5.9
a) The group includes foreign-born persons from EU/EES countries as well as from other European
countries.
Source: Statistics Sweden, special processing by Labour Force Surveys.
4. Concluding discussion
This article has focused on foreign-born persons on the labour market in Sweden. It has revealed that the proportion of employed persons among foreign-born in the 16-64 age group amounted to 68 percent among the men and 59 percent among the women in 2012. Among native-born men and women the proportion of employed persons at the same point of time was just below 79 and approximately 76 percent, respectively. There are also large differences in the proportion of unemployed. While unemployment was less than seven percent among native-born men aged 16–64, the corresponding share among the foreign-born was just below 17 percent. Among native-born women, just over six percent were unemployed, while the corresponding share among the foreign-born was 15 percent.
A few results in the report deserve special attention. An overarching result is that the differences are very great among different groups of foreign-born people, depending on where they come from and their reason for immigration. Foreign-born Africans and Asians have a lower employment and a higher unemployment rate than other groups of foreign-born. Further, employment is particularly low among family and refugee immigrants. While foreign-born Europeans have fared quite well on the labour market, less than 60 percent of the men and 50 percent of the women from Africa and Asia had received employment in 2012. In addition, the proportion of unemployed African born at the same time reached nearly 30 percent. Only among those born in Africa and Asia who had spent about 20 or more years in Sweden were more than 70 percent employed. However, it is worth noting that the unemployed among foreign-born who had immigrated into Sweden for labour market reasons reached over 90 percent in recent years. This also applies to labour force immigrants from non-European countries.
When studying groups with different educational levels the same pattern emerges. The employment rate is lower and unemployment higher among those born in Africa and Asia, regardless of their age, than among other groups. Even among people with post-secondary education there is a low proportion of employment and a high proportion of unemployment. Among African and Asian men with post-secondary education, 70
percent were employed and close to 20 percent unemployed in 2012. This may be compared to nearly 87 percent employed and barely four percent unemployed among native-born men with the equivalent educational level.
Among highly educated women from Africa and Asia, the employed constituted a little less than 60 percent and the unemployed somewhat less than 20 percent in 2012. The corresponding proportion among native-born women with post-secondary education amounted to 86 and three percent, respectively. Highly educated African and Asian women also have conspicuously low participation in the labour force. Among these women, those outside the labour force made up over 25 percent, as against a bare 11 percent among women born in Sweden and having a post-secondary education.
Those born in Africa and Asia include not only a lower proportion of employed and a higher proportion of unemployed than other groups. They also receive other kinds of employment. Both men and women born in Africa or Asia are overrepresented in fixed-time employment and underrepresented in managerial positions. In addition, educated people from these regions are more likely than others to have jobs requiring lower competencies than their formal educational level.
While foreign-born Europeans do fairly well on the Swedish labour market, some non-European groups are considerably worse off. What is the reason for this and what can be done about it? One plausible explanation is the human capital of those born abroad. Previous research indicates that educational investment in Sweden, such as Swedish language education, has a positive effect on the individual’s chances of succeeding on the labour market.7 Such investments ought to produce good results, not least for groups of refugees relatively far from the labour market.8
Other explanations are to be found in individual networks and norms. Having access to a network with good contacts has proved valuable for the chances of succeeding on the labour market. Research indicates that networks available to foreign-born people are less beneficial than those available to the native born. The access to networks of different types is closely linked to the choice of place of residence. The extent to which foreign-born persons should be entitled to a free choice of place of residence immediately on their arrival into Sweden is often a matter of debate. Examples from research in Sweden and other countries suggest that persons born abroad should be allowed to choose where they want to settle.9 From an establishment perspective the access to ethnic networks may be an appropriate means of entering the labour market. Hence, there is no problem if the newly arrived settle in places that are already home to a great many employed immigrants, as this may increase their access to ethnic networks and thus their chances of employment. If, on the other hand, those recently arrived prefer to settle in areas where there are many unemployed immigrations there is reason to believe that this may impair the chances of being established on the labour market.
With regard to norms, research indicates that foreign-born people do not consider it less important than the native born to have a job.10 Their activity in searching for jobs is high, according to previous research; even somewhat higher than among the native
7 See e.g. Delander, Hammarstedt, Månsson and Nyberg (2005), Nordin (2011) and Dahlstedt and
Bevelander (2010).
8 See e.g. Lundborg (2013).
9 See Edin, Fredriksson and Åslund (2003, 2004), Grönqvist (2006). 10 See Arai, Regnér and Schröder (1999).
born. Nevertheless, the report concludes that a large proportion of foreign-born women in certain groups remain outside the labour force. This might be interpreted as a result of different cultural norms about work and family within various foreign-born groups.
Furthermore, there is reason to believe that the results can at least partly explain the differences in labour market outcomes between some of the foreign- and native-born groups. There is today a comprehensive literature documenting the prevalence of discrimination on the Swedish labour and housing markets.11 Still, the problem remains that examples of efficient methods for coming to terms with discrimination are non-existent. Various forms of legislation as well as methods reducing the uncertainty regarding the competence of the foreign-born have been suggested. If such methods could be designed they could certainly be productive in increasing employment among those born abroad.
Acknowledgements
The authors thank participants at Linnaeus University Centre for Labour Market Studies for comments. The authors are also thankful for comments from Bertil Holmlund, Eva Mörk Robert Östling and Mårten Palme. Finally, the authors thank Janna Grevillius, Freja Werke and Michael Karlsson at Statistics Sweden for valuable help in processing data.
References
Ahmed, A. & Hammarstedt, M. (2008), “Discrimination in the rental housing market – a field experiment on the internet”, Journal of Urban Economics, 64, 362–372.
Ahmed, A., Andersson, L. & Hammarstedt, M. (2010), “Can ethnic discrimination in the
housing market be reduced by increasing the information about the applicants?”, Land Economics, 86, 79–90.
Arai, M., Regnér, H. & Schröder, L. (1999), Är arbetsmarknaden öppen för alla?, Appendix 6 to Långtidsutredningen 1999/2000, SOU 2000:7, Stockholm.
Arai, M. & Skogman-Thoursie, P. (2009), “Renouncing personal names: an empirical examination of surname change and earnings”, Journal of Labor Economics, 27, 127– 147.
Carlsson, M. (2010), “Experimental evidence of discrimination in hiring of first- and second-generation immigrants”, Labour, 24, 263–278.
11 A large number of studies have documented differences in employment and incomes between foreign
and native-born in Sweden by means of register data, see e.g. le Grand and Szulkin (2002), Hammarstedt (2003), Hammarstedt and Shukur (2006, 2007) and Eliasson (2013). The results indicate that
discrimination is the explanation for at least some of the differences in employment and incomes that have been observed between foreign and native-born persons. Arai and Skogman-Thoursie (2009) show that changing names improves the chances on the labour market of those born abroad. Other studies have used field experiments to pinpoint the existence of discrimination both on the labour and housing
markets, see Carlsson and Rooth (2007), Carlsson (2010), Ahmed and Hammarstedt (2008) and Ahmed, Andersson and Hammarstedt (2010).
Carlsson, M. & Rooth, D-O. (2007), “Evidence of ethnic discrimination in the Swedish labor market using experimental data”, Labour Economics, 14, 716–729.
Dahlstedt, M. & Bevelander, P. (2010), “General versus vocational education and employment integration of immigrants in Sweden”, Journal of Immigrant and Refugee Studies, 8, 158–192.
Delander, L., Hammarstedt, M., Månsson, J. & Nyberg, E. (2005), “Integration of immigrants: The role of language proficiency and experience”, Evaluation Review, 29, 24–41.
Edin, P-A. & Åslund, O. (2001), “Invandrarna på 1990-talets arbetsmarknad”, in Ofärd i välfärden, SOU 2001:54, Stockholm.
Edin, P-A., Fredriksson, P. & Åslund, O. (2003), “Ethnic enclaves and the economic success of immigrants – Evidence from a natural experiment”, Quarterly Journal Economics, 118, 329–357.
Edin, P-A., Fredriksson, P. & Åslund, O. (2004), “Settlement policies and the economic success of immigrants”, Journal of Population Economics, 17, 133–155.
Ekberg, J. (2009), Invandringen och de offentliga finanserna, Rapport till Expertgruppen för studier i offentlig ekonomi, 2009:3, Stockholm.
Ekberg, J. & Gustafsson, B. (1995), Invandrarna på arbetsmarknaden, SNS förlag, Stockholm.
Ekberg, J. & Hammarstedt, M. (2002), “20 år av allt sämre arbetsmarknadsintegrering av invandrare”, Ekonomisk Debatt, 30, 343–353.
Eliasson, T. (2013), “Decomposing immigrant wage assimilation – the role of workplaces and occupations”, IFAU Working Papers, 2013:5.
Eriksson, S. (2011), “Utrikes födda på den svenska arbetsmarknaden”, Appendix to Långtidsutredningen 2011, Elanders Sverige AB, Stockholm.
Granovetter, M. (1973), “The strength of weak ties”, American Journal of Sociology, 78, 1360–1380.
Grönqvist, H. (2006), “Ethnic enclaves and the attainments of immigrant children”, European Sociological Review, 22, 369–382.
Hammarstedt, M. (2001), Making a living in a new country, doctoral dissertation, ACTA Wexionensia, no. 9, Växjö University.
Hammarstedt, M. (2003), “Income from work among immigrants in Sweden”, Review of Income and Wealth, 49, 185–203.
Hammarstedt, M. & Shukur, G. (2006), “Immigrants’ relative earnings in Sweden – a cohort analysis”, Labour, 20, 285–323.
Hammarstedt, M, & Shukur, G. (2007), “Immigrants’ relative earnings in Sweden – a quantile regression approach”, International Journal of Manpower, 28, 456–473.
le Grand, C. & Szulkin, R. (2002), “Permanent disadvantage or gradual integration: explaining the immigrant-native earnings gap in Sweden”, Labour, 16, 37–64.
Lundborg, P. (2013), “Refugees’ employment integration in Sweden: Cultural distance and labour market performance”, Review of International Economics, 21, 219–232.
Nordin, M. (2011), “Immigrants’ return to schooling in Sweden”, International Migration, 49, 144–166.
Nordström Skans, O. & Åslund, O. (2010), “Will I see you at work? Ethnic workplace segregation in Sweden 1985-2002”, Industrial & Labor Relations Review, 63, 471-493.
Olli Segendorf, Å. (2005), Job search strategies and wage effects for immigrants, Stockholm University Sofi dissertation series 65.
Åslund, O., Hensvik, L. och Nordström Skans, O. (2014), “Seeking similarity: how immigrants and natives manage at the labour market”, Journal of Labor Economics (forthcoming).