Investigating demand forecasting
strategy and information exchange
A case study at a Swedish wholesaler
Paper within Supply Chain Management
Authors: Karlsson Christian, Abdul Aziz Imadeddin Tutor: David Eriksson
Mailing address: Visiting address: Telephone: Box 1026 Gjuterigatan 5 036-10 10 00 551 11 Jönköping
Acknowledgement
We would like to start by voicing our gratitude towards the CEO Magnus Heijel and the business developer Martina Erlingmark at Mavis for their valuable insights and transparency throughout the project. Also we would like to express our gratitude towards our friends, family, classmates and our beloved ones for supporting us throughout this project during our toughest periods. Lastly, we would like to express a massive gratitude towards our supervisor David Eriksson which has been supporting us throughout the project, providing us with valuable insights, answering emails, and phone calls. Without Erikssons inspiration and positiveness day-in and day-out, this project could not have been possible.
Abstract
Purpose – Forecasting is a firm's ability to anticipate or predict the future demand given
on a set of assumptions. For a company to implement an appropriate forecast model which can make accurate assumptions, the model needs to be aligned with the company's business situation and enhanced through supply chain relationships. Therefore, the purpose of this study is:
Investigate how small sized wholesalers benefit from demand forecasting. The purpose is divided into two research questions
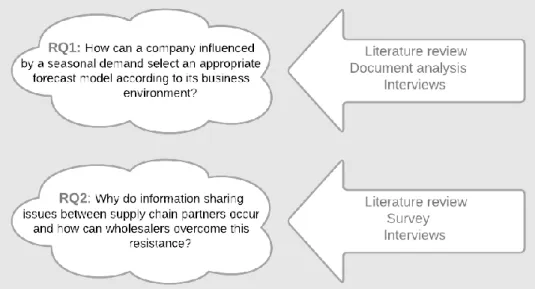
RQ1: How can a company influenced by a seasonal demand select an appropriate forecast model according to its business environment?
RQ2: Why do information sharing issues between supply chain partners occur and how can wholesalers overcome this resistance?
Method – The researchers executed a singular case study at one of the local small-sized
furniture wholesalers in Sweden. The data collection methods implemented in this study are interviews, document analysis and a survey addressed towards downstream members of the wholesalers’ chain, retailers (five participants). The combination of both qualitative as well as quantitative methods was based on a triangulation principle which helped the researchers provide a comprehensive understanding of the problem as well as increase validity and credibility of the study.
Findings – The result of the study raises the importance of selecting a forecast model in
accordance with the company's business situation. Furthermore, by the help of a self-designed four-step forecast process the company could identify its influencing factors (seasonality, lead-times, lack of information sharing, etc.), available data, and finally select the appropriate model corresponding with the business situation. In this study the Holt-Winters model was selected due to the promotion of simplicity considering the case company. Also, the issue regarding information sharing among supply chain partners was identified where retailers promotes the performance of the whole supply chain and demands a partnership as a requirement for sharing information.
Implications – As every firm is unique and different in its nature it therefore requires its
own specific forecast process in which can select the appropriate model. However, the study revealed how selecting the appropriate forecast model can enhance the business meeting their seasonal demand. Additionally, the fact that small-sized companies need to establish a partnership to receive demand information from their retailers. Based on the result, the study reveals how companies can enhance their situation through demand forecasting.
Limitations - As each model is based on each specific company the results regarding the
selected forecast model can be questioned. Furthermore, due to the limited time-period of the research a specific forecast process had to be constructed which could only cover the scope of the research and not how the forecast model performed over time. Therefore, a longer time-period of the research could have included extra activities in the forecast process which would have validated the model.
Keywords
Forecast model, forecast process, seasonality, information sharing, partnership, Holt-Winters model
Content
1
Introduction
5
1.1 BACKGROUND 5
1.2 PURPOSE AND RESEARCH QUESTIONS 6
1.3 DELIMITATIONS 7
1.4 OUTLINE 7
2
Methodology
9
2.1 CONNECTION BETWEEN RESEARCH QUESTIONS, METHODS AND LITERATURE REVIEW 9
2.2 RESEARCH PROCESS 10
2.3 RESEARCH DESIGN 12
2.4 QUANTITATIVE, QUALITATIVE & MIXED METHOD RESEARCH APPROACHES 14
Quantitative research approach 14
Qualitative research approach 15
Mixed methods study 15
2.5 DATA COLLECTION AND ANALYSIS 16
Semi-structured interviews 16
Survey 17
Document analysis 17
2.6 RELIABILITY AND VALIDITY OF THE RESEARCH 18
Reliability 18
Validity 18
3
Theoretical background
20
3.1 FORECASTING WITHIN ORGANIZATIONS 20
3.2 SEASONALITY 20 3.3 TIME SERIES 20 3.4 FORECAST PROCESS 21 Seven-step process 22 Problem definition 22 Data collection 22 Data analysis 22 Identifying patterns 23
Model selection and fitting 25
Model validation 25
Monitoring forecasting model performance 26
3.5 CONSTRUCTED FORECAST PROCESS 26
ARIMA model 27
Holt-Winters Model 27
3.6 SWEDISH FURNITURE MARKET FROM A WHOLESALER-RETAILER PERSPECTIVE 31
4
Empirical Data
34
4.1 CASE COMPANY 34
4.2 COMPANY ASSESSMENT 34
4.3 PROCESS OF SELECTING APPROPRIATE FORECAST MODEL 36
Forecast process 36
Problem definition 36
Data Collection 37
Data analysis 37
Model selection and fitting 37
4.4 RESULTS FROM THE SURVEY 46
4.5 RECOMMENDATIONS TO THE COMPANY 49
5
Analysis
51
5.1 ANALYSIS OF BUSINESS SOLUTIONS 51
5.2 ANSWERING THE RESEARCH QUESTION 53
6
Discussion and conclusions
55
6.1 DISCUSSION OF RESULTS 55 6.2 DISCUSSION OF METHODOLOGY 56 6.3 IMPLICATIONS 56 6.4 CONCLUSIONS 57 6.5 FURTHER RESEARCH 57
References
58
Appendices
64
1
Introduction
This chapter presents a foundation of the investigation, including the background for the study as well as the problem field. Other than that, the purpose and the research questions are addressed. Chapter ends with the explanation of delimitations and outline of the study.
1.1 Background
In today's both, rapidly changing and competitive market, companies are forced to continuously improve by offering lower prices and providing higher service levels to fulfill customer requirements. At the same time, customization and faster lead times are crucial aspects for customer satisfaction. Globalization has increased market dynamics and created broader opportunities for organizations such as, for instance, outsourcing to cut large costs in labor and manufacturing (Abdul-Halim et al., 2016). However, the trade-offs in implementing outsourcing are longer lead-times and higher inventory levels (Boute & Van Mieghem, 2015). Furthermore, long lead-times due to long distances makes it hard for companies to maintain a just-in-time approach, especially for the ones that are dealing with seasonal sales peaks and introducing new products to the market. Seasons and trends play a key role in some specific industries. And the most difficult aspect within those industries, most of which are implementing outsourcing to save costs, is to closely estimate demand throughout the seasonal period.
The Swedish furniture industry is the fifth largest exporter of furniture in the EU (European Union) and the tenth largest in the world with an increasing production over the last 10 years (Trä- och Möbelföretagen, 2020). However, the import is still larger than the export due to the competitive market which leads to a large part of the Swedish furniture companies choosing to outsource their wooden manufacturing to the Baltic-states (Ekholm, 2006). The Baltic-Baltic-states is offering good infrastructure, low-cost labor, and shorter lead-times in comparison with Asian countries and therefore becoming a convenient option for Swedish furniture enterprises (Marin, 2006). The furniture industry is under the influence of, just like the clothing industry, different supply chain matters such as trends, seasonality, and lead-times. Seasonal sales and sales peaks are something that retailers handle on an annual basis and can be easy to predict, for instance, during Christmas, black Friday etc. Additionally, some products have a predictable seasonality due to their obvious functions. Good examples could be surfboards with a high demand during summer, or ski gear with a high demand during winter. Trends within the furniture industry are an important matter as well due to the large amount of inventory that wholesalers and retailers need to carry. Therefore, not following today's trend can be expensive for both the wholesaler and the retailer. The main challenge in managing inventory for retailers is to match their demand and replenishment during the seasonal sales peaks, meaning not leaving any shelves empty due to stock-outs. Not accounting for seasonal demand leads to mismatches between demand and supply for retailers and is in the end resulting in higher costs, yet there appears that many retailers lack the skills of handling their inventory in the case of seasonal demand (Ehrenthal, Honhon & Van Woensel, 2014).
The globalization and outsourcing within the furniture industry have led to the rise of competitiveness in the supply chain since furniture is bulky, therefore customers and retailers tend to choose the most convenient over loyal purchase (De Pelsacker et al., 2007). Moreover, the financial crisis in 2008 pressured firms' inventory agility more than any other crisis as the demand collapsed which induced retailers to move their inventory back in the chain to the wholesalers and start focusing on a just-in-time approach (Udenio et al., 2018).
The existence of a retailer is built on a basic idea which is to satisfy a need in the market from an organized entity of resources, people, skills, and knowledge. The best possible way to do that is to make a rigid strategic plan. A strategic plan has since years back in time included topics such as founding policy, interaction between customer, product policy etc.
(Kristenson, 1983). Creation and the success of a plan depends on the complexity of the
supply chain, product variety, supplier relationship, etc. Successful plans are created closely with the suppliers through mutual trust, common goals, open communication, and credible commitments (Levy & Weitz, 2008). Solid knowledge of the market should be the starting point when designing a retailer assortment (Kristenson, 1983). However, leaving retailers with unfilled orders leads to stock-outs which in the end results with not only the loss of potential sales but also the failure of satisfying the retailer (Moon, 2013).
Forecasting is a firm's ability to anticipate or predict the future demand given on a set of assumptions which leads to a variety of different elaborations (Moon, 2013). Furthermore, short lead-times make forecasting more accurate which is why many firms today strive to attain a just-in-time approach (Yang & Pan, 2004). However, as mentioned earlier due to globalization many firms tend to outsource their manufacturing plants in favor of lower labor costs which also increases the lead-times to the manufacturer. For this reason, appropriate demand forecasting is crucial for a firm's survival in today's competitive market, especially from a wholesaler perspective where both upstream and downstream of the supply chain needs to be considered. For example, firms that outsource their manufacturing plants might have a long time from its suppliers even though the lead-time to their customers can be very short. This is the case for many Swedish wholesalers operating within the furniture industry since they lack influence on their manufacturer. Additionally, forecasts should be conducted in collaboration with the retailers and shared with the manufacturer since it is crucial regardless of the size of the company. In the types of situations where the manufacturer prioritizes larger customers the wholesaler must rely on their demand of previous sales since they lack training and expertise regarding forecasting (Moon, 2013). Moreover, as mentioned before, a forecast is an anticipation of the future and due to market complexity, the performer requires knowledge of fundamental perspectives before starting to predict things (Phillips, 2019).
1.2 Purpose and research questions
Supply and demand need to be aligned within its market for a company to stay competitive in terms of having the desired products in stock for customers (retailers) when needed. Furthermore, the furniture industry is under the influence of seasonality which means that most of the revenue for wholesalers occurs during a brief period each year. Additionally, most of the small sized enterprises lack influence on their manufacturers and retailers within the supply chain in terms of lead-times and information regarding demand. For this reason, small-scale companies need to maintain a proper forecast to satisfy customers' requirements during the sales peaks to survive within the market. Therefore, the purpose of this study is to:
Investigate how small sized wholesalers benefit from demand forecasting
With this purpose the research will explore the process of implementing a forecast model, and how a model could help small companies to offset their weak power positions and either gain priority or be able to successfully obtain the required supply. The study will investigate how demand forecasting can meet trends and seasonal fluctuations from a wholesaler-retailer perspective, where the supply is fulfilled by an outsourced
manufacturer. Since small-sized enterprises also have difficulties acquiring access to data from supply chain partners, this research will focus on forecast methods that rely on limited data. Furthermore, the researchers will explore the several reasons for the absent information exchange between wholesalers and retailers.
The first research question focuses on how companies influenced by seasonality can implement a suitable forecast model for its business situation through the appropriate forecast process. For this reason, the first research question was formulated as following:
How can a company influenced by a seasonal demand select an appropriate forecast model according to its business situation?
The second question focuses on the downstream part of the supply chain as in how wholesalers can gain access to retailers excepted sales in order to improve their forecast. For this reason, a second research question was formulated as following:
Why do information sharing issues between supply chain partners occur and how can wholesalers overcome this resistance?
1.3 Delimitations
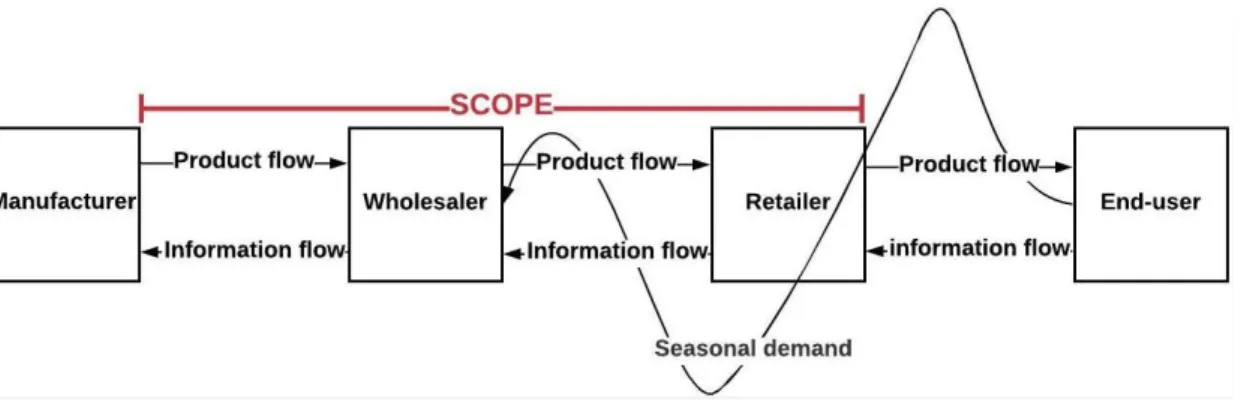
The study aims at proposing a model and data to forecast the demand of a micro-enterprise furniture wholesaler with a seasonal demand. Therefore, this paper is limited to the findings and analysis that will not cover relation to medium or large sized organizations operating in the same or other fields. Furthermore, the study aims at investigating factors and data related to the demand of furniture from a wholesaler - retailer perspective which means that factors influencing manufacturer - wholesaler apart from lead-time will not be considered in this study.
Figure 1-1: Scope of research.
1.4 Outline
The first chapter introduced the topic of the research though a background which is funneled down to the research problem. The chapter continues by explaining the purpose of the research and is divided into two research questions. The chapter ends with scope of research, delimitations and disposition.
The second chapter draws a common line between the research questions and implemented methods. Furthermore, the researchers introduce the research process of the study with a time duration and steps explained. Moreover, the convergent research design that simultaneously combines both qualitative and quantitative methods is illustrated and
discussed. The chapter continues with data collection methods explained and justified. Finally, validity and reliability of the study are defined and described according to the area of investigation.
The third chapter is divided into two major parts which are supposed to answer the research questions covering the demand forecasting, importance of information sharing and business relationship. Chapter starts by introducing the importance of forecasting and a forecast process which attains a proper demand-driven model. The chapter ends with the different views of relationships within a supply chain and the strategic importance of establishing a partnership.
The fourth chapter presents the obtained results for the case company in the form of empirical data. The chapter starts by defining the case companies “influencing factors” and through the constructed forecast process attains the forecast model. Furthermore, the selected forecast model which was tested at the case company is presented step-by-step. The chapter ends by presenting the answers collected from the survey.
The fifth chapter starts by building up a foundation of analysis between the obtained results and the theoretical framework in order to answer the two research questions. The chapter ends with respectively answering the research questions.
The sixth chapter is discussing the generalization and reliability of obtained results as well as the used methods. The chapter ends with a conclusion of the report.
2
Methodology
The purpose of this chapter is to generate a comprehension of the authors’ methods choices as well as provide a holistic description of a research approach and design, work process, and data collection. The chapter concludes with an underlined reliability and validity of the study.
2.1 Connection between Research Questions, Methods and Literature Review
Figure 2-1: Connection between Research Questions, Methods and Literature Review
At the initial stage, in order to answer the first research question, a theory based on existing literature was used, which later helped when developing and conducting semi-structured interviews. The combination of both literature review and qualitative interviews as well as document analysis were implemented as a triangulation method to increase the validity of the study. Comprehensive data collected from the mentioned methods helped in analyzing and answering the first research question.
Regarding the second research question, other than qualitative data collected from interviews, statistical and empirical data was collected using survey that included both open-ended and closed-ended questions for the researchers to gain a deeper understanding of the topic and draw a reliable and generalizable conclusion. This was also done to implement method triangulations, which means that both qualitative and quantitative methods were used simultaneously, complementing each other, and building a trustworthy understanding of phenomena.
2.2 Research process
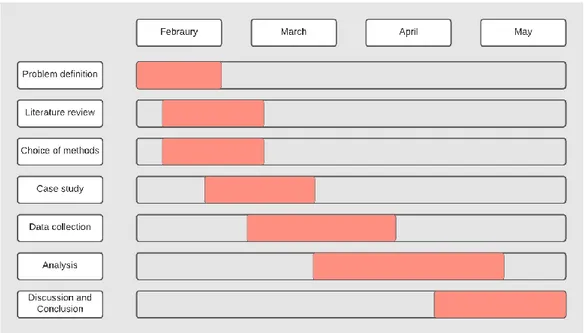
Figure 2-2: Research process
Figure 2-2 above illustrates the comprehensive structure of the research process. This study has a duration time of approximately 16 weeks. The authors of this study have been working intensively during the time frame. At the early stage as soon as the company was determined, authors allocated 2 weeks to define the finite project scope as well as indicate the necessary resources required for investigation. Moreover, a brief market analysis was conducted in combination with literature research to define the specific problem of the study.
The literature review was an important process of the problem determination which had an overall time frame of five weeks. ProQuest Central, Primo, Scopus were the search engines used when searching for scientific articles. The main benefit of the search work was the knowledge gained during the search, i.e., the understanding in practice of how to use and combine different search words in order to get the most appropriate and suitable results for a specific topic. However, a negative experience appeared when deciding which database to use. ProQuest was found to be the most appropriate and convenient one due to the fact that not all search engines have an opportunity to limit the search down to peer-reviewed articles. A literature review was conducted intensively since it helped the researchers share the existing results of other studies that are directly related to this research and cover essential gaps. It provides a framework for establishing the importance of the study as well as a benchmark for comparing the results with other findings (Creswell and Creswell, 2018, p.41). Literature contributes to the body of knowledge on the chosen subject, and it is linking a wide problem with the narrowed research questions that leads directly into the study's methodology. Literature review conducted in this study consisted of six steps:
• Key words were identified
• Search was accomplished using different searching engines
• Relevant articles, journals, books, and other sources were structurally located and prioritized
• The once central to the topic were chosen
• The summaries were at the end combine and a holistic literature review-based theory was provided
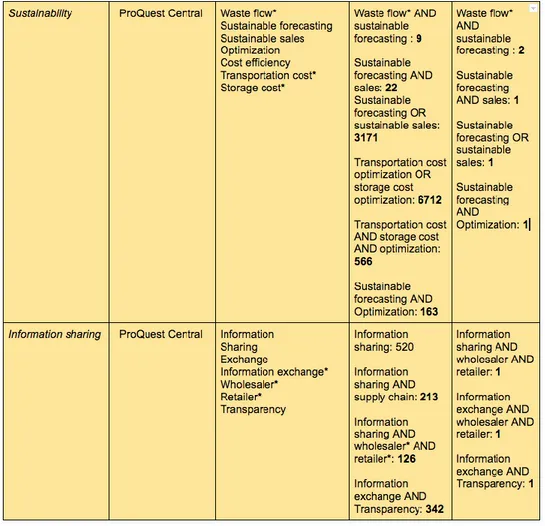
The main criterion for the articles was that they had to include and cover the fundamentals of forecasting of demand and sales. Furthermore, specifically the furniture industry was supposed to be covered. The article had to be relevant for our thesis project in the way that it includes keywords associated with how to improve the accuracy of forecasting sales or demands of new and current products as well as the issues associated with information sharing between various stages of the supply chain and how that problem could be improved. Figure 2-3 illustrated below shows a brief description of how the literature search was conducted including search engines, key words, and combinations as well as number of hits.
Figure 2-3: Literature search
Regarding the method's choice, once the problem was distinctly defined, the authors had no doubt that the best way to investigate it would be with the help of interviews and a survey, because any supply chain is a complex structure with many implicated companies having different points of view regarding the forecasting strategy and how the information sharing should be accomplished. Therefore, instead of only collecting data from historic documents it is also important to analyze personal perceptions at various stages of the chain, including both wholesalers and retailers. When it came to the analyzing phase of the research, it adopted a simple form in which all data collected was reviewed, structured, assessed, combined, and later reported formally and compared to the theoretical framework.
2.3 Research design
According to Robert K. Yin (2014) “A research design is the logic that links the data to be collected (and the conclusions to be drawn) to the initial questions of study. Every empirical study has an implicit, if not explicit, research design” (p.111). The main aim of the research design is to underline the connection between the conclusions from the study and the addressed problem. Therefore, the research design of this study represents the logical order that links proposed research questions and collected data.
The exploration method implemented to logically and in detail answer the research questions was a case study. A case study is “...a study that investigates a contemporary phenomenon in depth and in its real-world context.” (Yin, 2014, p.595). Therefore, since the researchers had to deal with a real company with different complex issues related to a
proper forecasting strategy, they decided to conduct a case study which in turn provided a deeper understanding of empirical data. The company that was chosen for the single-case study is a small-size Swedish furniture wholesaler that outsources its manufacturing and focuses on designing high quality products for retailers operating in the Swedish market. It was selected among the other companies since it precisely fits the purpose of conducted investigation and fulfills all the essential requirements including seasonal demand, outsourcing, information exchange issues, lack of forecasting knowledge etc. Besides, case study empowers the investigators to create the hypothetical model, since it presents a deep understanding of the experimental data which permits the researchers to change the model (Dubois & Gadde, 2002). Hence, case study is the most appropriate investigation method for this research due to the fact the main goal of this study was to investigate an already existing strategy and either improve it or apply a new model if required. The research design of this thesis is shown in the figure 2-4 illustrated below:
Figure 2-4: Convergent Research Design
“A research design is a logical plan for getting from here to there, where here may be defined as the initial set of questions to be answered, and there is some set of conclusions (answers) about these questions. Between here and there may be found a number of major steps, including the collection and analysis of relevant data.” (Yin, 2014, p.117) This quote underlines the importance of choosing the right methods and associated design. Before deciding which design to build the thesis on, the authors found it necessary to analyze the problem statement and possible scenarios answering research questions. Some required actions were underlined that helped choose the right design. First, there was a necessity to
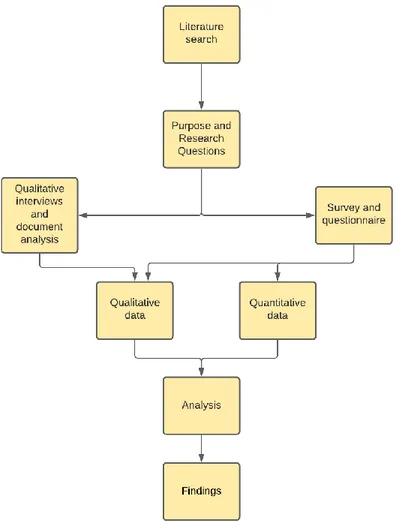
identify and understand what factors caused the problem and how different factors affect the outcome (forecasted demand). The most efficient way to investigate that is by using quantitative methods since it touches upon facts rather than someone’s perception. However, later the researchers realized that there was a lack of research in the field of demand forecasting within the furniture industry. The best suitable solution in this case, is to implement qualitative methods such as interviews, organization data, etc. since it brings some personal, previously unreached knowledge to the surface. All that led to the understanding of the need of a more applicable way where both qualitative and quantitative methods are combined in one study. An additional reason for choosing mixed methods approach is that the researchers had a goal to not only “...develop a detailed view of the meaning of a phenomenon or concept” for the case company but also be able to “generalize the findings to a population” (Creswell and Creswell, 2018, p.57). There are three main types of mixed methods designs: the convergent design, the exploratory sequential design and the explanatory sequential design (Creswell and Creswell, 2018, p.299). The major difference between listed designs is the form of data collection, data analysis and interpretations. In this study, the researchers have implemented convergent design since data were collected simultaneously combining both qualitative and quantitative methods in order to provide a holistic analysis of the identified problem. “In this design, the investigator typically collects both forms of data at roughly the same time and then integrates the information in the interpretation of the overall results.” (Creswell and Creswell, 2018, p.300). The researchers first collected both quantitative and qualitative data and then compared the results to see if the findings comprehensively help answer research questions.
However, although the mixed method design seems to be the most appropriate for this study, there were some challenges when combining different approaches. The time required to collect both qualitative and quantitative data was the hardest task to deal with. That is why the convergent design was chosen over other possibilities since it is the only type that can be implemented concurrently instead of conducting things in a formal sequence which will require a longer timeframe. Finally, mixed-method research is a more complex approach that demanded gaining some extra knowledge about both research forms.
2.4 Quantitative, Qualitative & Mixed method research approaches
Quantitative research approach
Quantitative research is an approach based on numeric data, which is usually collected through standardized questionnaires or experiments. It is usually applied when there is a lack of existing research on a specific subject. “Quantitative research is an approach for testing objective theories by examining the relationship among variables” (Creswell and Creswell, 2018, p.41). The variables and information gathered using different quantitative methods is then analyzed, and the conclusions are drawn. There are three most common quantitative designs that can be used to analyze the phenomena including experimental, quasi-experimental, and non-experimental (Rutberg & Bouikidis, 2018). It is important to understand the difference between quantitative and qualitative approaches. Quantitative research is formed in terms of numbers and is based on closed-ended questions (Creswell and Creswell, 2018, p.41). This approach is usually “conducted in a more structured environment” (Rutberg & Bouikidis, 2018), which makes it easier for the researchers to determine relationships between variables and outcomes.
Qualitative research approach
Qualitative research approach is on the other hand a type of study which addresses the understanding of the “meaning individuals or groups ascribe to a social or human problem” (Creswell and Creswell, 2018, p.41). Some examples of different methods associated with this approach are open-ended questions and semi-structured interviews. Qualitative research is conducted when the problem is hardly understood or there is lack of existing research and researchers are willing to deeply investigate the specific area. Since this is a reasoning-based approach, the key word associated with it is perception, which means participants share their experience and thoughts. The main idea behind is once again to examine a “...phenomena using an in-depth, holistic approach and a fluid research design that produces rich, telling narratives” (Polit & Beck, 2016, p.326). From a researcher perspective, seeking “to build partial and contextualized truths in collaboration with their research participants or through reflexive engagement with their research texts” (Leavy, 2014, p. 460) is the main idea behind qualitative research. Regarding the data collection, researchers themselves can be considered as tools, since they are engaged in the applied methods (interviews, observations etc.) throughout the whole investigation (Bell & Waters, 2014, p.31). In comparison with the quantitative approach, quantitative research allows more freedom in choosing the important topics. While quantitative study is a numbers-based approach, qualitative can be described in terms of the use of words with open-ended questions addressed towards the participants and the same type of answers received (Creswell and Creswell, 2018, p.41). However, there are some issues when implementing this approach. Due to the fact that results are mostly subjective, they are not fully reliable, nor can they be generalized. To sum this paragraph up, the process of the qualitative approach “involves emerging questions and procedures, data typically collected in the participant’s setting, data analysis inductively building from particulars to general themes, and the researcher making interpretations of the meaning of the data” (Creswell and Creswell, 2018, p.41).
Mixed methods study
In this study, both qualitative and quantitative approaches were equally implemented to increase the validity of results. “Using both quantitative and qualitative methodology into a single study is known as a mixed methods study” (Rutberg & Bouikidis, 2018). According to Tashakkori and Creswell (2007), mixed methods research is a “research in which the researcher collects and analyzes data, integrates the findings, and draws inferences using both qualitative and quantitative approaches or methods in a single study or program of inquiry” (p. 4). Using a combinative approach allows researchers to collect both objective and subjective data to ensure the validity and reliability. Polit and Beck (2016) describe different pros of using a mixed method approach, including complementary, practicality, incrementality, enhanced validity, and collaboration. To begin with, the first advantage is that quantitative and qualitative approaches complement each other, i.e., qualities of each are emphasized. Second advantage is practicality which gives a researcher an ability to implement any preferred method. Furthermore, incrementality as one of the advantages can be defined as a step-by-step process. In the case of this research, incrementality played a big role since the data was collected using different methods, whereas information provided by each method helped understanding the data from another method. Moreover, one of the main benefits of a mixed approach is the enhanced validity since there are different types of data supporting the hypothesis. Taking everything mentioned above into account, it can be concluded that the reason for the researchers choosing this specific approach has some key points, including integration of both qualitative and quantitative methods to collect different data which provides additional insights on a particular problem as well as combines the strengths and balances out the flaws of each approach.
2.5 Data collection and analysis
This subchapter explains the primary data collection methods that were utilized in the research to ensure the solid answer to the purpose of the study. It also briefly explains how each selected method was analyzed. “Primary or first-hand data is the data produced by a situation without being recorded by someone other than yourself. Colloquially, what you hear with your own ears or see with your own eyes considered as primary data” (Yin, 2014, p.160). The methods used in this case study are semi-structured interviews, a questionnaire-based survey, and a document study.
Semi-structured interviews
The interview is the data collection method that was used in this study in order to get a current state of the situation, identify gaps and opportunities. Yin (2018) underlines that the explanatory questions as “Why” and “How” are supposed to be answered by interviewing concerned actors, and this approach is the most useful (p.33).
Interview is “...the mode of data collection involving verbal information from a case study participant; the interview is usually conversational in nature and guided by the researcher’s mental agenda, as the interview questions do not follow the exact same verbalization with every participant interviewed” (Yin, 2014, p.599). The 3 main types of interviews are “intensive interviews,” “in-depth interviews,” or “unstructured interviews” (Yin, 2014, p.599). The ones conducted in this study were more of an unstructured kind, where different questions were asked depending on the answers from the previous ones. This way of interviewing gave the researchers an opportunity to get a greater understanding of the assigned topic of this study by arising significant questions in a real-time basis. Usually interviews as a part of data collection consist of many addressed questions that help discover the problem statement effectively (Polit & Beck, 2016). One of the advantages in conducting interviews is the accuracy of the data due to the capability of recording the conversation and using it during the analysis stage. In this study all conducted interviews were recorded, i.e., handwritten notes were taken.
The interviews conducted in this research were of semi-structured nature designed in a form of a conversation and discussion with enough time allocated due to the fact that the sample size at the company was 2 people. In a general understanding, interviews should take place in a convenient natural environment of the participant. That can vary from an office to a conference room or even some public place such as a café. Face-to-face interviews discussed in this study took place two times in the head office of the company in a natural working environment. Since as already mentioned in previous chapters, one of the ideas was to generalize from a sample to a population, it was important for interviewers to keep the semi-structured form with open-ended questions so that the questions could be controlled and adjusted in a real-time basis.
First interview was conducted to get an overview of the case company while the second one was built upon the questions that arose after conducting literature search and finding common issues. However, a mistake was made at the initial stage. Some issues associated with time management emerged when conducting the first interview. The investigators did not allocate the time correctly, so some important questions were not asked due to the busy schedule of the participants. In order to overcome occurred problem before the second interview, the researchers changed the course of the interview and the prioritization of questions asked.
Survey
According to Robert K. Yin (2014), a survey is another type of case study interview that is based on a structured questionnaire (p.599). It is one of the quantitative data collection methods that is a part of the case study evidence. The main issue that the researchers had to deal with was limiting the number and type of questions within the questionnaire which should later be analyzed. Other than that, “…the human respondent to a survey questionnaire cannot deviate (far) from the agenda set by the questions” (Yin, 2014, p.255), which basically means that respondents are limited by the scope set by the researchers, which potentially leads to some participants not willing to take part in the survey. The survey conducted in this study was not an exception. The researchers allocated 2 weeks identifying the necessary topics and questions and cutting off unnecessary ones. They also ensured that there are enough open-ended questions to create a ‘free environment’ and attract more participants. The general aim of this study is to investigate the demand forecasting strategy within the furniture industry from a wholesaler-retailer perspective, so it was not only important to interview the case study company, i.e., the furniture wholesaler but also address some questions towards the downstream chain members, i.e., retailers. The important problem addressed in this study is the lack of information sharing between the actors of the supply chain. Hence, the designed survey was distributed to the largest Swedish furniture retailers that are in partnership with the case company for the researchers to understand the reasons behind it. Validity of the survey is a key extent. Hence, since this thesis includes a wide range of different interconnected subject, researchers guaranteed that each relevant issue was addressed including forecasting, seasonality, market research, relationship and information sharing. As a result, a survey consisted of 25 questions, 9 of which were of an open-ended kind. Due to Covid-19 situation still in place, it was decided to send the survey via email. Furthermore, considering that only 5 retailers participated in the survey, to increase the validity of the study it was ensured that each of them was involved within the field of forecasting. Survey was of longitudinal type since information was gathered over time rather than at once. A survey in this case was the best way to accumulate different participants’ opinions that helped determine more general trends and attitudes. As stated by Creswell and Creswell (2018) a survey helps researchers answer “...questions about the relationships between variables” (p.207). The range of questions was covering different topics, such as forecasting strategies applied at retailers’ side or thoughts about information sharing among the other actors. It turned out that visions among retailers vary a lot. Since the furniture industry is a lot dependent on seasons and trends, some questions on retailers’ opinions regarding the role of seasonality and how the inventory is managed during those sales peaks were included as well. This was done to create an open-minded view for retailers by intaking different perspectives and analyzing them holistically. The data collected from the survey was then briefly summarized using Excel and associated statistical tools and illustrated using the pie-charts to present frequency of the answers.
Documentanalysis
Document analysis is a data collection method, which can be defined as “a systematic procedure for reviewing or evaluating documents—both printed and electronic (computer-based and Internet-transmitted) material” (Bowen, 2009). In this study document analysis was used as a complementary method used in combination with other qualitative research methods to gain a deeper understanding of a phenomena, i.e., applied triangulation strategy. In a general sense to elicit significance, obtain comprehension, and acquire scientific knowledge, document analysis necessitates the examination and interpretation of evidence (Corbin & Strauss, 2008). The data produced is organized into main topics and sections and later analyzed.
There are different forms of documents that can be potentially assessed. In this study organizational reports are the document form that was evaluated. “Organizational and institutional documents have been a staple in qualitative research for many years” (Bowen, 2009). Considering that the main problem of this paper is the existing forecasting strategy implemented in the case company, the researchers recognized the need of historical documents representing the previous sales and statistics in order to detect the nature of that problem. As Merriam (1988) stated, “Documents of all types can help the researcher uncover meaning, develop understanding, and discover insights relevant to the research problem” (p. 118). Furthermore, document analysis is an efficient way of seeking important questions to be implemented in other methods. This is one of the examples of how one method complements another one. Particularly in this study some questions used in the second stage interviews as well as survey arose from investigating historical data. From the researchers’ perspective document analysis was the most time-efficient method that didn’t require transcribing. Moreover, regarding the main area of investigation in this case study forecasting itself is a process based on historical insights, so by conducting document analysis once changes suggested by the researchers are applied by the case company, it becomes easy to compare and see whether those changes are successfully implemented. The information gathered from documents was then structured and set in the chosen model so that the potential forecasting model gets tested, analyzed and conclusions can be drawn.
However, there is a limitation inherent in document analysis and that is the insufficient details meaning that since documents are originally created for other than research reasons, the data collected doesn’t provide enough evidence answering research questions. This is another reason why a combination of methods complementing each other was implemented.
2.6 Reliability and validity of the research
Reliability
To begin with, According to Bill and Waters (2018), “Reliability is the extent to which a test or procedure produces similar results under constant conditions on all occasions” (p.148). In other words, it is an essential task for the researchers to ensure that the executed research can be repeated leading to the same results. In this study many methods were used including some that might be considered unreliable. For instance, interviews and surveys which are ambiguous by nature. Results differ since participants are affected by many internal and external factors. Each person has an opinion, a different level of knowledge etc. To make the results more reliable the researchers when creating a survey, put a significant effort into selecting the participants (retailers within the furniture industry) and choosing the major ones that have a standardized organizational structure and can be generalized. Additionally, the literature sources chosen and reviewed in this study were selected carefully for the reliability reasons as well. The analyzed literature was only taken from legit databases providing scholar journals. The aim of reliability is to reduce research inaccuracy (Yin, 2018, p. 82). To achieve that, all the procedures executed in this case study were documented so the same research could potentially be repeated with a high level of precision.
Validity
Validity is basically “...whether the research methods lead to data that supports the conclusions the researcher draws from it” (Bell & Waters, 2014, p.149). Even though validity in a way requires a high level of reliability, not every reliable item is valid at the
same time. When conducting this study, the researchers were always checking with supervisors and analyzing different sources whether what is to be measured is done using the right methods and approach. In order to ensure that methods used are measuring what is supposed to be measured, it was important to fully understand what the convergent design is based on in terms of validity. The main part is a construct validity which is related to the quantitative side of the token and the triangulation which is related to the qualitative side of the token.
Construct validity and triangulation are similar terms that are based on each other. Basically, “by developing convergent evidence, data triangulation helps to strengthen the construct validity of your case study. The multiple sources of evidence essentially provide multiple measures of the same phenomenon” (Yin, 2018, p. 173). In other words, triangulation is a principle that helps strengthen the credibility of a research.
“A major strength of the mixed methods approach is triangulation – approaching aspects of a topic from different perspectives by using a range of methods and techniques in order to come to a better understanding of it” (Bell & Waters, 2014, p.38). There are several types of triangulations. In order to increase the validity of this study both data and method triangulations were used. Data triangulation included conducting interviews, document analysis and questionnaire to gather information related to the same topic from various sources. “By seeing the same thing from different perspectives, the researcher confirms or challenges the findings of one method with those of another” (Bell & Waters, 2014, p. 148). Considering method triangulation, different methods from both qualitative and quantitative approaches were applied, so that they could complement each other and in combination provide both researchers and readers with a deep and trustworthy understanding of phenomena.
3
Theoretical background
This chapter provides a theoretical framework creating a foundation for answering the research questions. Existing literature, including scientific articles, books, were included to present theories associated with the area of investigation.
3.1 Forecasting within organizations
To begin the chapter, it is important for the reader to understand what forecasting is and what it is not. Many companies still consider that forecasting is the same as planning and an exercise in setting goals, which it is not. Forecasting is a management process that needs to be managed like any other management process as being carefully organized with the attention directed towards the people, processes and the tools constituting forecast management (Moon, 2013). However, forecasting still needs to be integrated with a company's long-term planning and strategy to increase the ability to anticipate upcoming changes and their consequences as well as the opportunities (Makridakis, 1996). Whereas effective demand planning can contribute to ensuring the appropriate level of inventory level during the demand peaks and dips which in the end results in meeting customer expectations, remaining competitive and improving profitability for the specific product or channel (Walters et al., 2019). Furthermore, the capabilities of the supply chain are matched with the requirements of the customer where the downstream processes such as procurement, manufacturing capacity planning, inventory management and transportation planning have a direct impact on the customer and overall organizational performance
(Walters et al., 2019). For this reason, the flow and interpretation of information play an
important part in the development and planning of demand forecasts impacting the organization's overall performance (Vriens & Versteijnen 2006:9). Therefore, to identify the forecast limitations, a company can improve its understanding and interpretations of a forecast’s results (Stancu et al., 2015). “The reason that forecasting is so important is that prediction of future events is a critical input into many types of planning and decision-making processes, with application to areas such as the following: Operations management, marketing, finance and risk management, economics and politics, industrial process control, and demography” (Montgomery et al., 2016, p 3).
3.2 Seasonality
Seasonality represents the repeating pattern of demand increases or decreases and the seasonal demand exhibits significant fluctuations during the peak demand season (Rahman et al., 2011). Seasonality occurs within a single year cyclicality which means over longer than a single year and therefore becomes an important matter for companies (Moon, 2013). Seasonal demand can be explained as the increase regarding sales of light clothing during the summer as well as golf balls (Thomopoulos, N. 2015). Moreover, there are several methods, techniques, and models to handle seasonal demand which depend on the purpose of the company. For example, a quantitative technique is statistical and particularly useful for understanding what has happened in the past whereas a qualitative approach is more appropriate in predicting how the future will be different from the past (Moon, 2013). In the sense of seasonality both these techniques need to be considered and included in a forecast model to have an accurate prediction and meet the demand during the future sales peaks (Ehrenthal et al., 2014).
3.3 Time series
Time series techniques are a category of algorithms that can be used in the case of seasonal demand which are designed to identify the repeated with time patterns in historical
demand. There are three components of historical demand that can be identified by using time series which are seasonality, trend, and noise (Moon, 2013). Seasonality is the single year occurring cyclicality which repeats on a regular basis whereas a trend is the short- and long-term movement of either upward or downward in the value of a variable (Montgomery et al., 2016). Whereas noise represents the random demand fluctuation (Moon, 2013). Also, there are three basic and useful approaches in generating a forecast: regression-based methods, heuristic smoothing methods, and general time series mode (Montgomery et al., 2016). However, this paper will focus on qualitative techniques since they are statistical and particularly useful for understanding what has happened in the past and a qualitative approach to predict how the future will be different from the past (Moon, 2013). Additionally, both approaches are critical to maintain a proper forecast, especially for companies with a seasonal demand (Moon, 2013). Yet, before picking a specific model based on assumptions, a data analysis is an important preparatory step to select the appropriate forecasting model. Moreover, a time series plot of the collected data should be constructed and examined to find detectable patterns, as in trends and seasonal or other cyclical components (Montgomery et al., 2016).
3.4 Forecast process
There is a range of varying factors which can determine the appropriate forecast process. A forecast process depends on the specific business situation and needs to be agreed throughout the organization (Moon, 2013). Since the forecast process is a procedure, it needs a series of connected activities with one or more defined inputs to have one or more successful outputs (Montgomery et al., 2016). Besides, a demand forecast process needs to be hierarchal and central regarding products, time, geographies, channels, and attributes since it isn't a complex set of role-based, time-phased data. Additionally, it needs to consist of a set of many numbers which are connected and analyzed together for the process to be as effective as possible (Chase., 2013). However, depending on the specific definition of the “problem” there are several different approaches in how to establish a forecast process where Moon (2013) highlights most relevant approach. “Process forecasting enables to anticipate which model is best suited for upcoming process executions, accounting for the future states of the operating environment” (Poll et al., 2018).
In this research two basic processes consisting of different activities were chosen in how to select the most appropriate forecast model. Moon (2013) highlighted three overall areas which need to be covered including the difference between the nature of customer base, available data and the specific product or service which is supposed to be forecasted. Furthermore, the nature of the customer base is about investigating the upcoming demand. While in the case of a wholesaler customer could be the retailer and in the case of a retailer it is the end customer. “Approaches for developing loyalty include building a strong brand image, creating a unique positioning in the target market, offering unique merchandise, providing excellent customer service, implementing a customer relationship management program, and building a retail community” (Levy & Weitz, 2008, p 125). However, the challenge in this activity is to understand the nature of the customer. In comparison to, for instance, retail store like Rolex, which simply can ask their customer about their requirements, furniture wholesalers have several retailers where the retailers supply thousands of end-customers. The second activity ‘the nature of available data’ focuses on the historical demand, customer promotion plans, past and future macro environmental trends, and competitor data. Finally, the activity ‘the nature of the products’ highlights the importance of statistical analysis of historical demand and qualitative insight from the sales team. In addition, the nature of products lies in the frequency of new products launching as well as the shelf life of the products (Moon, 2013).
Seven-step process
Montgomery et al., (2016) proposes a seven-step (problem definition, data collection, data analysis, model selection, model validation, forecasting model deployment, and monitoring forecasting model performance) forecasting process to select the appropriate forecast model.
Figure 3-1: The forecasting process (Montgomery et al., 2016)
Problem definition
The first out of the six activities are to define the problem of how the forecast will be used along with the customer whereas customer orientation has a strong effect on the innovation and supplier collaboration (Wang et al., 2016). “The retailer may conduct market research to collect information regarding consumer demand, which can then be used to enhance the consumer demand forecast.” (Huang & Chih-Chiang, 2017) Furthermore, during this step, aspects like forecast horizon, forecast interval, risk and defining the problem are considered. Also, as whether the “problem” is considered being an inventory, manufacturing problem and if multiple products such as product families are included (Montgomery et al., 2016).
Data collection
The second activity is called data collection and it consists of obtaining the relevant historical information and potential predictable variables to conduct a proper forecast. This activity highlights the importance of collecting the relevant information and using the appropriate storage methods since information can change over time. Additionally, it underlines the significance of planning for how the data collection and issues related to storage will be handled in the future to increase the reliability of data (Montgomery et al., 2016). “If members in a supply chain are willing to share their information appropriately, the bullwhip effect can be significantly reduced.” (Huang & Chih-Chiang, 2017)
Data analysis
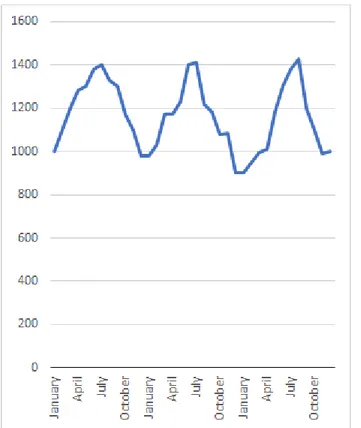
Data analysis is the third crucial activity in finding the appropriate forecast model which encompasses the usage of time series plots to observe recognizable patterns such as trends, seasonality, and cycles. If predictable variables can be recognized, a scatter plot for each variable should be examined (Montgomery et al., 2016). “Trends may change by constant increments rather than constant percentages and seasonal fluctuations may be additive rather than multiplicative” (Holt., 2004). Time series analysis is the identification of patterns that are driven by time through a set of different statistical tools (Moon, 2013). The purpose of this step is to get a sense of the data and realize the strength of the patterns mentioned before through quantitative models. Examples of seasonality during three-year period as well as a straight linear trend are respectively presented in figures 3-2 and 3-3 below. "The purpose of this preliminary data analysis is to obtain some “feel” for the data, and a sense of how strong the underlying patterns such as trend and seasonality are. This information will usually suggest the initial types of quantitative forecasting methods and models to explore.” (Montgomery et al., 2016, p 15)
Figure 3-2: “Seasonality in historical demand” (Moon, 2013)
Figure 3-3:“Trend line” (Moon, 2013) Identifying patterns
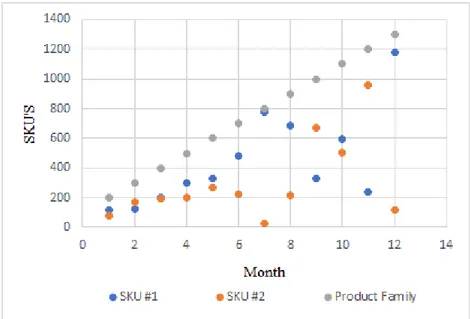
The process of identifying patterns can at first sight be quite difficult since the historical data appears randomly and without any clear correlation as can be viewed in figure 3-2. Figure 3-2 is a scatter plot made from table 3-1 that presents the sales of 2 different SKU’s during a 12-month period. This scatter plot does not give much hope of finding any correlation between these two products (Moon, 2013).
Table 3-1: “SKU’s” (Moon, 2013)
Figure 3-4: “SKU level forecasting example: scatter plot” (Moon, 2013)
By grouping two SKUs into one single-product family a pattern can be identified as in the case of the table 3-2 and figure 3-5 below. Furthermore, now that a clear pattern is found an average percentage can be applied as in identifying how many percent of SKU 1 makes up out of the group family. “For the forecaster who is faced with 10,000 SKUs to forecast, perhaps there are only 1,000 product families still a daunting challenge, but considerably more manageable.” (Moon, 2013, p 179).
Table 3-2: “Example of Product Family Level Forecasting” (Moon, 2013)
Figure 3-5: Product family level forecasting example: scatter plot (Moon, 2013)
Model selection and fitting
Fourth activity, model selection and fitting is choosing the appropriate model based on the data which must fit the estimated model parameters (Montgomery et al., 2016). “Important special cases, known as structural models, that capture common features of time series such as trend and seasonal effects, provide the foundations for simple exponential smoothing, trend corrected exponential smoothing and Holt–Winters’ seasonal exponential smoothing” (Billah et al., 2006).
Model validation
Fifth activity, model validation is a performance evaluation of the chosen model to examine how it has been performing so far in line with its intended purpose. Furthermore, this activity answers questions about how the forecast model performs when the data is “fresh” (updated data) and what forecast errors can be detected when the model is using
the intended data for its purpose. “A common approach to selecting the method appropriate to a particular time series is based on prediction validation on a withheld part of the sample using criteria such as the mean absolute percentage error” (Billah et al., 2006). Forecasting model deployment
Sixth activity, forecasting model deployment is an important but small step which is about ensuring that the customer understands the usage of the forecast model and delivers timely forecasts on a routine basis.
Monitoring forecasting model performance
Last activity, monitoring forecasting model performance is about ensuring how the forecast model is performing day-to-day. By monitoring the performance of the forecast model routinely through control charts errors can be easily detected. It can be done in a range of diverse ways where Billah et al., (2006) mentions that “simulation study was conducted to determine whether any of the approaches to model selection displayed a superior performance as measured in terms of forecast accuracy instead of the more usual criteria of the proportion of correctly selected models.”
3.5 Constructed forecast process
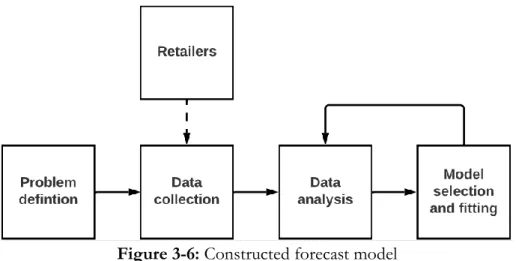
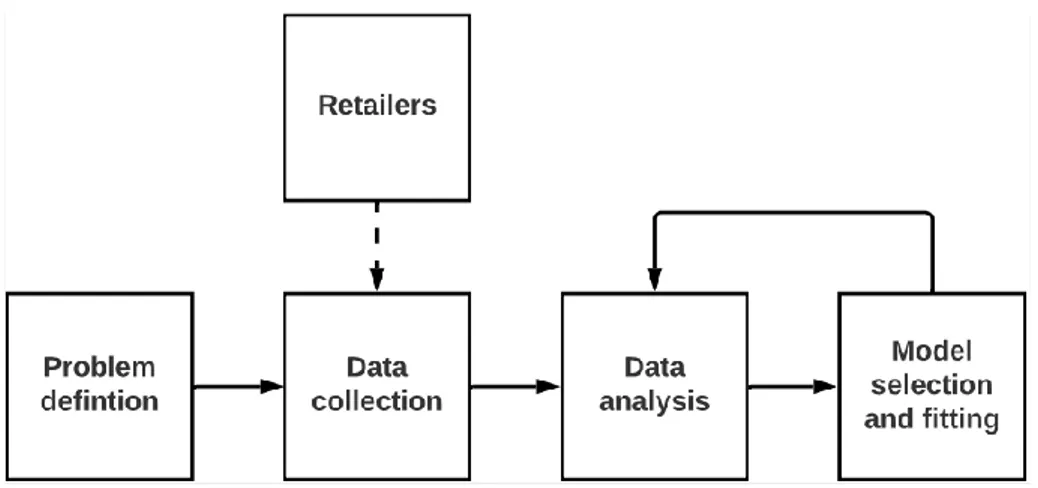
The seven-step process presented in the theoretical framework includes steps such as model validation, forecasting model deployment, and monitoring forecasting model performance. Due to the scope and the time frame of this research those three steps will be excluded to focus on implementing the appropriate model according to the business. For this reason, the authors have established a process which can fulfill these specific targets. Furthermore, since the researchers consider the information from the retailers as an important activity of obtaining accurate data for the model, it will therefore be included in the process. The process is presented in the figure below:
Figure 3-6: Constructed forecast model
There is a range of various forecast models whereas some of them are arranged according to their expected outcome and each model needs its process to meet the intended outcome. “Just selecting the method that has the best fit to the time series may result in selecting a method that overfits the data incorporating random fluctuations that do not repeat themselves” (Rasmussen, 2004). However, according to existing literature, the most effective models to forecast a seasonal demand are exponential smoothing, Holt-Winters model, and ARIMA (Autoregressive Integrated Moving Average).
ARIMA model
When implementing the seasonal model ARIMA it is effortless to add seasonality which is done through adding either an AR term or MA term at a seasonal frequency and producing reliable results in short-term forecasts. “An ARIMA model is made up of two components: a Autoregressive (AR) model and a Moving Average (MA) model. Both rely on previous data to help predict future outcomes. AR and MA models are the building blocks of all our future work in this text.” (Levendis, 2018, p 12) However, the ARIMA model is explained as a typically used model. Up to now, it is recognized as the most complex and advanced within time series. However, since emphasis will be on promoting simplicity, the research will therefore focus on the Holt-Winters method which will be explained further in the paragraph below (Levendis, 2018).
Holt-Winters Model
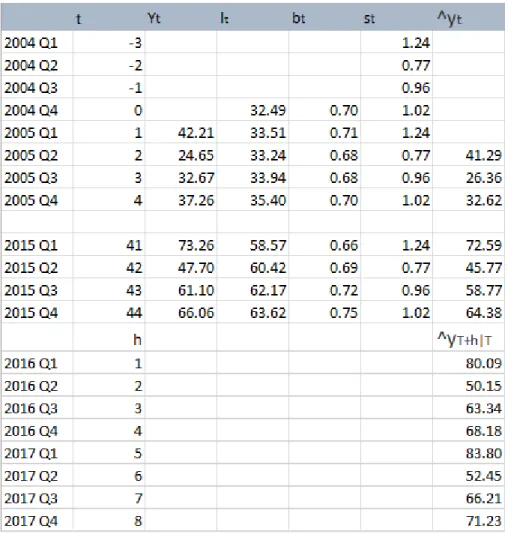
The Holt-Winters is an accepted and favored method regarding demand forecasting among the vast majority, due to the methods’ advantage of being simple and easy to understand and cheap to deploy (Chase, 2013). The Holt-Winters model which was brought forward by Holt (1957) and Winters (1960) is an exponential smoothing model with three parameters (Hyndman & Athanasopoulos, 2018). Furthermore, the Holt-Winters method can clearly be explained as a method that captures seasonality through three different smoothing equations mentioned below:
● ℓt (level) ● bt (trend) ● St (seasonality)
The complementing smoothing parameters are: ● α (alpha)
● β (beta) ● γ (gamma)
(Hyndman & Athanasopoulos, 2018)
Depending on the period in which the model should be calculating the seasonality there is an additional variable:
● m (frequency)
(Hyndman & Athanasopoulos, 2018).
The letter (α) can be thought of as a way to apply less or more weight on recent observations e.g., when (α) is set to 0.1, the weight on recent observations will be small, while 0.9 has extra weight attached to the recent observations. If the beta (β) value would decrease the data with an up- and downward trend indicates a small error value if the beta value would get higher (Moon, 2013) “The matching alpha value ranges from 0.7 to 0.9, while the beta value is better if it approaches 0.9” (Syaharuddin et al., 2019).
In the Holt-Winters model there are four different formulas which can be calculated based on one specific company's previous demand or sale. However, the different smoothing components need to be calculated in advance before the actual equation. The final equations within the Holt-Winters method which can be named as “components” are:
● ℓt
● bt
● Ft
Since all data has its first year of calculation a seasonal index is required to be initiated. However, the seasonal index for each month is calculated through taking the specific
month and dividing by the average of each month for the entire year (Tierney Jr et al., 1999).
𝑆
𝑡=
𝑌
1𝑎𝑣𝑒𝑟𝑎𝑔𝑒(𝑌
1, 𝑌
2, 𝑌
3, … 𝑌
12)
Equation 3-1: Seasonal index equation
The second smoothing equation, level is calculated through alpha multiplied with the actual sales at the current time step γt, plus 1 minus alpha multiplied with previous level ℓt and the previous trend bt. This equation is calculated to eliminate any lag and bring back the linear trend to its level of the current data (Chase., 2013). Furthermore, the level smoothing equation (equation 3-2) can be translated into the equation presented in figure 3-3.
𝐿
𝑡= 𝛼𝑌
𝑡+ (1 − 𝛼)(𝐿
𝑡−1+ 𝑏
𝑡−1)
Equation 3-2: Level smoothing equation.
ℓ
𝑡=
𝑌
13𝑆
1Figure 3-3: Level smoothing equation.
The third smoothing equation is the trend which is calculated using the smoothing parameter beta β. The Smoothing parameter beta is multiplied with the current level of data minus the previous level of data, plus 1 minus beta multiplied with the previous trend. This calculation is made in order to update the trend, which is according to Chase (2013) the difference between the two previously smoothed values and are useful when there is a trend in the data where the new values will be either higher or lower than before. Finally, the equation can be represented as
𝑏
𝑡= 𝛽(𝐿
𝑡− 𝐿
𝑡−1) + (1 − 𝛽)𝑏
𝑡−1Equation 3-4: Trend smoothing equation.
The first Holt-Winters method equation is calculating the seasonal factor. The equation starts with multiplying gamma by actual sales depending on the horizon and dividing by the level component plus 1 minus gamma multiplicated the seasonal component of the actual month from the previous year. “Seasonal variation is a component of a time series, which is defined as the repetitive and predictable movement around the trend line in one year or less” (Chase., 2013, p 152).
𝑆
𝑡= 𝛾
𝑌𝑡𝐿𝑡
+(1-
𝛾)𝑆
𝑡−𝑀Equation 3-5: Seasonal factor equation
The part of the Holt-Winters model is calculating the factor equations. To begin with the level equation can be calculated which sometimes can be mentioned as the slope. Furthermore, the level equation is calculated through the alpha factor multiplied by the sales from the actual month divided by the seasonal component from the same month the