DEVELOPMENT OF SURROGATE MEASURES FOR CRASH-BASED
SAFETY ESTIMATION
Bhagwant Persaud
Ryerson University, Department of Civil Engineering 350 Victoria Street, Toronto, Canada M5B2K3
bpersaud@ryerson.ca Taha Saleem
Ryerson University, Department of Civil Engineering Yongsheng Chen
Ryerson University, Department of Civil Engineering
ABSTRACT
The paper investigates the validity of promising surrogate measures by investigating the link between such measures and safety. Such measures, if shown to be valid, can be used in two ways: a) to evaluate a newly implemented measure for which data can be quickly assembled to estimate the effect on the safety surrogate and, by implication, the effect on expected crashes, and b) to estimate the safety effects of a proposed change by first estimating the effect on the safety surrogate and then relating that outcome to the expected change in crashes. The idea is not new. In fact, several researchers have been working on various complementary pieces of the puzzle. The key missing link is in developing measures that can in fact be linked explicitly to safety as manifested in expected numbers of crashes. In addressing this void, two complementary sets of models are explored – models to relate surrogate measures to design features and models to relate crashes to surrogate measures. The first set successfully modeled simulated conflicts for urban signalized intersections estimated from micro-simulation software, complementing the models for measured and predicted speeds for roundabouts that have been developed in our recently published research. Models relating these surrogate measures to observed crashes suggest that there is promise in the approach of using certain surrogate measures for crash-based safety estimation.
1 MOTIVATION
In late 2008, a workshop titled “Future Directions in Highway Crash Data Modeling” brought together selected, prominent safety researchers to explore promising directions in crash data modeling and to develop a program of advanced safety research that provides a theoretic foundation for explaining crash causation. Goals of the research program recommended at the workshop (Future Directions Subcommittee, 2009) are to promote the further development of science-based safety evaluation and to facilitate the development of more stable, reliable, and transferrable highway safety predictive models. The call was issued for the development of new methods, and the refinement of existing methods for either quantifying the safety of a facility, or estimating the relationship between a change in facility condition and a change in facility safety. Promising emerging approaches suggested include the application of surrogate driver
performance measures where there are insufficient data for crash based evaluations. There has been substantial research of late on this subject, but establishing a strong relationship between safety surrogates and crashes has, by and large eluded researchers, as is the defining and developing of surrogates that can be related to crashes, and so more research appears needed on the application of this approach to safety estimation. This paper seeks to contribute to that need by presenting two complementary modeling approaches – models to relate surrogate measures to design features and models to relate crashes to surrogate measures.
2 SUMMARY OF OUR EARLIER WORK
Two of our recent papers (Chen et al., 2011, 2013) have demonstrated the rudiments and viability of the approach to crash prediction from surrogate measures. For these papers, preliminary exploration was done for roundabouts, for which conventional wisdom is that safety is related to the speed reduction and consistency that could be achieved through design. The premise is that if safety performance can be related to speed, and speed can be better estimated from traffic and geometric variables than crash experience, then speed can be used indirectly as a surrogate in evaluating the safety implications of decisions in designing or re-designing a roundabout. Speed measures were related in that research to basic geometric features and crashes were then related to speed – both observed and predicted, using sample data for US roundabouts. The speed-based model with the most appropriate speed measure -- inside average speed (IAS), defined as the average of entry, circulating and exiting speeds of an approach for approach-level models or the average of all approach IAS values for roundabout-level models – was seen to be better than the non speed-based models at predicting crashes. Given the strong relationship between speed and crash experience, the research further explored models for predicting roundabout speed as a function of design features, with a view to using speed estimated from these models, along speed-based crash prediction models, to assess roundabout safety performance. With this approach, speed is in effect used as a surrogate safety measure.
To use the speed measure (IAS) as a surrogate safety measure required that it be possible to predict speed from roundabout design features, and that such models be more sensitive to design changes than models that directly estimate safety. To explore this possibility, the same database used to establish the crash prediction models was used to investigate the relationship between
IAS and geometric variables. The recommended model was (Chen et al., 2011):
IAS (mph) (for an approach) = 9.927 + 0.0341·DAV + 0.1429·WAV 1)
where, DAV is the average of the inscribed circle and central island diameter; and WAV is the average of entry, circulating and exit width, all dimensions in feet.
The approach level crash model related to IAS, and based on measured speeds, was as follows (Chen et al., 2011):
(Total Crashes)/year = 0.00000275∙(total entering AADT)0.8075∙exp(0.3388∙IAS) 2)
with a valid AADT range from 8,000 to 36,000 and a valid IAS range from 10-30 mph (16-48 km/h). The model is for all crash severities combined.
Subsequent research used Equation 1 to estimate IAS for a larger sample of roundabouts and used the larger sample to relate crashes to the predicted IAS values. That model, which was for crashes at the approach level, is as follows (Chen et al. 2013):
(Total Crashes)/year = 0.0000000773∙(total entering AADT)0.5094∙(IAS) 4.3314 3) The earlier research demonstrated that it is viable to use speed as a surrogate measure in estimating the safety implications of decisions in designing a roundabout. Given these promising results, it seemed worthwhile to expand the exploration to a more commonly used surrogate measure – conflicts. That has been the subject of considerable research but the jury remains out as to whether it is a valid measure for estimating crashes. The remainder of this paper is focused on more recent research (Saleem, 2012) aimed at establishing conflicts as a valid surrogate measure for crash based safety estimation.
3 SURROGATE MEASURES FROM SIMULATION MODELS --
CONFLICTS AT SIGNALIZED INTERSECTIONS
The basic idea is to use simulation models to estimate a surrogate measure for a site and to predict crashes as a function of the surrogate measure. In this investigation, the VISSIM micro-simulation model (PTV Vision, 2012) was used in conjunction with the Surrogate Safety Assessment Model (SSAM) (Gettman, 2008) to estimate peak hour conflicts at 113 four-legged signalized intersections in Toronto, given information on traffic flows and geometry. These measures were, in turn, related to crashes using state-of-the-art modeling techniques. The idea is that the simulation models can then be used as a tool to explore the effects on safety of various operational and safety measures. The fundamental assumption, which is tested in the research, is that the outputs of the simulation models can be related to system changes, and that ultimately, estimating crashes from these outputs can be accomplished.
3.1 Estimation of conflicts
Model calibration parameters from the Wiedemann 99 car-following model for right-side motorized rule traffic behaviour were used (Menneni et al, 2008). These calibrated values are pre-set in VISSIM as one of the default models that can be chosen. A study conducted by Cunto and Saccomanno (2008) found that, among the available variables in the Wiedemann 99 model, three are the most sensitive and are the best representation of traffic operation at signalized intersections. These parameters are Desired Deceleration (calibrated value of 2.8m/s2), CCO
(Standstill Distance), which is the desired distance between two stopped cars, with a calibrated
value of 1.5m, and CC1 (Headway Time), which is the desired time the following vehicle driver should keep behind the leading vehicle, with a calibrated value of 0.90 sec.
For each intersection, simulations were run for the whole peak hour. In order to capture the randomness in traffic, 10 simulation runs with 10 random seeds were conducted. The procedure in VISSIM allows for selection of a random starting seed and then incrementing that by a pre-defined value. In this case, the starting random seed was incremented by the value of 10 for the subsequent runs.
VISSIM was used to produce trajectories for each simulation run to be analyzed in SSAM for estimating conflicts. SSAM classifies conflicts into five main categories: Rear End; Lane Change; Crossing; Unclassified; and Total.
Once the conflict analysis was completed, the conflicts were filtered to remove those more than 50 m from the intersection because this was the radius used to define intersection crashes
used in the modeling. Pedestrian-pedestrian conflicts and the vehicle-pedestrian conflicts were also filtered out since only vehicle-vehicle crashes were being modeled. SSAM does not identify pedestrian conflicts separately, but according to the SSAM release notes, filtering out conflicts with speeds of less than 5 mph or 7.3 ft. /sec would basically get rid of all the pedestrian conflicts. This is because 5 mph is over the natural walking pace of pedestrians.
3.2 Conflict Estimation Results
The VISSIM trajectories were exported to SSAM where they were analyzed for identifying conflicts. Table 1 summarizes the AADTs and estimated conflicts for the 113 intersections.
Table 1: AADTs and Estimated Conflicts for Signalized Intersection Sample
80 Sites with Turn Lanes 33 Sites without Turn Lanes
Mean Minimum Maximum Mean Minimum Maximum
Total Conflicts 148.3 14 448 117.0 10 262
Crossing Conflicts 9.6 1 48 7.7 0 28
Rear End Conflicts 128.4 6 416 102.6 7 242
Lane Change Conflicts 10.2 1 37 6.8 1 24
MAJOR AADT 13453 5061 21937 10769 5048 23807
MINOR AADT 6481 78 15572 6383 3954 11020
3.3 Model Fitting and Evaluation
This section is divided into two parts. The first part summarizes the different models developed to estimate crashes from conflicts. The second part investigates the use of the crash-conflict models for estimating the potential effects of providing protected-permissive left turn phasing at a sample of intersections (chosen from the 113 intersections used in this study) that previously had left turn lanes and for which the volumes and the level of service (LOS) for left turn movements may justify protected-permissive left turn control.
3.3.1 Crash – Conflict Prediction Models
Consistent with state-of-the-art methods, generalized linear modeling, with the specification of a negative binomial (NB) error structure, was used to develop the Crash Prediction Models. The model form used for developing the models with peak hour conflicts and the peak hour traffic ratio as the explanatory variables was as follows:
𝐶𝑟𝑎𝑠ℎ𝑒𝑠/𝑦𝑒𝑎𝑟 = 𝑒𝛼× 𝐶𝑜𝑛𝑓𝑙𝑖𝑐𝑡𝑠𝛽1× 𝑃𝑒𝑎𝑘 𝐻𝑜𝑢𝑟 𝑅𝑎𝑡𝑖𝑜𝛽2
where, Peak Hour Ratio = Ratio of Peak Hour Traffic Volume to the Average Daily Traffic Volume.
Table 2 shows the coefficient estimates and the dispersion parameter for models distinguished by their specific crash – conflict types. Table 3 shows the crash predictions from the peak hour conflict based model for intersections grouped by different ranges of entering AADT.
Table 2: Coefficient Estimates and Dispersion Parameters for Conflict Models
Crash - Conflict
Coefficient Estimate Pr > ChiSq Estimate Pr > ChiSq Estimate Pr > ChiSq Estimate Pr > ChiSq α -0.9722 0.2771 1.0620 0.1047 -0.6492 0.4536 1.0071 0.1437
β1 0.3461 <0.0001 0.2741 <0.0001 0.3065 <0.0001 0.2450 0.0003
β2 -1.0775 0.0023 -0.5788 0.0730 -1.0334 0.0035 -0.6489 0.0520
K Crash - Conflict
Coefficient Estimate Pr > ChiSq Estimate Pr > ChiSq Estimate Pr > ChiSq Estimate Pr > ChiSq α -1.7527 0.0543 -0.0934 0.8837 -1.4876 0.0910 -0.2630 0.7012
β1 0.3030 <0.0001 0.3043 <0.0001 0.2720 0.0001 0.2402 0.0003
β2 -0.8498 0.0164 -0.4059 0.1939 -0.8117 0.0217 -0.5746 0.0823
K Crash - Conflict
Coefficient Estimate Pr > ChiSq Estimate Pr > ChiSq Estimate Pr > ChiSq Estimate Pr > ChiSq α -1.4144 0.1346 0.7333 0.2928 -1.0782 0.2391 0.7129 0.3288
β1 0.3593 <0.0001 0.2655 <0.0001 0.3170 <0.0001 0.2451 0.0008
β2 -1.1303 0.0025 -0.6148 0.0742 -1.0871 0.0038 -0.6574 0.0635
K Crash - Conflict
Coefficient Estimate Pr > ChiSq Estimate Pr > ChiSq Estimate Pr > ChiSq Estimate Pr > ChiSq α -0.8015 0.2791 -1.2676 0.2341 -1.6218 0.1494 -0.7851 0.3321 β1 0.2549 0.0020 0.3423 <0.0001 0.2608 0.0159 0.3158 0.0009 β2 -0.7117 0.0485 -0.6609 0.1264 -1.0133 0.0639 -0.5477 0.1643
K
Angle - Crossing Rear End - Rear End Side Swipe - Lane Change Turning - Crossing
0.274 0.336 0.550 0.349
PDO - Total PDO - Crossing PDO - Rear End PDO - Lane Change
0.262 0.282 0.266 0.285
Injury - Total Injury - Crossing Injury - Rear End Injury - Lane Change
0.201 0.198 0.203 0.207
Total - Total Total - Crossing Total - Rear End Total - Lane Change
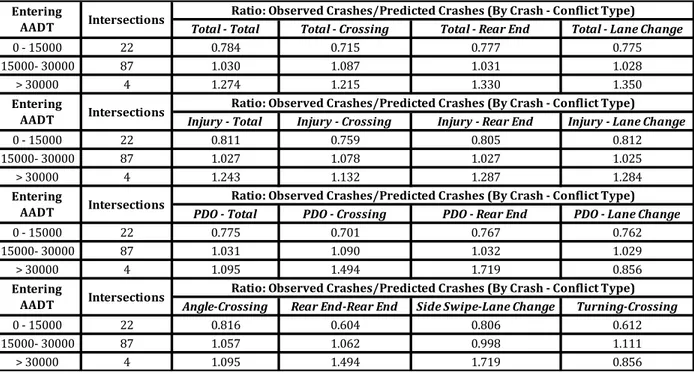
Table 3: Comparison of Observed and Predicted Crashes Grouped by Total Entering AADT (Predicted by the Conflict Based Model)
As can be seen from Table 3, the crash predictions from the conflict based models for sites grouped by different ranges of total entering AADT show a variable trend. The model predicts crashes very well for entering AADTs between 15000 and 30000 with the ratio of observed to predicted crashes being approximately 1. For entering AADTs lower than 15000, the model is over-predicting crashes by roughly 20% in most cases, whereas, for entering AADT’s higher than 30000, the model is under-predicting crashes substantially. This is likely due to the small number of sites, 22 and 7 respectively, in these ranges, compared to 87 sites for entering AADTs between 15000 and 30000.
Table 4 compares the observed crashes and crashes predicted by the model from total entering AADT and peak hour conflicts. The comparison is grouped by various combinations of number of intersection approaches with left and/or right turn lanes. As is evident, the ratio of observed to predicted crashes is oscillating around, and reasonable close to 1, with little or no bias. This shows that the estimated conflicts and the crash-conflict models appear to be capturing the effect of the number of turn lanes on crashes reasonably well.
Total - Total Total - Crossing Total - Rear End Total - Lane Change
0 - 15000 22 0.784 0.715 0.777 0.775 15000- 30000 87 1.030 1.087 1.031 1.028 > 30000 4 1.274 1.215 1.330 1.350
Injury - Total Injury - Crossing Injury - Rear End Injury - Lane Change
0 - 15000 22 0.811 0.759 0.805 0.812 15000- 30000 87 1.027 1.078 1.027 1.025 > 30000 4 1.243 1.132 1.287 1.284
PDO - Total PDO - Crossing PDO - Rear End PDO - Lane Change
0 - 15000 22 0.775 0.701 0.767 0.762 15000- 30000 87 1.031 1.090 1.032 1.029 > 30000 4 1.095 1.494 1.719 0.856
Angle-Crossing Rear End-Rear End Side Swipe-Lane Change Turning-Crossing
0 - 15000 22 0.816 0.604 0.806 0.612 15000- 30000 87 1.057 1.062 0.998 1.111 > 30000 4 1.095 1.494 1.719 0.856
Entering
AADT Intersections Ratio: Observed Crashes/Predicted Crashes (By Crash - Conflict Type)
Entering
AADT Intersections Ratio: Observed Crashes/Predicted Crashes (By Crash - Conflict Type) Entering
AADT Intersections Ratio: Observed Crashes/Predicted Crashes (By Crash - Conflict Type)
Entering
Table 4: Comparison of Observed and Predicted Crashes from Crash-Conflict Model vs. Grouped Number of Turn Lanes
Number of approaches with
Intersect-ions
Ratio: Observed Crashes/Predicted Crashes Right Turn Lanes Left Turn Lanes
Total Injury PDO Angle Rear End Side Swipe Turning
0 0 33 1.131 1.093 1.144 1.307 0.974 1.262 0.964 1 or 2 0 7 1.319 1.074 1.399 1.037 1.512 2.023 0.990 1 to 4 1 10 0.815 0.719 0.847 0.420 0.965 1.050 0.700 1 to 4 2 27 0.800 0.848 0.783 0.786 0.750 0.855 0.871 1 to 4 3 5 0.837 0.874 0.824 1.078 1.062 0.522 0.605 1 to 4 4 31 1.049 1.126 1.025 1.095 1.142 0.684 1.310
3.3.2 Using Conflicts to Estimate the Effects on Crashes of Changing Left Turn Phase from Permissive to Protected-Permissive
This part of the analysis aims at exploring whether the conflict-crash models can reasonably estimate the effects of providing left turn movement protection at signalized intersections. The conflict type of interest for this exploration is the crossing conflicts. This analysis estimates how the numbers of crossing conflicts and its pertinent crash types (angle and turning) will change if the left turn phasing at some intersections in the sample were to be changed from permissive to protected-permissive. Effects of this treatment on other conflict and crash types are examined. The estimated effects are then be compared to those estimated in a crash-based before-after study conducted by Srinivasan et al. (2012) for a group of similar Toronto intersections that actually underwent a change from permissive to protected-permissive left turn phasing.
The criteria used for selecting intersections for applying the hypothetical treatments was that the intersections should have at least one approach with an exclusive left turn lane, and that the level of service (LOS) and traffic volumes would permit the installation of a protected-permissive signal. A total of 20 of the 113 intersections used for the modeling were selected for the hypothetical treatment. The LOS for the left turning traffic at these 20 intersections was C or worse, and the left turning traffic volume was more than 50 vehicles per hour. Of the 20 intersections, 1 approach was treated at 1 intersection, 2 approaches were treated at 7 intersections, 3 approaches were treated at 3 intersections, and 4 approaches were treated at 9 intersections. Signal timings (including the protected-permissive left turns) were optimized using the SYNCHRO software package (Trafficware, 2012) and the traffic was then simulated in VISSIM.
Table 5 shows a summary of the number of peak hour conflicts at the 20 sites before and after the hypothetical treatment was applied.
Table 5: Mean Conflict Estimation Statistics (Before & After Treatment)
Before Period After Period % Change
Total 163.505 99.88 -38.91%
Crossing 9.815 4.75 -51.60%
Rear End 143.355 88.42 -38.32%
Lane Change 10.335 6.71 -35.07%
Table 6 provides crash predictions from the crash-conflict models. The table also shows the percentage of each crash type with respect to the total predicted crashes.
Table 6: Crash Predictions Before and After the Hypothetical Treatment was Applied
Crash Type
Before Treatment After Treatment
% Change % change from Srinivasan et al. (2012) (standard error) Predicted Crashes % of Total Predicted Crashes % of Total Total 1646.6 100 1368.3 100 -16.9 3.30 (2.3) Angle 304.8 18.5 250.7 18.3 -17.8 -14.20 (5.6) Rear End 519.4 31.5 433.2 31.7 -16.6 6.30 (3.8)
Side Swipe 240.2 14.6 203.4 14.9 -15.3 n/a
Turning 259.9 15.8 204.2 14.9 -21.4 n/a
The results indicate that the treatment would be beneficial in reducing the number of angle and turning crashes (the target crash types). As the last column in Table 6 shows, these results are reasonably similar to those from an empirical Bayes before-after study conducted by Srinivasan et al. (2012) for 55 intersections in the City of Toronto for which the left turn phasing was changed from permissive to protected-permissive. As can be seen, the sum of target crashes (Angle + Turning) reduced by about 19% which is comparable to the reduction achieved by Srinivasan et al. (2012) of about 14% with an error of about 5%. The study by Srinivasan et al. (2012) found statistically insignificant increases in total and rear end crashes, whereas the results of the conflict-based analysis show a decrease in both of them of about 16%. This may be because the samples for the two analyses are different.
4 SUMMARY AND CONCLUSIONS
The paper investigated the validity of promising surrogate measures by investigating the link between these measures and safety. These measures can be used in two ways: a) to evaluate a newly implemented measure for which data can be quickly assembled to estimate the effect on the safety surrogate and, by implication, the effect on expected crashes, and b) to estimate the safety effects of a proposed change by first estimating the effect on the safety surrogate and then relating that outcome to the expected change in crashes, an application that was successfully
tested in the research documented in the last part of the paper. In that research, simulated conflicts for urban signalized intersections estimated from micro-simulation software were linked to crashes through reasonably robust models, complementing our earlier research in which models for measured and predicted speeds for roundabouts were developed along with models relating these surrogate measures to observed crashes.
Although the findings of this inquiry cannot be generalized, the combined results of the entire line of research to date suggest that there is promise in using surrogate measures for crash-based safety estimation and that researchers should continue to pursue this approach.
5 ACKNOWLEDGMENT
The data for the study were provided by the City of Toronto. This assistance is gratefully acknowledged as is the financial support provided by a Discovery Grant from the Natural Sciences and Engineering Research Council of Canada.
REFERENCES
Chen, Y., Persaud, B. and C. Lyon. “Effect of Speed on Roundabout Safety Performance: Implications for Use of Speed as Surrogate Measure”. Transportation Research Board 2011 Annual Meeting CDROM.
Chen, Y., Persaud, B., Saachi, E. and M. Bassani. Investigation of models to relate roundabout safety to predicted speed. Accident Analysis & Prevention 50, pp. 196–203, January 2013. Cunto, F. and F. Saccomanno. “Calibration and Validation of Simulated Vehicle Safety Performance at Signalized Intersections.” Accident Analysis and Prevention: 40, pp. 1171-1179, 2008.
Future Directions Subcommittee, Task Force for Development of a Highway Safety Manual,
Theory, explanation, and prediction in road safety. Transportation Research Board, Washington,
2009.
Gettman, D., Pu, L., Sayed, T., and S. Shelby. Surrogate Safety Assessment Model and Validation: Final Report. Publication FHWA-HRT-08-051. FHWA, U.S. Department of Transportation, 2008.
Menneni, S., Vortisch, P., and Sun, C.(2008). An Integrated Microscopic and Macroscopic
Calibration for Psycho-Physical Car Following Models. PTV America, 2008. Available
at: http://www.ptvamerica.com/fileadmin/files_ptvamerica.com/An_Integrated_Microscopic_and _Macroscopic_Calibration_for_Psycho-Physical_Car_Following_Models.pdf
PTV Vision (2012). VISSIM 5.40: Overview. Available Online at: http://www.ptvamerica.com/software/ptv-vision/vissim/
Saleem, T. Evaluation of the Predictive Capabilities of Simulated Peak Hour Conflict Based Crash Prediction Models. Master of Applied Science Thesis, Ryerson University, 2012.
Srinivasan, R., Lyon, C., Persaud, B., Baek, J., Gross, F., Smith, S., and Sundstorm, C., (2012).
Crash Modification Factors for Changing Left Turn Phasing. TRB 2012 Paper No. 12-2521,
TRB 2012 Annual Meeting CDROM (In Press, Transportation Research Record). Trafficware (2012). SYNCHRO 8: Overview.