https://doi.org/10.1007/s10654-020-00695-4
NEW STUDY
The Malmö Offspring Study (MOS): design, methods and first results
Louise Brunkwall1 · Daniel Jönsson1,2 · Ulrika Ericson1 · Sophie Hellstrand1 · Cecilia Kennbäck3 · Gerd Östling1 ·
Amra Jujic1,4 · Olle Melander1,3 · Gunnar Engström1 · Jan Nilsson1,4 · Bodil Ohlsson1,3 · Björn Klinge2 ·
Marju Orho‑Melander1 · Margaretha Persson1,3 · Peter M. Nilsson1,3
Received: 19 November 2019 / Accepted: 7 November 2020 © The Author(s) 2020
Abstract
As cardio metabolic disease manifestations tend to cluster in families there is a need to better understand the underlying mechanisms in order to further develop preventive strategies. In fact, genetic markers used in genetic risk scores, important as they are, will not be able alone to explain these family clusters. Therefore, the search goes on for the so called missing
heritability to better explain these associations. Shared lifestyle and social conditions in families, but also early life
influ-ences may be of importance. Gene-environmental interactions should be explored. In recent years interest has grown for the role of diet-microbiota associations, as microbiota patterns may be shared by family members. In the Malmö Offspring Study that started in 2013, we have so far been able to examine about 4700 subjects (18–71 years) representing children and grandchildren of index subjects from the first generation, examined in the Malmö Diet Cancer Study during 1991 to 1996. This will provide rich data and opportunities to analyse family traits of chronic disease across three generations. We will provide extensive genotyping and phenotyping including cardiovascular and respiratory function, as well as markers of glucose metabolism. In addition, also cognitive function will be assessed. A 4-day online dietary recall will be conducted and gut as well as oral microbiota analysed. The ambition is to provide one of the first large-scale European family studies with individual data across three generations, which could deepen our knowledge about the role of family traits for chronic disease and its underlying mechanisms.
Keywords Cardio metabolic · Diet · Family · Microbiota · Offspring · Vascular
Introduction
The Global Burden of Disease (GBD) project reports non-communicable cardio metabolic conditions and diseases, such as obesity, type 2 diabetes (T2D), and cardiovascular disease (CVD), together with cancer, to continue to increase
world-wide, providing enormous demands on future health-care systems [1]. These conditions have previously been described as diseases of wealth, but today their prevalence is increasing more rapidly than wealth around the world. Therefore, among the greatest challenges of medical sci-ences is to find novel and more effective ways to prevent and treat these diseases. For this purpose, it is important that large population- and family-based cohorts of individuals exposed to present-day environmental factors are collected and investigated.
A positive family history of early onset disease is a strong risk factor for cardio metabolic diseases [2]. Familial influ-ence acts through a combination of genetic and epigenetic factors as well as shared family background, including many environmental influences such as diet, other lifestyle habits, oral-health and psychosocial- and socioeconomic factors. In order to design better strategies for prevention and treat-ment of chronic diseases and their complications, a deeper understanding of relevant family traits is needed. During
Electronic supplementary material The online version of this
article (https ://doi.org/10.1007/s1065 4-020-00695 -4) contains supplementary material, which is available to authorized users. * Peter M. Nilsson
peter.nilsson@med.lu.se
1 Department of Clinical Sciences, Lund University, Malmö,
Sweden
2 Faculty of Dentistry, Malmö University, Malmö, Sweden 3 Department of Internal Medicine, Skane University Hospital,
Jan Waldenströms gata 15, 5th floor, 20502 Malmö, Sweden
4 Department of Cardiology, Skane University Hospital,
the last decade, genome-wide association studies (GWAS) and Mendelian randomization studies have importantly con-tributed to the identification of novel disease mechanisms, causal effects and development of new drug targets [3, 4]. Moreover, studies of the gut microbiota have linked the fae-cal bacterial composition, also a partially heritable trait [5], to numerous chronic diseases including obesity, T2D [6] and CVD. Increasing evidence supports the view that gut microbiota may operate as a key mediator for adverse life-style risk factors such as unhealthy diet [7]. Further, oral health and in particular the severity of periodontitis has been associated with CVD and T2D through chronic low-grade systematic inflammation [8–10], and studies of oral micro-biota open new possibilities to clarify this link. Neverthe-less, despite these important contributions, the heritability of most chronic diseases and traits has remained largely unexplained and cannot solely be attributed to the thus far identified genetic risk factors, as exemplified by T2D [11]. This has been called the missing heritability challenge, and needs to be further explored, preferably in population-based family studies.
Internationally, only few studies have investigated fam-ily health traits across generations, one example being the well-known Framingham Offspring Study (FOS), where the children and grandchildren of index individuals have been invited for repeated screening exams [12, 13]. In most observational studies, the family history is evaluated based on self-reported data from questionnaires. In Sweden, the unique national registers can be utilized to evaluate the more detailed family burden of disease and to longitudinally fol-low-up the morbidity and mortality patterns of population- and family studies, for example the family burden of CVD in the Malmö Preventive Project (MPP) [14].
The Malmö Offspring Study (MOS) was initiated in 2013 and is an ongoing large-scale, family-based cohort study with register-based follow-up by use of the personal identi-fication system in Sweden. MOS participants represent adult children and grandchildren of participants from an earlier cohort study launched in the 1990s, the Malmö Diet and Cancer Study (MDCS). With a mean follow-up of more than 20 years, MDCS provides exceptionally detailed information about the medical aspects of family history of MOS partici-pants as well as lifestyle and dietary information, the latter with exceptional high quality [15, 16].
Aim
The general aim of MOS is to map risk factors of impor-tance for family traits of chronic diseases including genetic-, epigenetic- and circulating biomarkers, gut and oral micro-biota, vascular imaging, family history, medical history, cog-nitive function, diet, other lifestyle factors and social aspects.
Risk factor levels in parents will be linked to adverse risk factors levels, vascular changes, cognitive function, as well as oral health, and prognosis in their offspring. In addition, the national Multi-Generation Register (MGR) will be uti-lized to evaluate the family burden of chronic diseases, based on data not only in parents and offspring but also in siblings and other close relatives. Finally, MOS is aiming to include over 5000 participants, and represents in itself a new cohort for future follow-up studies.
Study design
Source population: index generation 1
The study participants of MOS consists of invited adult children and grandchildren to participants in the Malmö Diet and Cancer Study—Cardiovascular Cohort (MDCS-CC, n = 6103), which is a random, deeply phenotyped sub-population of the Malmö Diet and Cancer Study (MDCS) [17]. MDCS is a large population-based cohort originally designed to investigate the relationship between a diet rich in fat and low in fibre, and several different cancer forms. Baseline examinations were performed between 1991 and 1996 when 28,098 then middle-aged individuals completed the examinations. MDC-CC thus forms generation 1 (G1) in MOS.
Recruitment: offspring generations 2 and 3
Children (G2) and grandchildren (G3) to index individuals in G1 are recruited, using official register information from the Swedish Tax Agency. At the start of the study in 2013, 10,202 individuals were identified as potential participants. Invitations are sent by mail and followed up by phone calls following full ethical approval of the study. All individuals were given written and oral information before signing a detailed informed consent, also covering biobank storing. The informed consent included, for instance, information about biobank storage and genetic analysis. The first 150 par-ticipants were recruited based on that their first-generation index-individual (G1) had an early cardiac event (myocar-dial infarction or stroke, men < 60 years, women < 65 years). These individuals were specially recruited to enable studies on metabolic difference between individuals with a positive family history of cardiovascular events and those without. G2 and G3 individuals are recruited if 18 years or older and living in Malmö or the nearby catchment area. The geo-graphical inclusion criteria were expanded in April 2017 to the region of Skåne, southern Sweden. No exclusion criteria are applied except difficulties in understanding information in Swedish.
Ethical considerations
We obtained ethical approval for MOS from the Regional Ethics committee (REPN) in Lund (Dnr. 2012/594), as linked to the obtained ethical approval for re-examination of the parents (G1) in the MDC Cardiovascular arm cohort 2007–2012 (Dnr. 532/2006) and the original application for the MDC baseline examination (LU-51-90). We have also registered the MOS biobank at the Regional and National Biobank Register, Sweden. In addition, the dental sub-study (MODS) has been approved by the Regional Committee for Radiation Protection at the Skane University Hospital (7th November 2013). Early detection of individuals at high car-dio metabolic risk from risk families is well appreciated by the participants and ethically justified according to our view.
Methods
Clinical assessment
1a. Anthropometrics Participants are examined with
meas-urements of height (cm) with their legs together looking straight ahead, in indoor clothing without shoes and hats. Weight (kg) is measured on a calibrated balance beam or digital scale. To measure hip circumference (cm), the indi-viduals stand erect with arms at the sides, feet together, when the maximum circumference over the buttocks are measured. Waist (cm) is measured midway between the lowest rib margin and the iliac crest. Resting blood pressure (mmHg) and heart rate (beats/min) is measured as a mean of two readings in the supine position after 10 min rest by use of an automatic device (Omron).
1b. Blood samples These are drawn during the first
day visit. In total, nine test tubes are filled with a total of 50 ml. Participants are instructed to be fasting since 10
p.m. the previous day but allowed to drink water. Fasting blood samples are analysed for lipids, glucose and cre-atinine at the Department of Clinical Chemistry, Malmö. In addition, aliquots of blood, serum and plasma, as well as buffy coat from EDTA-blood for DNA extraction, are stored in − 80 °C in a local biobank (BD47), run by the Region Skåne County Council. Later on, the protocol was changed so that also whole blood samples are sent to the Department of Clinical Chemistry and further stored in the biobank, details about the analysis performed the Depart-ment of Clinical Chemistry are described in Supplemen-tary Table S1. We aim to have full genome-wide (GWAS) genetic data on all MOS participants, as is already the case for the first generation (GI) in the MDCS.
1c. Cardiovascular and pulmonary phenotyping For
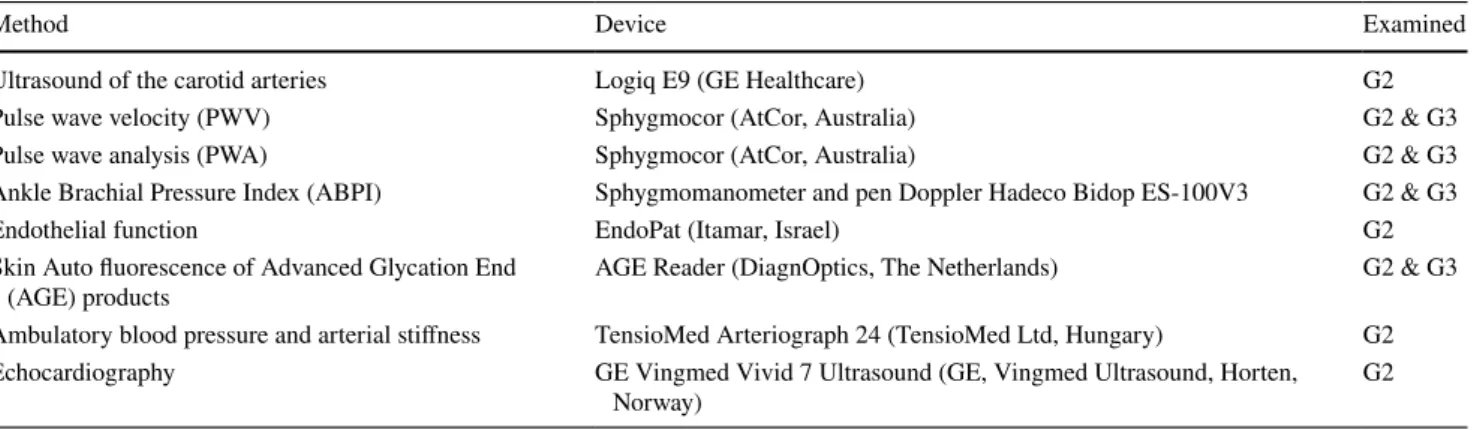
arterial characterization, seven different methods are used (listed in Table 1). These include ultrasound of the arteria
carotis (Logiq E9, GE Healthcare), and the assessment of
arterial stiffness with pulse wave velocity (PWV), as well as pulse wave analysis (PWA), by use of Sphygmocor®
(AtCor, Australia). In addition, we evaluate peripheral fin-ger blood flow by EndoPat® (Itamar, Israel). The
ankle-brachial index is measured by Doppler (Hadeco Bidop ES 100V3). In G2, 24-h ambulatory blood pressure is meas-ured and by indirect methods, also central blood pressure and arterial stiffness are calculated (24-h Arteriograph®).
Cardiac size and function is assessed by performing
echo-cardiography (Vivid 7, GE Healthcare) and 24-h Holter
ECG in a sub-sample of both G2 and G3.
1d. Pulmonary function Pulmonary function is tested
using screening spirometry (Jaeger Masterscope).
1e. Skin autofluorescence Advanced Glycation End
(AGE) products is measured by the AGE Reader®
(Diag-nOptics Technologies, Groningen, Netherlands).
For detailed information about each technical method, see “Appendix 1”.
Table 1 Cardiovascular, hemodynamic and metabolic phenotyping in MOS (for details see “Appendix”)
* G2, generation 2; G3, generation 3
Method Device Examined
Ultrasound of the carotid arteries Logiq E9 (GE Healthcare) G2
Pulse wave velocity (PWV) Sphygmocor (AtCor, Australia) G2 & G3
Pulse wave analysis (PWA) Sphygmocor (AtCor, Australia) G2 & G3
Ankle Brachial Pressure Index (ABPI) Sphygmomanometer and pen Doppler Hadeco Bidop ES-100V3 G2 & G3
Endothelial function EndoPat (Itamar, Israel) G2
Skin Auto fluorescence of Advanced Glycation End
(AGE) products AGE Reader (DiagnOptics, The Netherlands) G2 & G3
Ambulatory blood pressure and arterial stiffness TensioMed Arteriograph 24 (TensioMed Ltd, Hungary) G2
Echocardiography GE Vingmed Vivid 7 Ultrasound (GE, Vingmed Ultrasound, Horten,
Lifestyle
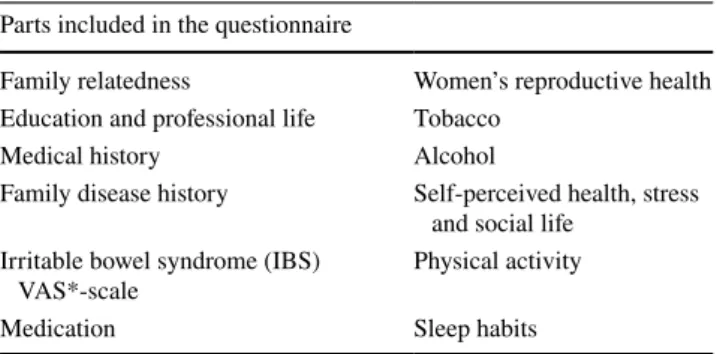
Lifestyle is assessed by an extensive web-based question-naire, the included sub-domains are listed in Table 2.
Cognitive testing
Global cognitive function is assessed with the Montreal
Cognitive Assessment (MoCA) instrument, translated into
Swedish. The MoCA test covers various cognitive domains such as memory, visuospatial ability, executive function, language, and attention [18]. The score ranges from 0 to 30 points, where higher scores denote better cognitive function. The test is widely used and has been demonstrated to detect mild cognitive deficits in older adults with high sensitivity [19]. The MoCA test is performed in G2 only.
In addition, attention is measured by the Symbol Digit
Modalities Test (SDMT), which consists of tasks of simple
substitution where a reference key is given to pair geometric figures with numbers during 90 s. Further, cognitive speed (executive function) is measured by A Quick Test (AQT), a validated and sensitive test for detection of cognitive impair-ment independent of education and gender [20]. The result is measured in seconds, and a shorter time needed to full-fill the task indicates a better performance [21]. These two tests are carried out in both G2 and G3,
Faeces, saliva and urine collection
Faecal samples: Collection is done by the
partici-pants at home, dispersed in four aliquots in plastic tubes (54 × 28 mm, Sarstedt AB, Sweden) and stored in a freezer (− 20 °C) before brought to the clinic and frozen at − 80 °C. Instructions on how to collect the samples are provided via an instruction video during the first visit at the clinic. The aliquots are finally stored in a central biobank at − 80 °C.
Saliva samples: Saliva is collected at the clinic since
October 2014, where the participants are given a chewing
gum to stimulate saliva production. In total, 10 ml saliva is collected and stored at − 80 °C.
Urine samples: Samples are collected by the participants
as over-night urine at home the night before the next (sec-ond) visit to the clinic. Research staff measure the volume that is aliquoted into five test tubes à 200 ml, which are then stored at − 80 °C in the central biobank.
Dietary assessment
To assess dietary intakes and habits, a combination of two methods is used. Firstly, a web-based 4-day food record designed by the Swedish National Food Agency (called
“Riksmaten 2010” in Swedish) is used to capture
abso-lute dietary intake during a four-day observation period. Before the food recording, the participants are tutored via an instruction video (https ://www.youtu be.com/watch ?v=DB3bz D0FJM g) to register everything they eat and drink during four consecutive days, starting the day after their first visit to the clinic, in order to get a representation of all weekdays in the cohort. To help the participants to register as correctly as possible, they are provided with a notebook and a photo book with portion sizes, identical to what are found on the online registration page.
Total energy intake as estimated from the “Riks-maten2010” has been validated with the double labelled water technology (r = 0.40) [22]. Secondly, a Short Food Frequency Questionnaire (SFFQ) is filled in to capture habitual intake of irregularly eaten food items that may not be covered during the 4-day food record period, such as fish. The FPQ covers 32 questions about foods, 3 about bever-ages, 4 about meal type and 4 about food-related products and a final question about diet-change. The participants are asked to estimate their habitual intake for the previous six months.
At a re-examination sub-study, 400 participants were invited to record their diet once again approximately two years after their initial baseline registration.
The dental sub‑study (MODS)
The Malmö Offspring Dental Study (MODS) is the dental
arm of MOS initiated in October 2014. MODS participants are recruited from the individuals already enrolled in MOS.
Oral biofilm samples: Collection of biofilm in the
buc-cal mucosa and on the tongue dorsum is performed using a Catch-All Sample Collection Swab. After swabbing, the sponge is put back in its vehicle and frozen at − 80 °C. The mesiolingual surface of teeth 16, 26, 36 and 46 is scraped with a sterile Gracey curette to remove subgingival plaque followed by immersing the tip of the curette into 150 μl of lysis buffer [23] on ice after which the tubes are frozen at − 80 °C. If an index tooth is missing, the tooth mesial to
Table 2 Lifestyle questionnaire sub-domains
*Visual Analogue Scale (VAS) Parts included in the questionnaire
Family relatedness Women’s reproductive health Education and professional life Tobacco
Medical history Alcohol
Family disease history Self-perceived health, stress and social life
Irritable bowel syndrome (IBS)
VAS*-scale Physical activity
the index tooth is chosen. Saliva was sampled by allowing the participant to chew on piece of sterile paraffin tablet for 5 min. The saliva was aliquoted and frozen at − 80 °C for further analysis, including microbiome sequencing.
Radiologic and clinical examination: One panoramic
radiograph is taken to get an overview of all teeth and alve-olar bone. Four bite-wing radiograph pictures of the malve-olar and pre-molars are taken to assess primary caries and alveo-lar bone height in more detail. Clinically, caries is detected using standard clinical criteria aided by mirror, probe (Hu-Friedy EXD57) and bite-wing radiographs. Cavitated lesions that extend into the dentin are recorded as manifest caries. Periodontal disease is assessed using a periodontal probe with 1 mm grading (Hu-Friedy PCPUNC157) and pockets > 2 mm is recorded at six sites per tooth as well as clinical attachment loss, bleeding on probing and presence of plaque based on the Silness-Löe index. Periodontitis is diagnosed and classified to moderate or severe based on the American Association of Periodontology definitions [24]. Salivary secretion rate is measured through stimulated sali-vary secretion.
Dental register data The Swedish Dental Register
(Tand-hälsoregistret) contains data on number of teeth and treat-ments performed due to e.g. periodontal disease or caries.
Statistics and power calculation
To fully utilize the information collected in our cohort, and to accommodate covariate effects, heritability will be esti-mated using a variance component model [25]. This model can accommodate pedigrees of any configuration and is well suited for the analysis of extended pedigrees. Relationships between the phenotypes in G2–G3 and disease history in G1 will be evaluated using multivariable logistic regres-sion. We have based our sample size of the G2–G3 on the following rough assumptions (being very well aware that the exact figures vary between phenotypes/diseases): (1) a typical heritability of chronic diseases and their major risk factors is commonly around 50% (20–80%), and (2) a typi-cal point effect estimate (odds ratio or hazard ratio) of one standard deviation change of a biomarker (e.g., plasma bio-marker or composite gene score) in relation to risk of future development of a disease is 1.25. Making specific power calculations regarding all the various phenotypes in rela-tion to their co-variarela-tion with intergenerarela-tional clustering of disease expression is unreasonable.
Given the assumptions stated above, a logistic regres-sion of a binary response variable (Y) on a continuous, normally distributed variable (X) with a sample size of 4000 observations achieves 92% power at a 0.05 sig-nificance level to detect a change in Prob(Y = 1) from the value of 0.080 at the mean of X to 0.098 when X is increased to one standard deviation above the mean. This
change corresponds to an odds ratio of 1.25. An adjust-ment was made since a multiple regression of the inde-pendent variable of interest on the other indeinde-pendent vari-ables in the logistic regression is assumed to obtain an R-Squared of 0.20.
As this is a family-based study the variation within the cohort could be expected to be lower than in a general population, why this should be taken into account. One way to deal with this bias is to use a robust standard error based on the family structure in the cohort.
Results
Initiating phase
The first study year (2013–2014) was an initiating phase of MOS and after this period the main study protocol was set, with the main changes including digitalization of ques-tionnaires, removal of the oral glucose tolerance test, and a change in blood sample preparation.
Interim analysis
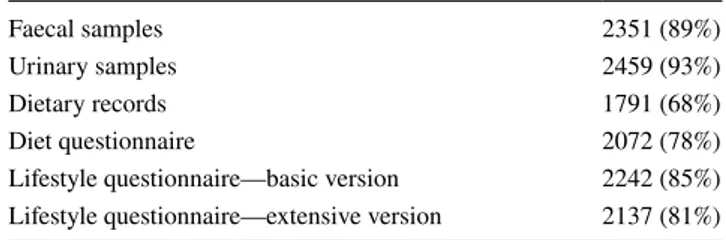
In May 2017, the MOS study had reach halftime accord-ing to initial recruitment goals, with a participation rate of 47.0% and an age span of 18–71 years. Of the 2644 participants, 1326 were G2 and 1321 were G3. The 2644 participants originate from 1387 families of which 56% include at least two, and 28% at least three individuals, from the same family or extended family, the largest five families having nine recruited participants each. The par-ticipants have provided a number of different biological samples and other data, Table 3.
This first interim analysis of MOS identifies a cohort characterized by a wide age range (18–71 years), (52% women), slight overweight (mean BMI 25.8 kg/m2), a
dominance of non-smokers (60% have never smoked), 38% have a university degree, and 28% are doing some exercise every week. Further descriptive background data on the study population is presented in Table 4.
Table 3 Number of individuals (n, percent) included in the different
sample and data collections at interim analysis (November 2017)
Faecal samples 2351 (89%)
Urinary samples 2459 (93%)
Dietary records 1791 (68%)
Diet questionnaire 2072 (78%)
Lifestyle questionnaire—basic version 2242 (85%) Lifestyle questionnaire—extensive version 2137 (81%)
Table 4 Characteristics of MOS participants (n = 2644) at interim analysis
Means (SD) and proportions (%)
LDL: low density lipoprotein; HDL: high density lipoprotein *prevalent tumours at baseline
**CVD event = cardiovascular event (myocardial infarction and/or stroke)
Mean (SD) or % Generation 2 Generation 3 Men Women
Age (years) 39.8 (13.9) 51.5 (8.1) 27.9 (6.7)
Sex (% women) 52.1 52.3 52.1
BMI (kg/m2) 25.8 (4.7) 26.8 (4.7) 24.9 (4.6) 26.6 (4.4) 25.1(4.9)
Waist circumference (m) 0.85 (0.09) 0.93 (0.13) 0.86 (0.12) 0.95 (12.8) 0.84 (12.42)
Fasting glucose (mmol/L) 5.48 (1.05) 5.7 (1.28) 5.3 (0.73) 5.57 (1.2) 5.4 (0.9)
LDL cholesterol (mmol/L) 3.13 (0.94) 3.42 (0.95) 2.83 (0.84) 3.27 (0.99) 3.0 (0.9)
HDL cholesterol (mmol/L) 1.61 (0.48) 1.66 (0.52) 1.57 (0.44) 1.41 (0.39) 1.80 (0.48)
Triglycerides (mmol/L) 1.12 (0.69) 1.28 (1.57) 1.01 (0.58) 1.32 (1.32) 0.99 (0.53)
Systolic Blood Pressure (mmHg) 115 (15) 121 (16) 111 (11) 121 (12) 112 (15)
Diastolic Blood Pressure (mmHg) 71 (10) 76 (10) 67 (7) 72 (10) 71 (10)
Medical history
Any prescribed drug (%) 37.1 45.8 27.4 24.3 35.9
Antibiotics use the last 6 months (%) 14.2 11.7 17 11.1 16.9
Prevalent diabetes (n) 85 69 16 53 32
Prevalent cancer (n)* 192 149 45 31 161
Prevalent CVD events (n)** 38 34 4 22 16
Lifestyle, education
Physical activity at work (%)
Very light 44 48.4 39 45.7 42.1
Light 15.2 17.2 12.8 13.3 17
Moderate 24.7 22.5 27.2 19.6 29
Heavy 12.9 9.8 26.4 14.7 11.3
Very heavy 3.3 2.1 4.6 6.7 0.6
Leisure physical activity (%)
Sedentary 9 9.5 8.4 10.1 8.1 Low 37.5 40.2 34.4 34.9 40.1 Moderate 27.9 28.1 27.7 27 28.5 High 25.6 22.3 29.5 28 23 Smoking (%) Regular smokers 7 6.9 7 5.5 8.2 Irregular smokers 9.8 5.8 14 10.7 9 Ex-Smokers 24.2 33.4 14.6 33.4 25.8 Never smokers 59 53.9 64.4 61.4 57 Snuff use (%)
Ever used daily snuff 19.9 21.6 18 36 6.1
Alcohol intake (%) Never 7.1 6.7 7.6 5.7 8.4 1/month 22 17.6 27.4 16 27.1 2–4/month 41.3 36.1 47 43.9 39.3 2–3/week 25.7 34.8 16.3 29.1 22.8 > 4/week 3.8 5.8 1.6 5.3 2.4 Education level (%) Basic < 9 years 0.2 0.18 0.3 0.19 0.33
Primary school 9–12 years 6.8 8.7 4.6 7.1 6.7
High school 55.1 50.5 60.2 62.3 50.1
Present status of MOS
As of May 2020 we have recruited in total 4721 participants (G2: 2609; G3: 2112). The participation rate is 46.8% (G2: 54.3%; G3: 40.0%). Clinical and technical data have to be assessed for quality control as similar to the interim analysis in November 2017.
Dietary data
In these interim analyses, diet was very similar between the generation 1 MDC-CC and generation G2 and G3 in MOS, both for macronutrient intake and the estimated daily intake of energy (kcal) and dietary fibres per day. In MDC-CC these figures were 2341 kcal and 22 g, and in MOS they are 2050 kcal and 18 g, respectively (Fig. 1).
Vascular data
In two publications the arterial stiffness (carotid-femoral pulse wave velocity, c-f PWV) and related measures (Aug-mentation Index, Aix) in MOS have been used. In the first paper Sperling et al. [26] could show that early life factors such as birth weight adjusted for gestational age were predic-tive of adult life c-f PWV and Aix, and in the second paper Petersson Rosberg et al.[27] could show similarities in c-f PWV levels within families across three generations.
Dental and oral data
Dental data in MODS is available from 831 of the 2644 MOS participants based on the halftime data (2017). A low salivary secretion rate of < 0.7 ml/min was observed in 8.7% of the participants and the mean bleeding on probing was 28.9% (SD 18.3) in the MODS cohort. Moderate periodontal disease manifestations were observed in 24.8% and severe periodontal disease in 6.5% of the participants. Manifest caries lesion was diagnosed in 24.8%, defined as lesions clearly involving dentin or fractured or missing filling. The mean number of teeth were 27.2 (SD 1.6) (Supplementary Table S1).
In the additional questionnaire in MODS, 90.6% of par-ticipants reported being delivered through vaginal birth and 6.3% following caesarean sectio. In addition, 80.1% reported being breastfed and 6.6% had received formula feeding.
In a recent publication by Jönsson et al., the association between periodontitis and changes of the carotid arterial wall (plaque area) has been shown [28]. 2455 MOS par-ticipants (93%) had available dental data in The Swedish Dental Register.
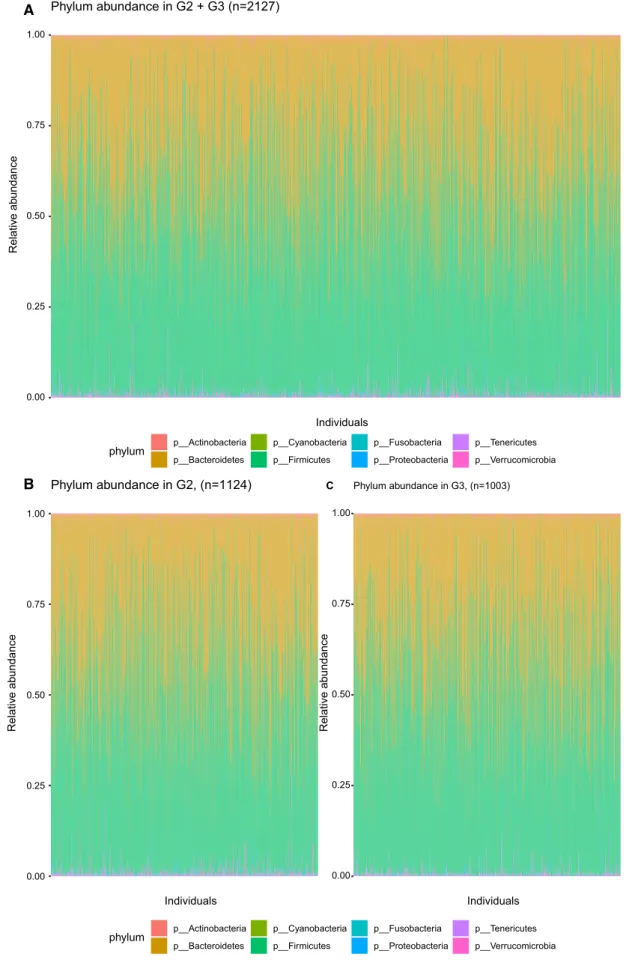
Gut microbiota
Of the 2351 faecal samples collected in the MOS halftime cohort, 2200 were sequenced between 2013 and 2017. The microbial DNA was extracted using the QIAamp column Stool Kit. The V1-V3 region (300 bp × 2) of the 16S rRNA gene was amplified and sequenced on a HiSeq Illumina at the GATC Biotech (Constance, Germany) and the sequences were matched with the Greengenes database (version 13.8). In this study sample the average amount of counts per sam-ple were 434,008 with a maximum of 1,268,483, and 533 operational taxonomical units (OTU) were detected with an average of 90 OTUs per individual. With 16S sequencing, we get reliable data of bacteria on 5 taxonomical levels (phy-lum, class, order, family and genus), and for some bacteria, estimates can be done down to species level. The two domi-nant phyla are Firmicutes and Bacteroidetes (Fig. 2), and the three most common genera are Bacteroides, unclassified
A
B
Fig. 1 Macronutrient intake in generation 2/3 (MOS) and generation
0.00 0.25 0.50 0.75 1.00 Individuals Relativ e ab undanc e Phylum abundance in G2 + G3 (n=2127) A phylum p__Actinobacteria p__Bacteroidetes p__Cyanobacteria p__Firmicutes p__Fusobacteria p__Proteobacteria p__Tenericutes p__Verrucomicrobia 0.00 0.25 0.50 0.75 1.00 Individuals Relativ e ab undanc e Phylum abundance in G2, (n=1124) B 0.00 0.25 0.50 0.75 1.00 Individuals Relative abundanc e Phylum abundance in G3, (n=1003) C phylum p__Actinobacteria p__Bacteroidetes p__Cyanobacteria p__Firmicutes p__Fusobacteria p__Proteobacteria p__Tenericutes p__Verrucomicrobia
genus in the Ruminococcaceae family and an unclassified genus in the Rikenellaceae family.
In one publication by Ottosson et al.[29] the association between obesity and microbiota patterns were described. The authors discovered associations between four gut micro-biota genera (Blautia, Dorea, Ruminococcus, and SHA-98) and BMI-predictive plasma metabolites, including glutamate and BCAAs. Thus, these metabolites could be mediators between gut microbiota and obesity, pointing to poten-tial future opportunities for targeting the gut microbiota in prevention of obesity [29]. Additionally, Eriscon et al. investigated the associations between gut bacteria, a data driven healthy eating pattern and prediabetes. In this paper we among other things observed Roseburia to be associated both with a decreased risk of prediabetes and with a higher adherence to a healthy diet pattern [30].
Gastrointestinal aspects
In one paper by Ohlsson et al. [31] the biomarker zonulin, a biomarker of supposed increased intestinal permeability, was investigated in a subgroup of MOS participants. Higher zonulin levels were associated with higher waist circumfer-ence, diastolic blood pressure, fasting glucose, and increased risk of metabolic diseases, but not with gastrointestinal symptoms.
Follow‑up data on morbidity and mortality
From the Swedish national registers, we have provided fol-low-up data for 2644 participants until the 31st of December 2016. During the mean follow-up time of 1.6 (0–3.8) years, 23 incident diabetes diagnoses, 22 incident malignancies, 32 cardiovascular events and 5 deaths were recorded within the study population. Further follow-up data will be available in the near future.
Discussion
With the ambition to characterize family patterns of chronic cardio metabolic disease conditions in search of the so called “missing heritability”, MOS had in 2017 recruited 2644 individuals (47% attendance) representing children (G2) and grandchildren (G3) to individuals (G1) first examined within the MDC-CC study between 1992 and 1996. We col-lect a wide range of data including somatic phenotyping, lifestyle characteristics and dietary profiling, as well as col-lection of faecal and oral samples for microbiome analysis. Genetic data (GWAS) will be analysed in all MOS partici-pants, thereby increasing the possibilities to elucidate on gene-environmental interactions.
Some data have already been published concerning the role of the biomarker zonulin in relation to features of the metabolic syndrome and gastrointestinal symptoms [31], and the link between BMI-related blood metabolite pattern and gut microbiota composition [29]. In addition, we have published data on the self-reported family history of cardio metabolic disease in the index generation (G1) from MDC-CC [32], but also on the genetic influence of hyperglycaemia on arterial stiffness based on a genetic risk score in the same G1 index subjects [33]. Newer studies have documented family patterns of arterial stiffness [26] and the association between periodontitis and carotid plaque area [28].
In the 2200 sequenced faecal samples, the two dominant phyla were as expected Bacteroidetes and Firmicutes, and the relative abundance of different genera were comparable to what others have identified by 16S sequencing in Euro-pean population [34]. In our study, the V1–V3 region was sequenced to get long reads and OTUs were picked with a “closed method” using the Greengene database. Today, the more comprehensive method of shot-gun metagenomic sequencing has drastically decreased in price and will be the first hand option for sequencing of future samples. However, the 16S methods is still very relevant as it provides reliable data down to genus level, takes up much less data capacity and many other larger studies have 16S data which enables comparison and generalization.
Similar studies exist, both the Framingham Offspring Study (FOS) in the US [12, 13] and the LifeLines study in the Netherlands [34, 35], both focusing on family traits of cardiovascular risk, and for LifeLines also on gut microbiota [34]. MOS is similar, yet different form these studies, with the unique possibility of national register-based follow-up. This allows tracing of the incident fatal and non-fatal events by local, regional and national registers, and not only by medical records of hospitalization that provide an underes-timate of the true incidence rate of for example T2D, which is often diagnosed and treated in primary health care only. In addition, the source population (G1) is very deeply phe-notyped and gephe-notyped. The long follow-up has provided valuable information on G1 morbidity and mortality, and an extensive dietary data was assessed at baseline. Finally, we have recently got access to genome-wide genotyping and exome sequencing data in G1 (O Melander, personal com-munication), which provides information on parental and grandparental genetics and allows genotype-based recalling of MOS participants. However, there are also many simi-larities between these three population-based family studies making comparisons between them possible. In addition, also the Reykjavik Heart Study (RHS) includes some infor-mation on family traits, possible to explore and compare with, as was already done in the past when comparing echo-cardiography findings in the RHS with MPP [36].
Strengths and limitations of MOS
The strengths of MOS include the deep phenotyping over three generations in combination with extensive data on medical history, food habits, lifestyle and genetics, but also on gut and oral microbiota in children and grandchildren (G2, G3). These data can help us to elucidate on the so-called missing heritability when we are going to study the family patterning of these characteristics. One limitation of MOS is the less than optimal participation rate (47% in gen-eral, but 54% in G2 and 40% in G3) that reflects the difficul-ties in constructing attractive-enough invitations directed to young or middle-aged subjects in a changing urban society, as many of the younger subjects feel healthy. Other limita-tions are that not all subjects provide neither all dietary data nor faeces samples, and that we were not able to offer all clinical investigations to both children (G2) and grandchil-dren (G3) due to cost constraints.
Future research in MOS will enable us to investigate novel aspects of the genetics-diet-microbiota patterns and how these connect to both vascular and metabolic traits, for example arterial stiffness as a marker of vascular ageing. Importantly, these patterns will be prospectively associated to incident disease and mortality endpoints derived from national registers. Moreover, as we have been able to trace early life data such as birth weight and length in almost all study participants from the Medical Birth Register, connect-ing these data to organ function, as well as morbidity and mortality outcomes, can bring new understanding regard-ing the early life developmental origin of adult health and disease [37]. One such study based on MOS was recently published [26]. Finally, many studies have associated obe-sity, T2D and CVD with specific changes of the gut micro-biota composition and novel mechanisms have emerged in particular from preclinical gut microbiota studies. MOS will offer what the field is still missing, a large population- and family-based prospective study, with multiple omics data and clinical phenotyping, where causal associations and directions can be investigated utilizing the Mendelian rand-omization approach.
In summary, MOS is a large ongoing population-based, transgenerational cohort study generating a rich set of data, including extensive phenotyping for vascular function, meta-bolic traits, genotyping as well as faecal metagenomics and dietary assessment, and has at half time included 2644 indi-viduals. This cohort, aiming to have up to 6000 participants by 2021, will enable an extensive number of studies with focus on investigating heritability and prediction of multi-factorial diseases such as T2D and CVD.
Acknowledgements The Malmö Offspring Study (MOS) has been
funded by the Research Council of Sweden (Grant 521-2013-2756), the Heart and Lung Foundation (Grant 20150427), and by funds obtained
from the local Region Skane County Council (ALF) to PM Nilsson. In addition, funding has been obtained from Ernhold Lundströms Stif-telse, donations to the Skane University Hospital, a research grant from Oral Health Related Research by Region Skane to Malmo University, Faculty of Odontology, Periodontal Department (to B Klinge and D Jönsson) and the European Research Council (to M Orho-Melander). We thank the staff at the Clinical Research Unit, Department of Inter-nal Medicine, for their dedicated work over many years, and also data manager Anders Dahlin for extensive quality control of MOS data. Additionally, we thank Johan Hultman for working with setting up the microbiota pipeline.
Author contributions Design of the study (PMN, OM, MOM, GE, MP,
JN, BO, GÖ, CK, AJ), design of MODS (DJ, BK), diet and microbiota data (MOM, UE, LB, SH). All authors have approved the manuscript. PMN is the Principal Investigator for MOS.
Funding Open access funding provided by Lund University.
Compliance with ethical standards
Conflicts of interest The authors declare that they have no conflict of
interest.
Open Access This article is licensed under a Creative Commons
Attri-bution 4.0 International License, which permits use, sharing, adapta-tion, distribution and reproduction in any medium or format, as long as you give appropriate credit to the original author(s) and the source, provide a link to the Creative Commons licence, and indicate if changes were made. The images or other third party material in this article are included in the article’s Creative Commons licence, unless indicated otherwise in a credit line to the material. If material is not included in the article’s Creative Commons licence and your intended use is not permitted by statutory regulation or exceeds the permitted use, you will need to obtain permission directly from the copyright holder. To view a copy of this licence, visit http://creat iveco mmons .org/licen ses/by/4.0/.
Appendix 1: Description of technical
methods
Ultrasound of the carotid arteries
The degree of atherosclerosis is measured in the carotid arteries using B-mode ultrasound (Logiq E9, GE Health-care). Images of the left and right common carotid artery and bifurcation are captured in end-diastole. Intima media thickness (IMT) is subsequently measured off-line using a semi-automatic analysis program (Artery Measurement System [AMS]), as a sign of early stages of atherosclerosis. A plaque is defined as a focal thickening of the intima layer exceeding 1.2 mm in height. All plaques present in the visi-ble parts of the common, internal and external arteries and in the bifurcation are measured online (height, length and area) as a sign of more advanced atherosclerosis. Morphology of the plaque is measured on-line in terms of ulceration and assessment of the plaque surface being smooth or uneven. Further measurements of plaque morphology will be done
off-line using the AMS system. Blood flow velocity in the internal carotid artery is measured for evaluation of clinical significant degree of stenosis. Direction of the blood flow velocity is in the vertebral artery is documented.
Pulse wave velocity
Arterial stiffness is assessed using the Sphygmocor (AtCor, Australia) device [27]. Pulse wave velocity (PWV) in m/sec, is measured along the abdominal aorta. Pulse curves are obtained from the carotid and the femoral arteries. The device calculates the time from the R-wave, on a simultaneous ECG-recording, to the foot of the pulse wave of the carotid and femoral arter-ies, respectively. The distance, measured as the straight line from the carotid to the femoral artery times 0.8, is entered manually in the program, as recommended in guidelines. Two measurements are performed. If the difference between the two measurements is above 0.5 m/s a third is performed. The mean value of the measurements is used.
Pulse wave analysis
Pulse wave analysis (PWA) is performed using the pulse curve of the radial artery obtained by the SphygmoCor trans-ducer. Two measurements are performed. If the difference between the two measurements is above 3% a third is per-formed. The mean value of the measurement is used.
Ankle Brachial Pressure Index
A measurement of the Ankle Brachial Pressure Index (ABPI) is performed and measured using cuffs of an appro-priate size attached to a sphygmomanometer. Systolic blood pressure is measured using a pen Doppler (Hadeco Bidop ES 100V3). Blood pressure cuffs are attached to the upper arms and the ankles. Systolic blood pressure is measured beginning in the right arm, then in the right ankle, the left ankle and finally in the left arm. Pressure is measured once in each arm over the radial artery. In the ankle the pressure is measured once in art. dorsalis pedis and then once in art.
tibialis posterior. ABPI is calculated by dividing the highest
blood pressure on each ankle with the blood pressure from the arm with the highest value.
Endothelial function
Endothelial function is measured using the EndoPat device (Itamar, Israel) to estimate the endothelium-dependent vasodilation following post-ischemic hyperaemia. A cuff is placed on the non-dominant upper arm, and the index or middle fingers are placed in pneumo-electric tubes. Arterial pulsatile volume changes are recorded continuously. After
a 5 min period of rest, the cuff is inflated to 200 mmHg, with the opportunity to increase the pressure to a maximum of 300 mmHg if necessary. After occlusion for 5 min, the pressure of the cuff is released and the arterial dilatation mediated by the occlusion, assessed as an increase in the signal amplitude, is recorded for another 5 min. The reactive hyperaemia index (RHI) is calculated as a post-occlusion to pre-occlusion ratio of the signal amplitudes.
Ambulatory blood pressure and arterial stiffness measurements
Ambulatory blood pressure and arterial stiffness are meas-ured in subgroups using the TensioMed Arteriograph 24 (TensioMed™ Ltd, Hungary) device during 24 h. Blood
pressure is then measured every 15 min during daytime (06.00–22.00) and every 30 min during night (22.00–06.00). Brachial systolic and diastolic blood pressure, aortic systolic and diastolic blood pressure, aortic PWV and heart rate are recorded at each measurement. Subjects are excluded from analyses if more than 30% of the blood pressure recordings were missing. Both blood pressure and indirectly calculated aortic PWV by use of Arteriograph 24 have been validated against standardized methods previously.
Echocardiography
Conventional echocardiograms were carried out using a GE Vingmed Vivid 7 Ultrasound (GE, Vingmed Ultrasound, Horten, Norway) with a 1–4 MHz transducer (M3S). Cine loops were obtained from standard views (parasternal long axis, apical 4- and 2-chamber). Measurements of chamber size and function were done offline using Philip Intellis-pace Cardiovascular (Philips Medical Systems, Netherlands) according to the recommendations of the American Society of Echocardiography [38]. Internal left and right ventricular dimensions were measured from parasternal long axis view at end-diastole. Left ventricular volumes were calculated using the biplane Simpson method of disks, by manual trac-ing in two-dimensional end-diastolic and end-systolic frames defined as the largest and smallest left ventricular cavities, respectively, in apical 4- and 2-chamber projections. Ejec-tion fracEjec-tion (EF) was calculated automatically from end-diastolic volumes (EDV) and end-systolic volume (ESV) using the following formula: EF = (EDV- ESV)/EDV.
Spirometry
A pulmonary function test is performed using spirometry (Jaeger Masterscope) where forced vital capacity (FVC) and forced expiratory volume in 1 s (FEV1) are measured.
difference between the highest and second highest value should be ≤ 150 mL (or ≤ 100 mL if FVC ≤ 1L).
Skin autofluorescence
Skin autofluorescence of Advanced Glycation End (sf-AGE) products is measured using an AGE Reader (DiagnOptics, Groningen, The Netherlands) at room temperature. During measurement, a skin surface of approximately 2 cm2 is
illu-minated with an ultraviolet light source that ranges between 300 to 420 nm, when the skin of subjects emits light at dif-ferent wavelengths that are registered by a spectrometer. The major contribution in s-f AGE comes from AGEs linked to collagen and is influenced by glycaemia and oxidate stress, but also dietary components. An average of three read-ings on subject’s non-dominant forearm is calculated and reported in arbitrary units (AU). Measurements of the s-f AGE accumulation using the AGE-Reader have previously been validated.
Appendix 2: Map of Sweden indicating
the city of Malmö were MOS examinations
are carried out 2013–2021
Appendix 3: Malmö Offspring Study (MOS)
and Malmö Offspring Dental Study (MODS):
Flow chart of participants in generation 1–3
(G1‑G3)
G1 (n=6103)
Eligible participants G2 and G3 (n=15 000)
Participants G2 and G3 May 2020 (n=4721) Interim study 2016 (n=2649) MODS (n=831)
References
1. Collaborators GBDRF. Global, regional, and national com-parative risk assessment of 84 behavioural, environmental and occupational, and metabolic risks or clusters of risks for 195 countries and territories, 1990–2017: a systematic anal-ysis for the Global Burden of Disease Study 2017. Lancet. 2018;392(10159):1923–94. https ://doi.org/10.1016/S0140 -6736(18)32225 -6.
2. Queitsch C, Carlson KD, Girirajan S. Lessons from model organisms: phenotypic robustness and missing heritability in complex disease. PLoS Genet. 2012;8(11):e1003041. https ://doi. org/10.1371/journ al.pgen.10030 41.
3. Emdin CA, Khera AV, Kathiresan S. Mendelian Randomiza-tion. JAMA. 2017;318(19):1925–6. https ://doi.org/10.1001/ jama.2017.17219 .
4. Voight BF, Peloso GM, Orho-Melander M, Frikke-Schmidt R, Barbalic M, Jensen MK, et al. Plasma HDL cholesterol and risk of myocardial infarction: a mendelian randomisation study. Lancet. 2012;380(9841):572–80. https ://doi.org/10.1016/S0140 -6736(12)60312 -2.
5. Goodrich JK, Waters JL, Poole AC, Sutter JL, Koren O, Ble-khman R, et al. Human genetics shape the gut microbiome. Cell. 2014;159(4):789–99. https ://doi.org/10.1016/j.cell.2014.09.053. 6. Brunkwall L, Orho-Melander M. The gut microbiome as a target
for prevention and treatment of hyperglycaemia in type 2 diabetes: from current human evidence to future possibilities. Diabetologia. 2017. https ://doi.org/10.1007/s0012 5-017-4278-3.
7. Cani PD. Human gut microbiome: hopes, threats and promises. Gut. 2018;67(9):1716–25. https ://doi.org/10.1136/gutjn l-2018-31672 3.
8. Rydén L, Buhlin K, Ekstrand E, de Faire U, Gustafsson A, Hol-mer J, et al. Periodontitis increases the risk of a first myocardial infarction: a report from the PAROKRANK study. Circulation.
2016;133(6):576–83. https ://doi.org/10.1161/CIRCU LATIO NAHA.115.02032 4.
9. Buhlin K, Gustafsson A, Pockley AG, Frostegard J, Klinge B. Risk factors for cardiovascular disease in patients with periodontitis. Eur Heart J. 2003;24(23):2099–107.
10. Norhammar A, Kjellstrom B, Habib N, Gustafsson A, Klinge B, Nygren A, et al. Undetected dysglycemia is an important risk factor for two common diseases, myocardial infarction and peri-odontitis: a report from the PAROKRANK study. Diabetes Care. 2019;42(8):1504–11. https ://doi.org/10.2337/dc19-0018. 11. Melander O, Maisel AS, Almgren P, Manjer J, Belting M,
Hed-blad B, et al. Plasma proneurotensin and incidence of diabetes, cardiovascular disease, breast cancer, and mortality. JAMA. 2012;308(14):1469–75. https ://doi.org/10.1001/jama.2012.12998 . 12. Feinleib M, Kannel WB, Garrison RJ, McNamara PM, Castelli
WP. The Framingham offspring study design and preliminary data. Prev Med. 1975;4(4):518–25.
13. Enserro DM, Vasan RS, Xanthakis V. Twenty-year trends in the American Heart Association cardiovascular health score and impact on subclinical and clinical cardiovascular disease: the framingham offspring study. J Am Heart Assoc. 2018. https :// doi.org/10.1161/JAHA.118.00874 1.
14. Nilsson PM, Nilsson JA, Berglund G. Family burden of cardio-vascular mortality: risk implications for offspring in a national register linkage study based upon the Malmo Preventive Project. J Intern Med. 2004;255(2):229–35.
15. Elmstahl S, Gullberg B, Riboli E, Saracci R, Lindgarde F. The Malmo Food Study: the reproducibility of a novel diet history method and an extensive food frequency questionnaire. Eur J Clin Nutr. 1996;50(3):134–42.
16. Elmstahl S, Riboli E, Lindgarde F, Gullberg B, Saracci R. The Malmo Food Study: the relative validity of a modified diet his-tory method and an extensive food frequency questionnaire for measuring food intake. Eur J Clin Nutr. 1996;50(3):143–51. 17. Berglund G, Elmstahl S, Janzon L, Larsson SA. The Malmo
Diet and Cancer Study Design and feasibility. J Intern Med. 1993;233(1):45–51.
18. Nasreddine ZS, Phillips NA, Bedirian V, Charbonneau S, White-head V, Collin I, et al. The montreal cognitive assessment, MoCA: a brief screening tool for mild cognitive impairment. J Am Geriatr Soc. 2005;53(4):695–9. https ://doi.org/10.111 1/j.1532-5415.2005.53221 .x.
19. Kenny RA, Coen RF, Frewen J, Donoghue OA, Cronin H, Savva GM. Normative values of cognitive and physical function in older adults: findings from the Irish longitudinal study on ageing. J Am Geriatr Soc. 2013;61(Suppl 2):S279–90. https ://doi.org/10.1111/ jgs.12195 .
20. Jacobson JM, Nielsen NP, Minthon L, Warkentin S, Wiig EH. Multiple rapid automatic naming measures of cognition: normal performance and effects of aging. Percept Mot Skills. 2004;98(3 Pt 1):739–53. https ://doi.org/10.2466/pms.98.3.739-753. 21. Wiig EH, Nielsen NP, Minthon L, Warkentin S. A quick test of
cognitive speed. San Antonio: Pearson; 2002.
22. Nybacka S, Berteus Forslund H, Wirfalt E, Larsson I, Ericson U, Warensjo Lemming E, et al. Comparison of a web-based food record tool and a food-frequency questionnaire and objective validation using the doubly labelled water technique in a Swed-ish middle-aged population. J Nutr Sci. 2016;5:e39. https ://doi. org/10.1017/jns.2016.29.
23. Yu Z, Morrison M. Improved extraction of PCR-quality com-munity DNA from digesta and fecal samples. Biotechniques. 2004;36(5):808–12. https ://doi.org/10.2144/04365 ST04. 24. Caton JG, Armitage G, Berglundh T, Chapple ILC, Jepsen
S, Kornman KS, et al. A new classification scheme for peri-odontal and peri-implant diseases and conditions: Introduction
and key changes from the 1999 classification. J Periodontol. 2018;89(Suppl 1):S1–8. https ://doi.org/10.1002/JPER.18-0157. 25. Almasy L, Blangero J. Multipoint quantitative-trait linkage
analy-sis in general pedigrees. Am J Hum Genet. 1998;62(5):1198–211. https ://doi.org/10.1086/30184 4.
26. Sperling J, Nilsson PM. Does early life programming influence arterial stiffness and central hemodynamics in adulthood? J Hypertens. 2019. https ://doi.org/10.1097/HJH.00000 00000 00229 2.
27. Petersson Rosberg E, Nilsson PM. Family patterns of arte-rial stiffness and centeral haemodynamics across three genera-tions in Malmö Offspring Study. J Hypertens. 2019. https ://doi. org/10.1097/01.hjh.00005 73764 .25347 .f3.
28. Jonsson D, Orho-Melander M, Demmer RT, Engstrom G, Mel-ander O, Klinge B, et al. Periodontal disease is associated with carotid plaque area: The Malmo Offspring Dental Study (MODS). J Intern Med. 2019. https ://doi.org/10.1111/joim.12998 . 29. Ottosson F, Brunkwall L, Ericson U, Nilsson PM, Almgren P,
Fernandez C, et al. Connection between BMI-related plasma metabolite profile and gut microbiota. J Clin Endocrinol Metab. 2018;103(4):1491–501. https ://doi.org/10.1210/jc.2017-02114 . 30. Ericson U, Brunkwall L, Hellstrand S, Nilsson P, Orho-Melander
M. A Health-conscious food pattern is associated with prediabetes and gut microbiota in the Malmö Offspring Study. J Nutrition. 2019;150:861.
31. Ohlsson B, Orho-Melander M, Nilsson PM. Higher levels of serum Zonulin May rather Be associated with increased risk of obesity and hyperlipidemia, than with gastrointestinal symp-toms or disease manifestations. Int J Mol Sci. 2017. https ://doi. org/10.3390/ijms1 80305 82.
32. Fatehali AA, Gottsater M, Nilsson PM. Family history of cardio-metabolic diseases and its association with arterial stiffness in the Malmo Diet Cancer cohort. J Hypertens. 2017;35(11):2262–7. https ://doi.org/10.1097/HJH.00000 00000 00145 7.
33. Gottsater M, Hindy G, Orho-Melander M, Nilsson PM, Melander O. A genetic risk score for fasting plasma glucose is independently associated with arterial stiffness: a Mendelian randomization study. J Hypertens. 2018;36(4):809–14. https ://doi.org/10.1097/ HJH.00000 00000 00164 6.
34. Falony G, Joossens M, Vieira-Silva S, Wang J, Darzi Y, Faust K, et al. Population-level analysis of gut microbiome variation. Science. 2016;352(6285):560–4. https ://doi.org/10.1126/scien ce.aad35 03.
35. Scholtens S, Smidt N, Swertz MA, Bakker SJ, Dotinga A, Vonk JM, et al. Cohort Profile: LifeLines, a three-generation cohort study and biobank. Int J Epidemiol. 2015;44(4):1172–80. https :// doi.org/10.1093/ije/dyu22 9.
36. Leosdottir M, Willenheimer R, Plehn J, Borgquist R, Gudmunds-son P, Harris TB, et al. Myocardial structure and function by echocardiography in relation to glucometabolic status in elderly subjects from 2 population-based cohorts: a cross-sectional study. Am Heart J. 2010;159(3):414-20.e4. https ://doi.org/10.1016/j. ahj.2009.12.028.
37. Gluckman PD, Hanson MA, Cooper C, Thornburg KL. Effect of in utero and early-life conditions on adult health and disease. N Engl J Med. 2008;359(1):61–73. https ://doi.org/10.1056/NEJMr a0708 473.
38. Recommendations for Cardiac Chamber Quantification by Echo-cardiography in Adults: An Update from the American Society of Echocardiography and the European Association of, Cardiovas-cular Imaging. Eur Heart J Cardiovasc Imaging 2016;17:412.
Publisher’s Note Springer Nature remains neutral with regard to