1
Value-Cost Appraisal of
Wind Energy Applying Portfolio
Analysis
Oliver Moran
Submitted to the Office of Graduate Studies of Gotland University
in partial fulfilment of the requirements for the degree of MSc Wind Power Project Management
Master Thesis 15 ECTS
Supervisor: Assoc. Prof. Bahri Uzunoglu Examiner: Prof. Jens N. Sørensen
Master of Science Programme in Wind Power Project Management, Department of Wind Energy,
Gotland University Cramérgatan 3
621 57 Visby, Sweden
2
Press release on 23 June 2011 by Charles Hendry, former Minister of State for Energy regarding next generation of UK nuclear plants:
"Around a quarter of the UK's generating capacity is due to close by the end of this decade. We need to replace this with secure, low carbon, affordable energy. This will require over £100bn worth of investment in electricity generation alone. This means twice as much investment in energy infrastructure in this decade as was achieved in the last decade."
Executive Summary
To meet electricity demand, electric utilities develop portfolio strategies for generation, transmission, and distributions systems. Portfolio strategies combine different assets in a portfolio (getting the average returns from the assets) but the risk or in other words the variability of these returns is expected to cancel each other out, since one asset is likely to be up when another is down. Throughout this analysis the energy consumption for the last 40 years is examined from a Levelised Generation Cost (LGC) and portfolio diversity aspect using certain parameters.
When monitoring the gas field productions in UK waters the decline in production from the start of the decade can be noticed. Questions have been asked including what will the UK government invest in next? People are often told if they want to receive higher returns from their investment, they should increase the proportion of stocks in their portfolio or change the mix and invest in more aggressive asset/stock combinations. So can the United Kingdom rely on more imports from a perilously volatile market? When the situation is analysed closely and past events are scrutinised, such as when Russia stopped all gas supplies across the Ukraine (which carried about a fifth of the EU's gas needs) and more presently the conflicts in the Middle East which have affected oil prices, the answer is simple. The United Kingdom investing in more imports is akin to telling people to drive 100 miles per hour if they want to get somewhere sooner. While it's possible that they will arrive faster, it also dramatically increases the likelihood that they won't arrive at all. So where does this leave the future of energy consumption in the British Isles? To counteract this problem the government has looked towards wind power, with focus on offshore wind and in June 2011 they announced the largest nuclear programme for a generation with eight new sites having been proposed. The UK however has gained financially from the northern gas fields with calculated CCGTs LCG of £30.31 MWh provideding affordable electricity for its customers during the last decade (Department of Trade and Industry, 2000). With the gas production declining however a move to nuclear with £175.95 LCG seems costly. Onshore wind £28.62 MWh expected return with £40 MWh income generation used and £34.82 Renewables Obligation Certificates (ROCs) shows why developers are constructing wind farms throughout the British Isles. The Modern Portfolio Theory (MPT) analysis has also shown the overall economical diversity of fuels since 1970 has improved.
3
List of Figures
Figure 2.1: Electricity Transportation Process and Voltage Transformation 34
Figure 2.2: Map of DNOs 34
Figure 2.3: Overview of Market Structure under NETA/BETTA 38
Figure 2.4: Energy Imbalance 39
Figure 3.1: Risk and Return for Portfolio of 2 Assets 48
Figure 4.1: Risk and Return for Portfolio 1 against Portfolio 2 59
Figure 4.2: Risk and Return for the Portfolio Mix Adding New Assets 60
List of Tables
Table 2.1: Import of Coal in 2010 14
Table 2.2: Inland Consumption of Solid Fuels – Producers 15
Table 2.3: Inland Consumption of Solid Fuels - Final Consumption 15
Table 2.4: Natural Gas Imports 20
Table 2.5: Natural Gas Exports 20
Table 2.6: Overall Fuel Used to Generate Electricity and Heat in CHP Installations 25
Table 2.7: Percentage Distribution of Capacity of Major Players 36
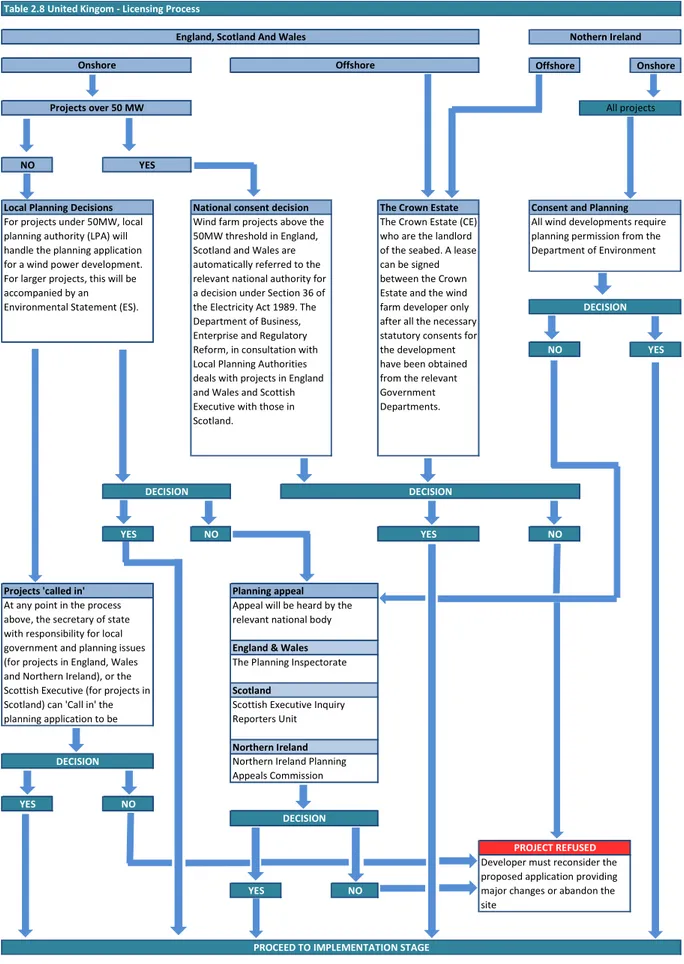
Table 2.8: United Kingdom- Licensing Process 41
Table 2.9: UK Submission Statistics Onshore 42
Table 2.10: UK Approval Statistics Onshore 43
Table 2.11: UK Refusal Statistics Onshore 43
Table 2.12: UK Built Statistics Onshore 43
Table 2.13: Renewables Obligation Certificates 44
Table 2.14: Feed in Tariffs 44
Table 3.1: Technology Input Assumptions 46
Table 3.2 Technology Input Assumptions 46
Table 3.3: Two-Asset Portfolio Problem 47
Table 3.4: One Portfolio 47
Table 3.5: Data of Portfolio Return as Function of Percentage of Asset 1 48
Table 4.1: Results for Generators 49
Table 4.2: Results for Generators 50
Table 4.3: Individual Assets 52
4
Table 4.5: Portfolios 52
Table 4.6: Categorising the Technologies 53
Table 4.7: Electricity supplied GWh and Percentage 54
Table 4.8: Variance-Covariance Matrix - Capital Cost 54
Table 4.9: Individual Assets 54
Table 4.10: Portfolios 55
Table 4.11: Electricity Supplied Analysis adding WTG to 2010 Production 56
Table 4.12: Portfolios 56
Table 4.13: Return on Assets 57
Table 4.14: Percentage of Assets 57
Table 4.15: Two-Asset Mix 57
Table 4.16: Offsetting Portfolio 1 57
Table 4.17: Data Percentage of Portfolio 1 58
Table 4.18: Introducing New Portfolio Combinations Assets to Current Portfolio 59
Table 4.19: Mean Return, Variance and Sigma of New Assets 60
List of Graphs
Graph 2.1: Coal Production and Imports 1970-2010 13
Graph 2.2: Production, Exports and Imports of Crude Oil 1970-2010 16
Graph 2.3: Refinery Output, Exports & Imports of Oil Products 1970-2010 17
Graph 2.4: Inland Deliveries Petroleum - Electricity Generators 1970-2010 18
Graph 2.5: Production, Exports and Importsof Natural Gas 1970-2010 19
Graph 2.6: Total Demand of Gas 2010 21
Graph 2.7: Nuclear Generated and Supplied 1970-2010 23
Graph 2.8: CHP Electricity and Heat Generation 1977-2010 24
Graph 2.9: Electricity Generated from Renewables 1990-2010 27
Graph 2.10: Used to Generate Electricity 1990-2010 27
Graph 2.11: Fuel Input for Electricity Generation 1970-2010 29
Graph 2.12: Electricity Generated and Supplied 1970-2010 30
Graph 2.13: Generating Capacity of Major Power Producers 1996-2010 31
Graph 4.1: Technologies Expected Return from LCG and Risk 50
5
List of Acronyms
AGRs Advanced Gas-cooled Reactors
BETTA British Electricity Trading and Transmission Arrangement
CCGT Combined Cycle Gas Turbines
CCS Carbon Capture and Storage
CHP Combined Heat and Power
DECC Department of Energy & Climate Change
DNOs Distribution Network Operators
DUKES Digest of United Kingdom Energy Statistics
EEA European Economic Area
FITs Feed-In Tariff Scheme
GB Great Britain (England, Scotland and Wales)
GDP Gross Domestic Products
HLW High-Level Waste
IGCC Integrated Gasification Combined Cycle
ILW Intermediate-Level Waste
kWh kiloWatt Hour
LCG Levelised Cost of Generation
LLW Low-Level Waste
LNG Liquefied Natural Gas
MPPs Major Power Producers
MPT Modern Portfolio Theory
MWh Megawatt hour
NDA Nuclear Decommissioning Authority
NETA New Electricity Trading Arrangement
NGC National Grid Company
NPV Net Present Value
NPVG NPV of Net Electricity Generation
O&M Operations and Maintenance
OFGEM Office of Gas and Electricity Markets
OTC Cover-The-Counter
PWR Pressure Water Reactor
RO Renewable Obligation
6
SBP System Buy Price
SD Standard Deviation
TOTC Net Present Value of Total Costs (Capital and Operating)
TWh Terawatt hour
WTG Wind Turbine Generator
UK United Kingdom
WTG Wind Turbine Generator
Acknowledgements
I would like to acknowledge the support and assistance of the academic staff in the Department of Wind Energy at Gotland University, particularly would like to thank Assoc. Prof. Bahri Uzunoglu for the guidance throughout my thesis research.
Next, I would like to thank my family, especially my parents for their inspiration and support to accomplish this goal in my life. This list would be incomplete without my friends and relatives; I thank them for making my life easier during this time, for giving me the support and encouragement when I needed them the most.
Last but not least, I want to dedicate this work to my cousin Niall, who regrettably never got a chance to complete his own manuscript. An chuid eile i síocháin.
Visby, June 2012
Oliver Moran
7
Contents
Executive Summary ... 2 List of Figures ... 3 List of Tables ... 3 List of Graphs ... 4 List of Acronyms ... 5 Acknowledgements ... 6 1.0 Introduction ... 8 1.1 Study Objective ... 8 1.3 Limitations ... 92.0 Theoretical Background and Motivation ... 10
2.1 United Kingdom Baseline Energy Statistics ... 13
2.1.1 Solid Fuels and Derived Gases ... 13
2.1.2 Petroleum ... 16
2.1.3 Natural Gas ... 19
2.1.4 Nuclear ... 22
2.1.5 Combined Heat and Power ... 24
2.1.6 Renewable Sources ... 26
2.1.7 Consumption Tread of Electricity ... 28
2.2 Electricity Contributors and Marketplace ... 33
2.3 Wind Energy in the UK... 40
3.0 Methodology ... 45
3.1 LCG- Levelised Bus-Bar Cost ... 45
3.2 Modern Portfolio Theory Basics ... 47
4.0 Results ... 49 4.1 LCG Results ... 49 4.2 MPT Results ... 52 5.0 Discussion ... 61 6.0 Conclusion ... 62 7.0 Bibliography ... 64
8.0 Appendix 1 Energy Statistics ... 65
8
1.0 Introduction
The energy industrials in the United Kingdom (UK) play a vital role in the economy by producing, transforming and supplying energy in its various forms to all different sectors. The way we produce our energy in the future has significant importance. Increasing populations resulting in more and more households connecting to the electricity and gas grids led to a demand for energy that was never so high. This has tested the existing transmission grid. The challenges for energy producers are great and immediate with society relying on energy every minute of every day. If the lights go out the costs are colossal, factories and workplaces cannot operate, perishable food would be lost, computer industry would hit meltdown and anti social behaviour would be a concern.
It is also widely accepted that the UK’s carbon dioxide levels need to be reduced to protect the environment. From families to government parties everyone is concerned with the rising energy prices. High energy costs have a damaging effect on the job industry and people’s quality of life in general. Every energy production comes with a price, they must be environmentally acceptable. Climate change, acid rain, possible radioactive emissions, effects of electricity pylons and wind turbines are just a few of the possible environmental issues that have been raised with the introduction of a new energy source. The energy policy challenges are often tested with the increased import of energy consumption while the UK’s own reserve runs short. The government could decide to open up more coal mines, however that may be more expensive in the long term while there is still abundant of carbon resources. The issue here is the cut of temperature increase on the Gross Domestic Product (GDP). Nuclear energy may be the answer, with low carbon dioxide emissions, although this creates radioactive waste and has from time to time been politically unpopular, especially following the recent event of the nuclear accident at Fukushima in March 2011.
1.1
Study Objective
This investigation focuses solely on how the levelised cost of generation (LCG) of a wind power project has an effect on the modern portfolio diversity in the UK. It also analysis the energy consumption in the UK, and how it changed in the last 40 years. With energy security a hot topic due to declining resources, relatively cleaner carbon sources, could wind energy change the portfolio and provide more energy protection for the UK.
The study aims to analyse LCG and different portfolio diversity of past, present and future portfolio generation
The central questions to be addressed are as follows:
• Are the internal resources running out in the UK?
• With the UK government pressing ahead with the largest nuclear programme for a generation, is this a good initiative?
• Would the rejected wind energy make any difference on this portfolio? • Can wind energy affect our future consumption?
9
1.3 Limitations
• The presented data for these generating costs are taken from “UK Electricity generation costs update” published in June 2010 by Mott MacDonald engineering and development
consultancy. All standard deviations, variance and covariance are calculated from “1st OF A KIND” appendix in the document.
• Due to lack of resources and time restrictions certain parameters have not been considered throughout the MPT calculations (see section for more information).
• A discount rate was taken as 12 percent
• Only ROCs are considered in calculations with no capital grants for other generators investigated
10
2.0
Theoretical Background and Motivation
Modern portfolio theory or portfolio diversity is a strategy used by electric utilities for combining different electricity generator assets to one portfolio. The goal of this dissertation is to determine the rate for the LCG of different generators and learn how to maximise the expected return from a portfolio diversification while minimising the risk. Refused wind energy throughout the UK and future exploited wind farms is examined and how it could improve the current portfolio.
Levelised Cost of Electricity
The levelised cost of electricity generation is defined as the proportion of the net present value of total capital and operating costs of a generation plant to the net present value of the net generated electricity by the generator over its operating life. From this definition we can derive the following equation (Mott MacDonald, 2010).
LCG = TOTC / NPVEG (1.1)
LCG Levelised Cost of Generation (£/MWh)
TOTC Net Present Value (NPV) of total costs (capital and operating) (£) NPVG NPV of net electricity generation (MWh)
TOTC =
Σ
(TCn / (1 + r) n) (1.2)n = 1
TOTCn Net Present Value (NPV) of total costs (capital and operating) (£)
TCn Total costs for Power in operating year n (capital and operating costs) (£)
Gn Net generation in operation year n
n Operation year
r Annual discount rate
I Operating life of plant
NPVG =
Σ
(Gn / (1 + r) n) (1.3)11 Modern Portfolio Theory (MPT)
MPT is commonly used by financial investors to create a vigorous portfolio mix that maximise profit working under a variety of uncertainties and volatile economic outcomes. MPT was first introduced by Harry Markowitz in 1952 in a paper titled “Portfolio Selection” published in the Journal of Finance. MPT’s purpose is to show diversification in the number of mix of different generators in this study. To phrase it differently, efficient portfolios are described as the following: they maximise the expected return for any given level of risk, while minimising risk for every given level of expected return (Awerbuch, 2003). One of the most important items when considering MPT is that portfolios should not be selected by just considering the characteristics of certain securities; instead, portfolio has to be selected by considering the overall risk of proposed portfolios on how the correlation affects them.
MPT was originally envisioned in the context of financial portfolios, where it refers E(rp), the expected portfolio return, to σp, the total portfolio risk, defined as the standard deviation of past returns. A basic illustration below using a simple, two generator/stock portfolio were the expected portfolio return E(rp), is weighted average of the individual expected returns E(ri) of the two securities (Awerbuch, 2003).
E (rp) = X1.E(r1) + X2.E(r2) (1.4)
Where:
E (rp) is the expected portfolio return
X1,X2 are the proportions (%) of the assets 1 and 2 in the portfolio; and
E(r1), E(r2) are the expected returns for assets 1 and 2; particularly the mean of all possible
outcomes weighted by the probability of occurrence. An example, for asset 1 it can be written: E(r1) = ∑piri where pi is the probability that outcome i will occur, and ri is
the return under that outcome.
Portfolio risk, σp, is also a weighted average of the two securities in these two generators, but is tempered by the correlation coefficient between the two returns:
σp = √(x1 2 σ1 2 +x2 2 σ2 2 +2x1x2ρ12 σ1 σ2) (1.5)
Where ρ12 is the correlation coefficient between the two return streams and σ1 σ2 is the SD of the
periodic returns to asset 1 and 2 respectively. From this the co-variation of two return assets can be calculated by COV12 = ρ12 σ1 σ2. From this the equation can be written as
σp = √(x1 2 σ1 2 +x2 2 σ2 2 +2x1x2COV12) (1.6)
Properly designed portfolios yield a portfolio effect with less risk achieved in the portfolio through diversification. Diversification occurs whenever the returns of two or more securities are less than perfectly correlated (ρ<1.0).
12 Multiple-Asset Portfolio
The portfolio selection method outlined for the two asset portfolio mix can easily be extended to portfolios with 3 or more securities or assets. The mathematical formula in equation 1.5 is extended where each square SD is multiplied with its square proportion in the mix. The relevant covariation terms are added according to the pattern 2.Xi.Xj.COVij. Therefore for multiple assets equation 1.5
becomes N N σp 2 = ∑ ∑ Xi Xj ρij σi σj (1.7) i=1 j=1 Equation 1.1 is extended to N E(rp) = ∑ Xi E (ri) (1.8) i=1
From this we can calculate the portfolio expected return and the portfolio standard deviation. Also using the solver function in Microsoft Excel to maximise the sharpe ratio which is the ratio of expected return to standard deviation. Sharpe ratio is how much excess return can be received for the extra volatility that is endured for holding more risky portfolio.
13
2.1
United Kingdom Baseline Energy Statistics for Energy Sources used in
the Portfolio
Since the main aspect of this dissertation is showing the result of unexploited wind potential, a closer synopsis of energy sources that will be used in our portfolio analysis will be reviewed first. The information sourced throughout this chapter is from Department of Energy & Climate Change (DECC) Digest of United Kingdom Energy Statistics (DUKES) 2011 and Long term treads 2011 unless otherwise stated. (Department of Energy & Climate Change, 2011).
2.1.1 Solid Fuels and Derived Gases Coal Production and Trade
Solid fuel such as coal has a history throughout the UK that would match any confrontation of countries throughout the world. Due to its large abundance in Britain, coal accounted for the majority of the energy consumption in the middle 1900s. From Graph 2.1 below the consumption of coal was 84% of total energy produced in 1970. This however changed when the supply of oil and natural gas became more accessible and many pits were considered uneconomic. A bitter coal miner’s strike occurred in 1984, with the government, under the leadership of Margaret Thatcher, determined to close the uneconomical mines. A triumphant government saw employed miners returning to work exactly a year later and restoring the coal production in close proximity to 1983 levels. When the phasing out began and petroleum and natural gas production was offset against the coal energy production, consumption fell in 1998 to a merely 10%.
Today’s tread shows coal producing 7.3% of total energy production while imports have exceeded UK coal production since 2001. This rapid growth in imports after 2001 continued and in 2006 reached a record high level of 51 million tonnes. Since 2005 nearly half of UK’s coal is imported with the majority of it being used for coal-fired power stations.
0 20,000 40,000 60,000 80,000 100,000 120,000 140,000 160,000 180,000 1 9 7 0 1 9 7 2 1 9 7 4 1 9 7 6 1 9 7 8 1 9 8 0 1 9 8 2 1 9 8 4 1 9 8 6 1 9 8 8 1 9 9 0 1 9 9 2 1 9 9 4 1 9 9 6 1 9 9 8 2 0 0 0 2 0 0 2 2 0 0 4 2 0 0 6 2 0 0 8 2 0 1 0 Coal Production Imported
14 Deep, Surface Mined and Imported Coal
As with coal production, coal consumption within the UK has also seen a general decline over the last 40 years, as the UK’s energy mix has become more diverse. With higher coal prices, natural gas and oil production has become more attractive to purchase for generation use. This resulted in the coal industry in Britain to enter a state of neglect. Power stations, coke ovens and blast furnaces have diverted from using coal for their energy consumption with the domestic customer relying on gas. Coal is however still mined at a number of locations in the Midlands and the North. In the 1970 when solid fuels supplied 31.7%of the final energy consumption 136,686 thousand tonnes of coal was deep mined while 10,509 thousand tonnes was surfaced mined. This figure has changed significantly in the last decade. At present 7,390 thousand tonnes deep mined while 11,026 mined from the surface. This shows surface mining has remained constant with its average from the 40 year span of 15,354 thousand tonnes. So where is coal imported from? 9,750 thousand tonnes is sourced in Russia with the remainder coming from Australia, Columbia, United States and South Africa (Table 2.1).
Table 2.1: Import of Coal in 20101 (Thousand tonnes) Country
Steam Coal
Coking
Coal Anthracite Total
Russia 9,356 351 43 9,750
Colombia 6,360 66 11 6,437
United States of America 2,390 2,132 - 4,522
Australia - 3,235 12 3,247
European Union2 881 1 72 954
Republic of South Africa 781 - - 781
Canada - 434 - 434
Indonesia 275 - - 275
Other countries 87 16 - 103
People's Republic of
China - - 17 17
Total all countries 20,130 6,235 155 26,520
1. Country of origin basis
15 Coal Consumption
The top two coal consuming EU countries are Poland and Germany, which account for 26 percent and 18 percent of the EU consumption, respectively. Even though the production of coal has declined in the UK, it still remains the third largest consumer of coal in the EU, trailing behind Germany by only one percent. 95% of the coal consumption was from the transformation sector (Energy Sector) in 2010. This was a result of greater use for coal fired generators. The largest final consumer is the industry sector, accounting for 69 percent of the total consumption in 2010. Within the industrial sector steam coal was most utilized for cement, glass and brick production. With the major shift on reducing C02 emissions coal consumption has dropped from 147,195 thousand tonnes consumed in 1970 to 18,417 in 2010. From Table 2.2 it can be observed that the power stations are utilising coal in large quantities, while in Table 2.3 the industry abandoned coal as its main fuel source.
Table 2.2: Inland Consumption of Solid Fuels (2) - Producers (Thousand tonnes) Coal consumption by fuel producers
Primary Secondary Collieries Power stations (1) Coke ovens and blast furnaces Other solid
fuel plants (3) Gas works Total
1970 1,916 77,237 25,340 4,150 4,280 112,923
1980 663 89,569 11,610 3,022 - 104,864
1990 117 84,014 10,852 1,544 - 96,527
2000 12 46,853 8,685 540 - 56,090
2010 5 41,505 6,632 831 - 48,973
Table 2.3: Inland consumption of solid Fuels (2) - Final Consumption (Thousand tonnes) Final consumption Coal (1) Coke and breeze Other solid fuel (3)
Industry Domestic Other Total
1970 19,613 20,190 4,159 43,962 18,090 3,203
1980 7,898 8,946 1,752 18,596 6,221 2,252
1990 6,280 4,239 1,211 11,730 7,637 1,214
2000 1,876 1,883 82 3,841 6,301 521
2010 1,715 718 58 2,491 3,424 311
(1) Up to 1986 power stations include those in the public electricity supply, railways and transport industries. Consumption by other generators is included in final coal consumption. From 1987, coal consumption at power stations also includes other
generators' consumption, which is therefore excluded from final coal consumption (see also Table 2.7). From 1999 includes coal consumption for heat sold to third parties.
(2) 2008 is 4 days longer than the standard 52 week statistical reporting period (SRP) for January to December 2008. This is to enable a smooth transition to publishing data on a calendar month basis from January 2009 rather than 4 and 5 week SRPs used for previous years.
16 2.1.2 Petroleum
Past to Present
Hydrocarbon and other substances such as sulphur form one of the most important products we use everyday, Petroleum. In its natural form when first extracted from the earth’s crust it is usually named as crude oil, which can be discovered clear, green or black. There is several major oil producing regions throughout the world, with Kuwait and Saudi Arabia having the lion’s share of crude oil fields. Other bordering countries such as Iran and Iraq also supply a large portion of the world’s crude oil production.
Petroleum consumption in the UK is one of the most unstable sources of energy in the country’s market as seen in graph 2.2. From 1970 until 1973 petroleum rose steadily, even though there was strong growth of natural gas and nuclear energy. Following the same pattern as coal the industry saw a decline in consumption for the next ten years. Before 1974 the indigenous production of crude was negligible until the discovery of the Northern sea resource. From the imports peaking in 1973, a rapid shift of imports and production emerged with its indigenous production peaking in 1986, showing the transformation of surface net imports to exports. Production of the northern sea oil refinery declined in the following years particularly in 1988 due the effects of the Piper Alpha platform explosion resulting in 167 deaths. Regarded as one of the worst offshore oil disasters in the modern era, the production of oil stayed relatively low until 1991. This was due to more stringent safety measures. The industry recovered after that with its record peak of 137,099 million tonnes in 1999 but since then it has spiralled downwards to 62,962 million tonnes in 2010. On average, crude oil production in the UK has been decreasing by around 7 percent a year while the North Sea production remains high. At present the UK’s production capacity is the largest within the EU, trailing behind Norway in the EEA. Questions have been raised as to why the UK imports so much oil when its production is sufficient to meet the demands. Crude oil is imported into the UK for various commercial reasons, one of the principal reasons being its sulphur content. Lighter hydrocarbon fuels from the North Sea crude oil produce products such as motor spirits and other transport fuels which have a greater financial gain.
(1) Includes natural gas liquids and feedstocks 0 20,000 40,000 60,000 80,000 100,000 120,000 140,000 160,000 1 9 7 0 1 9 7 2 1 9 7 4 1 9 7 6 1 9 7 8 1 9 8 0 1 9 8 2 1 9 8 4 1 9 8 6 1 9 8 8 1 9 9 0 1 9 9 2 1 9 9 4 1 9 9 6 1 9 9 8 2 0 0 0 2 0 0 2 2 0 0 4 2 0 0 6 2 0 0 8 2 0 1 0 Imported Production Exports Graph 2.2: Production, Exports and Imports of Crude Oil 1970-2010 (1) (Thousand tonnes)
17 0 20,000 40,000 60,000 80,000 100,000 120,000 1 9 7 0 1 9 7 2 1 9 7 4 1 9 7 6 1 9 7 8 1 9 8 0 1 9 8 2 1 9 8 4 1 9 8 6 1 9 8 8 1 9 9 0 1 9 9 2 1 9 9 4 1 9 9 6 1 9 9 8 2 0 0 0 2 0 0 2 2 0 0 4 2 0 0 6 2 0 0 8 2 0 1 0 Imported Refinery output Exports
Imports, Exports and Refinery Output
In 1991 crude oil imports exceeded exports for the first time since 1980, but the exporting tread regained normality and continued to rise reaching their highest net export production during 1999 as seen in graph 2.3. However, the declining level of crude oil production since 2000 has seen the export of crude oil falling over the last 10 years. From 2005 the UK has become a net importer of primary oils for the first time since 1981 apart from the early 1990s scenario when imports outweighed exports during 1991. UK’s imported crude oil is sourced from Norway due to its similarity; the crude oil type matches well with the existing refineries based in the UK.
A large proportion of the UK’s primary oil production was processed into petroleum products by the UK’s refineries. From peaking in 1973 the refinery throughput fell to pre-1970 levels together with the refinery output. The dissimilarity between refinery throughput and output is refinery use of fuel and its gains/losses; this however is not shown in Graph 2.3. Since 1983 the oil refinery throughput has increased production to new pinnacle levels of 97,023 thousand tonnes in 1997, but closures to the Gulf Oil refinery late that year resulted in 4% reduction in output the following year. The following year saw the output reduced by an even further 6% making it comparable to 1989 statistics. The existing refineries raised their capacity to offset the difference left by the closure of Gulf Oil and Shell Haven refineries to 89,821 thousand tonnes in 2004, but since then in 2010 the refinery throughput is the lowest since 1970, 5% lower than the previous low in 1983.
(1) Excludes products used as fuel within refinery processes
18 0 5,000 10,000 15,000 20,000 25,000 1 9 7 0 1 9 7 2 1 9 7 4 1 9 7 6 1 9 7 8 1 9 8 0 1 9 8 2 1 9 8 4 1 9 8 6 1 9 8 8 1 9 9 0 1 9 9 2 1 9 9 4 1 9 9 6 1 9 9 8 2 0 0 0 2 0 0 2 2 0 0 4 2 0 0 6 2 0 0 8 2 0 1 0
Since the late 1970s the UK was a net exporter of oil products apart from the increased demand for oil products during the coal strike in 1984. The increased net exports of products during the early and mid 1990s came about due to the increase of refinery outputs. However, following the closure of oil refineries in 1997, exportation was abridged for a number of years. The industry recovered and exported oil products reached a new peak of 26,755 thousand tonnes in 1997. Apart from the 1984 episode, exports of oil products have exceeded imports every year since 1974.
Since the main aspect of this dissertation is showing the results of unexploited wind potential, a closer synopsis of petroleum within the electricity generation system must be analysed. Petroleum products delivered for usage by power producers has reduced significantly from 12.60 million tonnes in 1970 to 1.14 million tonnes in 2010. The only notable change happened during the 1984 coal strike when 20.91 million tonnes was utilized. This shows the main usage of petroleum products remains concentrated in the transport sector.
19 2.1.3 Natural Gas
Dash for gas
Compared with coal, natural gas consumption in 1970 only accounted for 5.5 percent of all fuels consumed. The steady growth in gas consumption with an indigenous production bolster showed how valuable the product was when it outstripped petroleum consumption in 1996. Natural gas peaked during 2004 when it accounted for more than 41 percent of all fuel consumed in the United Kingdom. However the increase in gas prices resulted in consumption being reduced to 38 percent, mainly due to gas fired electricity production changing to coal generation. Its level in 2010 did recover to 43 percent but this was due to some production changing back from coal to gas due to the high demand required for the cold winter. The production of natural gas however has been in decline since the turn of the decade, with its production at about half the level that was produced in 2000. Relatively speaking the gas production has fallen off at a rate of about 6 percent per year, but the UK is still one of the largest gas producers in the EU and accounting for 2 percent of global production.
Imports and Exports
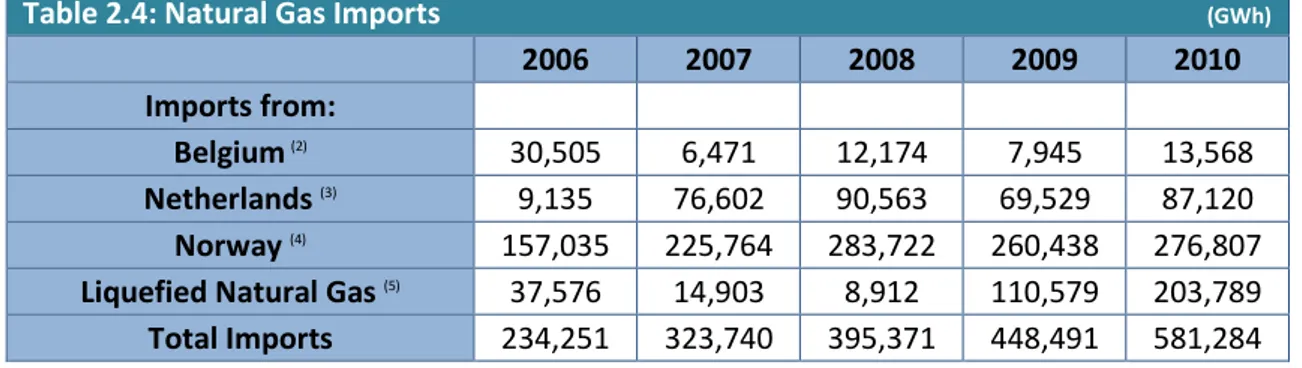
In 1992 the UK first started to export natural gas from its share of the Markham gas field, first to the Netherlands and then in 1995 to the Republic of Ireland. The volume of exports was almost six times the volume of imports in 2000 assisted by the UK-Belgium interconnector opening in 1998. Norway, Belgium and the Netherlands contribute to the UK’s imported gas by pipelines while the increasing import of Liquefied natural gas (LNG) is transported by ship. Since 2004 the UK has been a net importer of gas with imported LNG increasing in 2005. This was the first time the UK imported LNG since the early 1980s. By 2009 with two new LNG import facilities operating, LNG accounted for 25 percent of gas imports. This figure increased to 35 percent in 2010 with LNG imports exceeding pipeline natural gas for the first time in September 2010.
(1) In most years production of town gas is less than consumption because of transfers into town gas of North Sea and imported methane. (2) Includes colliery methane.
(3) Before 1977 imports were of liquefied natural gas. These imports continued until the early 1980s. 0 200,000 400,000 600,000 800,000 1,000,000 1,200,000 1,400,000 1 9 7 0 1 9 7 2 1 9 7 4 1 9 7 6 1 9 7 8 1 9 8 0 1 9 8 2 1 9 8 4 1 9 8 6 1 9 8 8 1 9 9 0 1 9 9 2 1 9 9 4 1 9 9 6 1 9 9 8 2 0 0 0 2 0 0 2 2 0 0 4 2 0 0 6 2 0 0 8 2 0 1 0 Production Imports Exports
20
Table 2.4: Natural Gas Imports (GWh)
2006 2007 2008 2009 2010
Imports from:
Belgium(2) 30,505 6,471 12,174 7,945 13,568
Netherlands (3) 9,135 76,602 90,563 69,529 87,120
Norway (4) 157,035 225,764 283,722 260,438 276,807
Liquefied Natural Gas (5) 37,576 14,903 8,912 110,579 203,789
Total Imports 234,251 323,740 395,371 448,491 581,284
Table 2.5: Natural Gas Exports (GWh)
2006 2007 2008 2009 2010 Exports to: Belgium (2) 60,195 51,390 45,949 62,084 95,932 Netherlands(6) 3,371 6,358 10,389 13,094 15,830 Norway(7) - 153 389 266 158 Republic of Ireland(8) 47,247 50,972 54,260 54,357 56,266 Total Exports 110,813 108,873 110,987 129,801 168,186
Total Net Imports(1) 123,438 214,867 284,384 318,690 413,098
(1) A negative figure means the UK was a net exporter of gas.
(2) Physical flows of gas through the Bacton-Zeebrugge Interconnector. In tables 4.1 to 4.3 the commercial flows of gas through the pipeline are used. Commercial flows are the amounts of gas that companies requested be supplied through the pipeline. Net imports are the same whichever measurement is used.
(3) Via the Bacton-Balgzand (BBL) pipeline. Commissioned in November 2006.
(4) Currently via the Langeled and Vesterled pipelines, the Tampen Link (from Statfjord to FLAGS) and Gjoa/Vega (to FLAGS).
(5) From various sources to the Isle of Grain and Gasport Teesside.
(6) Direct exports from the Grove, Chiswick, Markham, Minke, Stamford and Windermere offshore gas fields using the Dutch offshore gas pipeline infrastructure.
(7) With effect from September 2007, UK gas from the Blane field to the Norwegian Ula field for injection into the Ula reservoir.
21 Utilization of Natural Gas & LNG
During 2010 natural gas demand was 34 percent for the operation of electricity generation. Most gas used in electricity generation is for combined cycle gas turbines (CCGT) stations. The usage of gas station depends on relative price of coal and gas. During 2005 and 2006 gas use fell but in 2007 it rose again by 14 percent. The domestic sector consumed over a third of gas demand in 2010, while public services such as schools and hospitals accounted for 3.5 percent of total demand. The use of gas in the domestic sector is reliant on harsh winter conditions. Freezing conditions in December 2010 saw an increase of 17 percent compared to the same time in 2009. As for the industrial use of gas it was on a downward trend from 2000-2007, apart from a minor recovery during 2003. The economic crisis in 2008 saw the demand fall by an incredible 16 percent in 2009, from 139 TWh to 116 TWh. The outlook in 2010 was more promising showing a growth of 4.8 percent to make the overall consumption of 122 TWh. The usage in the public administration and commercial sector increased also in 2010, with an increase of 3.5 percent and 8.4 percent respectively mainly due to the freezing wintery conditions.
Graph 1 illustrates the consumption of gas within each sector which amounted to 1,092,507 GWh during 2010. The Transformation sector which includes electricity generation, blast furnaces used 395,625 GWh, while it used 69,462 (Energy industry use) for internal usage during that year. Losses amounted to 18,737 GWh whereas the industry sector consumed 121,963 GWh on Iron, steel, textiles and other engineering areas. The vast sector in the graph of consumption of gas came from the domestic, public administration and commercial division which is merged together into the “Other” category.
Other: Domestic, public administration, commercial, agriculture, Miscellaneous
Transformation Energy industry use Losses
Industry Other
Non energy use Graph 2.6: Total Demand of Gas 2010
22 2.1.4 Nuclear
The British nuclear industry plays an important role in the United Kingdom energy balance. Its low carbon emissions helps the UK meet important EU goals while having a secure supply of electricity. Independent studies have shown nuclear energy’s full lifecycle carbon emissions, including construction of plant, uranium mining, milling and enrichment, fuel fabrication as well as decommissioning, are an insignificant proportion in relation to those caused by fossil fuels (Nuclear Industry Association, 2012). According to the Nuclear Industry Association 70 percent of the UKs low-carbon electricity is sourced from nuclear. The power generated by existing power stations avoids 40 million tonnes of carbon dioxide emissions a year, which is comparable to taking nearly half of Britain’s cars off the road.
Production
The UK currently has 10 operating power stations with 18 reactors. With the exception of one station all have twin reactors. Oldbury power station in South Gloucestershire has two reactors with only one working. There are three different types of stations, 2 Magnox stations which were the first operational power stations in UK, 7 Advanced Gas-cooled Reactors (AGRs) which were the second generation of built power stations and the latest addition is western European’s newest reactor coming on stream in 1995, the Pressure Water Reactor (PWR) at Sizewell in Suffolk. Nuclear Decommissioning Authority (NDA) owns the two Magnox stations while the seven AGRs and the new PWR are owned and operated by EdF Energy (Nuclear Industry Association, 2012).
With gas and coal prices fluctuating, nuclear energy is perceived much more attractively now than it has been in the past. One positive aspect regarding nuclear energy is that uranium is a widespread resource which can be located in stable and friendly countries like Australia, Canada and USA where the likelihood of conflict is at a minimum. Uranium enhancement in the UK is provided by Urenco using highly competent technology. The manufacturing of the power reactor fuel is located at one of UK oldest historically renowned plants, Sellafield.
Waste Supervision and Decommissioning
Due to the UK entering the nuclear industry at an early stage the move for decommissioning plants has started. In 2005 the NDA was created to manage the cleanup of old historic nuclear power stations. The organisations are responsible for the operation of the two stations as mentioned before but also taking down of nuclear facilities which are no longer operational. Within the next 15 years nine of UKs nuclear power stations are due to close. Large investment by the government or subsidies agreed is required to support the development of new nuclear power stations.
Waste management is also a very important issue when looking at nuclear energy. Nuclear waste is divided into three types:
Low-level waste (LLW) includes radioactive materials which might be contaminated such as protective clothing from nuclear facilities or hospitals. The majority of UKs LLW is compacted and stored in a secure storage facility near Drigg in Cumbria.
Intermediate-level waste (ILW) consists of solid and liquid materials from the furl reprocessing in a nuclear power station. This is also stored in stainless steel containers and stored at the site where it is produced.
23
High-level waste (HLW) is the concentrated waste produced when reprocessing nuclear fuel. It is store in liquid form in stainless steel tanks before it is turned into glass blocks and encapsulated into welded stainless steel containers.
Nuclear energy has being a primary substitute for the coal industry in the 1980s and 90s when it peaked at 90,590 GWh in 1998. Since then the usage has been descending due to the
decommissioning of plants and maintenance work.
0 10,000 20,000 30,000 40,000 50,000 60,000 70,000 80,000 90,000 100,000 1 9 7 0 1 9 7 2 1 9 7 4 1 9 7 6 1 9 7 8 1 9 8 0 1 9 8 2 1 9 8 4 1 9 8 6 1 9 8 8 1 9 9 0 1 9 9 2 1 9 9 4 1 9 9 6 1 9 9 8 2 0 0 0 2 0 0 2 2 0 0 4 2 0 0 6 2 0 0 8 2 0 1 0
24 2.1.5 Combined Heat and Power
The Variations
Combined heat and power (CHP) is the simultaneous generation process of using heat and power in the same process. CHP utilizes a variety of technologies ranging in different size and capacity for fuel consumption. There are a few basic elements involved in the production of CHP, a main delivery service such as a gas turbine or steam engine which drives an electrical generator, with the heat generated from the process captured and used for additional production in the industry. This heat could be used for hot water, space heating or cooling proposes. There are two major factors affecting the production of CHP in an economical aspect, the relative cost of fuel primarily gas and the value of producing the electricity from the fuel. Energy price trends that are related to CHP schemes vary from scheme to scheme, depending on the size and sector of the scheme. In the last few years there has been an increase in CHP schemes due to the increase in the price of electricity relative to that of gas. CHP is typically sized to make use of the heat available in the system while connecting to a low voltage distribution system. The loss through transmission and distribution are kept to a minimum compared with large scale conventional power stations. There are four different types of CHP, steam turbine, gas turbine, combined cycle systems and reciprocating engines.
Fluctuation within the CHP Capacity
CHP installed electrical capacity at the end of 2010 was 5,989 MWe, an increase of 375 MWe from 2009. During 2010, 107 new CHP schemes came into action while 34 existing schemes operating during 2009 closed or were left stationary during 2010. However the 26,083 GWh of electricity generated in 2010 was a decrease of 1.4 percent on 2009 figures. In 2010 the commercial and industrial sectors electrical output from CHP accounted for 12 percent of its overall electricity consumption. CHP generated more heat than electricity in 2010 recording a 47,815 GWh, an increase of 340 GWh from 2009.
(1) Heat generated: These are calculated using gross calorific values; overall net efficiencies are some 5 percentage points higher.
(2) Electricity generate: (CHP QHO ) basis from 1995 onwards
0 10,000 20,000 30,000 40,000 50,000 60,000 70,000 80,000 90,000 1 9 7 7 1 9 8 3 1 9 8 8 1 9 9 1 1 9 9 3 1 9 9 4 1 9 9 5 1 9 9 6 1 9 9 7 1 9 9 8 1 9 9 9 2 0 0 0 2 0 0 1 2 0 0 2 2 0 0 3 2 0 0 4 2 0 0 5 2 0 0 6 2 0 0 7 2 0 0 8 2 0 0 9 2 0 1 0 Heat generation Electricity generation
25 CHP Installation and Usage
A vast portion of fuel used in CHP schemes to generate electricity and heat are from natural gas with 75,481 GWh used to generate electricity and heat in 2010. The consumption of natural gas in general for CHP has been on the decline for the last number of years. Coal and oil are following the same trend as gas with the renewable fuels sector increasing its capacity from 3,183 GWh in 2006 to 6,518 in 2010. Over the last 10 years the refineries sector has increased the use of natural gas instead of oil. There has also been an increase of refinery gas used since 2005, which coincides with the market increase of heavy fuel oil. This illustrates an economical benefit for refineries selling rather than burning the heavy fuel oil it produces.
Table 2.6: Overall Fuel Used to Generate Electricity and Heat in CHP Installations (GWh)
2006 2007 2008 2009 2010 Coal (2) 4,356 4,120 4,274 3,679 3,548 Fuel oil 3,558 2,140 2,065 2,146 1,859 Natural gas 86,126 85,016 84,103 77,936 75,481 Renewable fuels (3) 3,183 3,219 4,717 5,458 6,518 Other fuels (1) 25,124 24,142 23,674 22,293 22,916
26 2.1.6 Renewable Sources
In this section the consumption of renewable energy contribution to the United Kingdom’s energy requirement is investigated. Renewable energy provided 6.8 percent of the electricity generated in the UK in 2010. To insure every source of energy is counted for in the system, digest covered all aspects of renewables from geothermal, active solar even the use of liquid biofuels for transport. Some of these sources under international definitions are not counted as renewable sources or only partly counted but are in Digest. To meet the UK’s 15 percent target introduced in the 2009 EU renewables directive a large increase on electricity generated in the renewable sector has been recorded.
Setting The Scales
The volume of renewables used to generate electricity was at a steady rate of 6.5 percent between 1990 and 1996 but this rate swiftly elevated in the following seven years averaging a 14.5 percent increase. Since 2003 the figure reduced to 11 percent per annum. In 2010 the largest contribution to renewables in input terms was from biomass, accounting for nearly 83 percent, with wind generation and large scale hydro electricity production providing to the majority of the remainder. The rate of increase in the volume of renewables used is subjective to the usage of each fuel. Renewable sources such as wind and hydro consume similar volumes of power to create electricity whereas biomass resources need large resources of power during their transformation into electricity. As a result, with the overall figures, an increase in volume of biofuel used throughout the years had a more significant effect on the end result.
The development of the wind industry since 2000 has been the main contributor to the growth in electricity generated renewables, with an average of 27 percent annually. The rate of growth in electricity generation from renewables has averaged 10 percent a year. This takes into consideration a slight increase of 2.2 percent between 2009-2010, due to low wind speeds.
At the end of 2010 the installed renewable generation capacity reached 9,202 MW an increase of 15 percent for the previous year even though this excluded the capacity within conventional generation stations that used 390 MW for co-firing (Co-firing is the combustion of two different types of materials at the same time). The main provider to this increase was onshore and offshore wind, contributing 553 MW and 400 MW respectively. In capacity terms, wind was the most significant renewable technology for the last number of years. It provided 58 percent of renewable capacity in 2010 with hydro in second place supplying 18 percent.
Biomass Renewable Source Described Briefly
Landfill gas: Methane-rich gas formed from the decomposition of organic material is used to fuel reciprocating engines or turbines to generate electricity or used directly in kilns and boilers.
Sewage sludge digestion: In these projects the gas produced is used to maintain the optimum temperature, for example in CHP systems.
Domestic wood combustion: This is the use of logs in open fires, ”AGA”- type cooker boilers and other wood burning stoves.
Non-domestic wood combustion: This category is includes sawmill residues and furniture manufacturing wastages.
Energy crops and forestry residues: 1000s of hectares planted throughout the UK that contributes to a large portion of Biomass percentage. Short rotation Willow Coppice and Miscanthus are the most common crops used.
27
Straw combustion: Straw can be burnt in very high temperature boilers to supply heat, hot water and hot air systems.
All waste combustion: Waste from paper, cardboard, scrap tyres, poultry litter may be used in purpose built incinerators.
Co-firing of biomass with fossil fuels: This can be used to substitute 25 percent fossil fuels in a boiler without any major changes occurring.
Other biomass: Sewage sludge digestion, municipal solid waste combustion, animal biomass, plant biomass and co-firing with fossil fuels
Other biomass: Sewage sludge digestion, municipal solid waste combustion, animal biomass, plant biomass and co-firing with fossil fuels 0 5,000 10,000 15,000 20,000 25,000 30,000 1 9 9 0 1 9 9 1 1 9 9 2 1 9 9 3 1 9 9 4 1 9 9 5 1 9 9 6 1 9 9 7 1 9 9 8 1 9 9 9 2 0 0 0 2 0 0 1 2 0 0 2 2 0 0 3 2 0 0 4 2 0 0 5 2 0 0 6 2 0 0 7 2 0 0 8 2 0 0 9 2 0 1 0 Other biomass Landfill gas Total Hydro
Wind, wave and tidal
0.00 1,000.00 2,000.00 3,000.00 4,000.00 5,000.00 6,000.00 1 9 9 0 1 9 9 1 1 9 9 2 1 9 9 3 1 9 9 4 1 9 9 5 1 9 9 6 1 9 9 7 1 9 9 8 1 9 9 9 2 0 0 0 2 0 0 1 2 0 0 2 2 0 0 3 2 0 0 4 2 0 0 5 2 0 0 6 2 0 0 7 2 0 0 8 2 0 0 9 2 0 1 0 Other biomass Landfill gas Total Hydro
Wind, wave and tidal
Graph 2.9: Electricity Generated from Renewables 1990-2010 (GWh)
28 2.1.7 Consumption Tread of Electricity
The United Kingdom trend in inland consumption of electricity has changed since the 1970s era (See Graph 2.11). One important fact that must be mentioned before figures are discussed is that for a period up to 1987 data for conventional thermal electricity generated by industrial producers was not available.
Oil fuel input in 1972 hit its peak of 29 percent and had been on the decline since, apart from the glitch during the miner’s strike. The percentage of oil in fuel input since diminished from 11 percent in 1990 to 1.5 percent in 2010. Used in several co-firing petroleum coke with coal stations the figure is 0.4 percent lower than 2009.
Nuclear generation has a major part to play in the fuel input for electricity generation. From 1970 until 1998 nuclear has grown from 11 percent to its peak of 29 percent. The main hindrance with nuclear is outages for maintenance and closure of some older nuclear stations which affect its overall percent. From the early 2000s period nuclear has since reduced to an 18 percent share in 2010 market.
Natural gas use in supplying public power stations was only 0.11 million tonnes of oil equivalent in 1970 and didn’t increase considerably until the early 1990s. The main reason for this was legislation set down by the European Community restricted the use of natural gas. After this gas in electricity generation grew rapidly with its share of 2 percent in 1992 growing to 28 percent in 1998. During 1999 it surpassed nuclear (22.22 million tonnes of oil equivalent) and coal (25.51 million tonnes of oil equivalent) by having a 34 percent stake in the inland consumption of electricity, recording an input of 27.13 million tonnes of oil equivalent to the system. In 2010 its share had increased to 40 percent.
Coal has been a primary source supplying the largest fuel input for electricity generation during the 1970s until the early 1990s. In 1999 its share had fallen to 32 percent a significant difference from 65 percent ten years earlier in 1989. With outages in nuclear plants occurring in the 2000s and high gas prices, coal has being a regular substitute providing up to 28 percent electricity generation until 2005. A large increase in price of gas in 2006 saw coal utilized even more contributing 41 percent of production, but this figure has fallen back to 32 percent in 2010.
Other fuels such as biomass renewable sources, wind and hydro are the result of the gradually increasing percent of this division. In 1990 other fuels generated 1.7 percent compared with 8.1 per in 2010. The government objective of increasing renewable energy to meet EU targets has played a pivotal role in this increase, especially with the large creation of offshore wind farms.
29
(1) Fuel inputs have been calculated on an energy supplied basis -
(2) Oil: Includes oil used in gas turbine and diesel plant or for lighting up coal fired boilers, Orimulsion (until 1997), and refinery gas (from 1987). (3) Natural gas: Includes colliery methane from 1987 onwards.
(4) Other fuel: Main fuels included are coke oven gas, blast furnace gas, waste products from chemical processes, refuse derived fuels and other renewable sources.
Electricity Supply, Availability and Consumption
When an interconnector between France and the UK came on stream in 1986, the period where the UK was internally resourceful came to an end. This is not to say that they are reliant on other countries to source their electricity needs, at the peak of imported electricity in 1994 France contributed only over 5 percent of total electricity available in the UK. In 2010 net imports stands at 2.66 TWh compared with 16.89 TWh in 1994.
Consumption of electricity by the industry has remained fairly constant from 1975 accounting for a third of total consumption to just less than a third in 2010. Even though there has being an overall consumption percentage constant, there has been a 55 percent rise in electricity consumption from 1985-2005. During 2006 and 2007 the industry electricity consumption fell by 1 percent, before a small industry increase in 2008. The global recession affected the industry in 2009 when the consumption declined from 115.07 TWh in 2008 to 101.44 TWh in 2009, the lowest level seen since 1994. The outcome in 2010 was healthier with an increase to 104.92 TWh. The domestic sectors total consumption share was around 40 percent during the 1970s, declining to just over third in the 1980s. The domestic consumption stayed relatively stable during the 1990s until reaching a high of 36 percent in 2004. Since then it has remained around 34 to 35 percent apart from 2009 when the industry was affected by the recession and saw domestic consumption increasing to 36 percent. The overall volume of electricity consumed in the domestic sector has increased by 38 percent in the last 30 years. 0 20 40 60 80 100 120 1 9 7 0 1 9 7 2 1 9 7 4 1 9 7 6 1 9 7 8 1 9 8 0 1 9 8 2 1 9 8 4 1 9 8 6 1 9 8 8 1 9 9 0 1 9 9 2 1 9 9 4 1 9 9 6 1 9 9 8 2 0 0 0 2 0 0 2 2 0 0 4 2 0 0 6 2 0 0 8 2 0 1 0 Other fuels Natural gas Hydro/Wind Nuclear Oil Coal Graph 2.11: Fuel Input for Electricity Generation 1970-2010(1)(2)(3)(4) (Million tonnes of oil equivalent)
30
Electricity Generated and Supplied
The total gross electricity supplied by all generating companies has increased at an annual rate of 1.1 percent from 1970 until 2010. Conventional thermal power stations in 1970 created 88 percent of the gross electricity supplied. These stations output remained high until 1990 when new generating technologies came on stream. The development of nuclear generation increased from 10 percent of the gross electricity supplied by UK generators in 1970 to 27 percent in 1997. However as mentioned before nuclear’s share varied with outages for repairs and maintenance during the 2000 decade and stands at 15 percent in 2010. The growth in combined cycle gas turbine stations (CCGTs) has changed the course of gross electricity supplied, from its introduction in 1989; to supplying 36 percent in 1997 it has remained the front runner supplying 46 percent in 2010.
(1) Includes electricity supplied by gas turbines and oil engines. From 1988 also includes electricity produced by plants using renewable sources.
(2) Natural flow hydro, wind, wave and solar photovoltaic’s.
Commodity Balance of Electricity at Present
The total electricity supply in 2010 was 384 TWh, an increase of 1.1 percent on 2009. Over 99 percent of this electricity was home produced while under 1 percent was imports. Electricity supply is totally driven by demand, so with a recovering economy and a colder winter in 2010 supply demand increased. 0 50,000 100,000 150,000 200,000 250,000 300,000 350,000 400,000 1 9 7 0 1 9 7 2 1 9 7 4 1 9 7 6 1 9 7 8 1 9 8 0 1 9 8 2 1 9 8 4 1 9 8 6 1 9 8 8 1 9 9 0 1 9 9 2 1 9 9 4 1 9 9 6 1 9 9 8 2 0 0 0 2 0 0 2 2 0 0 4 2 0 0 6 2 0 0 8 2 0 1 0 Conventional thermal (1) CCGT Nuclear Non-thermal (2) Total
31 0 10,000 20,000 30,000 40,000 50,000 60,000 70,000 80,000 90,000 1 9 9 6 1 9 9 7 1 9 9 8 1 9 9 9 2 0 0 0 2 0 0 1 2 0 0 2 2 0 0 3 2 0 0 4 2 0 0 5 2 0 0 6 2 0 0 7 2 0 0 8 2 0 0 9 2 0 1 0 Other Hydro Wind Nuclear CCGT
Mixed or dual fired Oil fired
Coal fired
Losses
In the commodity balances losses, as a proportion of electricity demand in 2010 was 7.5 percent (27,042 GWh), which was slightly lower than in 2009 in which 27, 083 GWh was lost. There are three areas involved in losses. 22 percent was lost in transmission of high voltage transmission systems in 2010. The largest percentage came from the gateway to the public supply systems network and the customer’s meters. This figure amounted to 74 percent of losses. Theft or meter fraud made up the final 4 percent.
Plant Capacity
In 2010 there was an increase of 5,522 MW in the capacity of major power producers (MPPs). “Major power producers” is the terminology used to define companies whose prime purpose is the generation of electricity. “Other generator companies” classify companies who produce electricity as part of their manufacturing but whose main business is not to produce electricity. With the increase of wind capacity from 2008 major wind farm companies were included in MPPs.
The main reason for the increase in 2010 MPP capacity was the result of five new CCGT stations opening up. Wind industry also had a part to play in this increase, with a further 571 MW produced, largely due to Thanet offshore wind farm of 100 wind turbines with 300MW generated coming online. MPPs accounted for 92 percent of the total generating capacity in 2010. 85 percent of this capacity was from MPPs in England and Wales. Scotland produced 12 percent while the remainder 3 percent from Northern Ireland.
(1) Other generators as mentioned in plant capacity paragraph.
32 Plant Loads, Demand and Efficiency
On the 7th of December 2010 the maximum demand of 60,893 MW occurred, this being 1.1 percent higher than the previous winter maximum. Also needing to be considered when meeting this demand is how intensively each type of plant is used, in other words the measurement of the plant load factor. In 2010 the load factor for nuclear stations was 59.4 percent which was 6.2 percent lower than 2009. The main factor for this was due to maintenance outages at several stations. Load factor in general fell largely due to lower electricity demand in the past few years, coupled with an increase in capacity. The wind industry suffered in 2010, very low wind speeds reduced lower generation despite the increase in wind capacity (for more information see renewable sources section).
33
2.2
Electricity Contributors and Marketplace
Since the liberalisation of the electricity market in 1990 the market has developed rapidly with competitive prices between suppliers without administrative price caps or other regulatory interventions.
The energy industry is split up into five main parts:
1. Generators 2. The National Grid 3. Distribution companies 4. Supply companies 5. Consumers
The UK market is divided into:
• The wholesale market, this is where the generators, suppliers and large customers buy and sell electricity;
• The transmission and distribution networks at national and regional levels;
• The retail market, where energy suppliers sell to domestic and business customers throughout the UK.
From a supply approach the system works from 1 to 5, but wind being a generator often skips step number 2 and connects to the system locally compared to coal, gas and nuclear. The name describing this electricity generation is known as “embedded generation”.
Electricity Supply System in the UK distributed generation.
Generators
The source of all our power the generators are responsible for supplying the electricity. As mentioned in section 2.7 the UK major generators changed from burning massive amounts of coal, to the nuclear plants evolution and currently changing to gas controlling the capacity in the last 10 years. The decline in availability of these fuel resources and nuclear plants aging has seen renewable methods of generating faring more favourably.
The National Grid
The high voltage electricity transmission network which enable the bulk transfer of high voltage electricity around the country is owned and operated by the National Grid Transmission plc in England and Wales, while it’s the operator of the two electricity transmission networks in North and South Scotland who are owned by Scottish and Southern Energy and Scottish Power respectively. In Northern Ireland the transmission is run and owned by the Northern Ireland Electricity network. The electricity network comprises a mixture of underground cables to overhead power lines which are transported to regional electricity distribution networks that then deliver energy to the consumers on behalf of the suppliers. Additionally to these transmission cables there are 338 sub-stations where the voltage transformation interface between The National Grid and the Distribution Network Operator (DNOs) takes place. The National Grid charges electricity suppliers and generators for its service; with approximately 90 percent of the overall electricity demand is transmitted across its system (The National Grid, 2010).
34
Figure 2.1: Electricity transportation process and voltage transformation © The National Grid
Distribution Companies
Distribution companies which are also known as DNOs (Distribution Network Operators) are responsible for the pipes or cables in the road and the meters within customer’s property. Effectively the suppliers and distributors have contracts for the usage of these electrical services, where they offset the price to the paying customers. There are seven distribution companies operating twelve licensed distribution areas where they have a statutory duty to connect any customers requiring electricity within their area and to maintain the electricity supply to them.
ID Area Company
10 East England UK Power Networks
11 East Midlands Western Power Distribution
12 London UK Power Networks
13 North Wales, Merseyside
and Cheshire Scottish Power Energy Networks
14 West Midlands Western Power Distribution
15 North East England Northern Power Grid
16 North West England Electricity North West
17 North Scotland Scottish Hydro Electric Power Distribution
18 South Scotland Scottish Power Energy Networks
19 South East England UK Power Networks
20 Southern England Southern Electric Power Distribution
21 South Wales Western Power Distribution
22 South West England Western Power Distribution
23 Yorkshire Northern Power Grid
35 Supply Companies
In the UK there are over seventy licensed suppliers of electricity and gas that sell electricity to customers. These companies are branded products of the 18 Energy companies that control the supply throughout the UK. Some of these companies supply both gas and electricity. Customers can switch their electricity supplier at any time which promotes competition between companies. The distributers and supplies are sometimes owned by the same company who also may be involved in renewable projects throughout the country or offshore. This monopoly allows larger companies to offer lower electricity prices due to no DNOs electricity service tariff in their areas.
Other Electricity Industry Groups
ELEXON
In Great Britain Elexon administrates the wholesale of electricity balance and settlements. They handle all of the Great Britain’s electricity users as well as the energy companies that generate and supply the electricity. The Balancing and Settlement Code (BSC) documentation oversees these arrangements.
ENERGYWATCH
This free service provides advice to customers on gas and electricity supplier issues that cannot be solved directly with their suppliers. Its aim is to make sure customers are getting value for money.
OFGEM
OFGEM is the official independent regulating body for both electricity and gas industries with its primary purpose to protect the customers of electricity and gas services. It does this by trying to prevent industry monopolies taking place and ensuring competition between providers with prices available.
36 Wholesale Market and Fuel Mix
The design of the electricity wholesale market is much like a typical commodity market. Those who produce electricity sell it to suppliers who are the most important group as these are the contacts the customers have with the energy industry. The selling of electricity between generators and suppliers is done through bilateral contracts, over the counter trades and spot markets.
The inherent nature of electricity is an important issue since electricity cannot be stored in significant quantities. To ensure a secure supply of electricity the amount being produced and the amount being consumed on demand must equal at all times, in other words the system must balance. The electricity is traded in 30-minute blocks which continue until an hour before the start of each block, which is also known as the gate closure. Contracts on the amount of generation energy they agreed to produce is recorded and if it’s not generated they have to pay an imbalance penalty to cover the supply to the customers. The system operator which is the National grid has the responsibility of ensuring supply equals demand continuously as through bilateral trading this could not be sustained (Change, Department of Energy and Climate, 2010).
Investment in new technologies with relative low cost and low risk is supported by the government to improve competition between generators. It is a requirement from energy regulator OFGEM that customers are informed about the breakdown of how the electricity supplied to their homes has been generated. With renewable obligations, a certain percentage of green energy is acquired or significant penalties will arise.
NETA to BETTA – A Single Wholesale Electricity Market
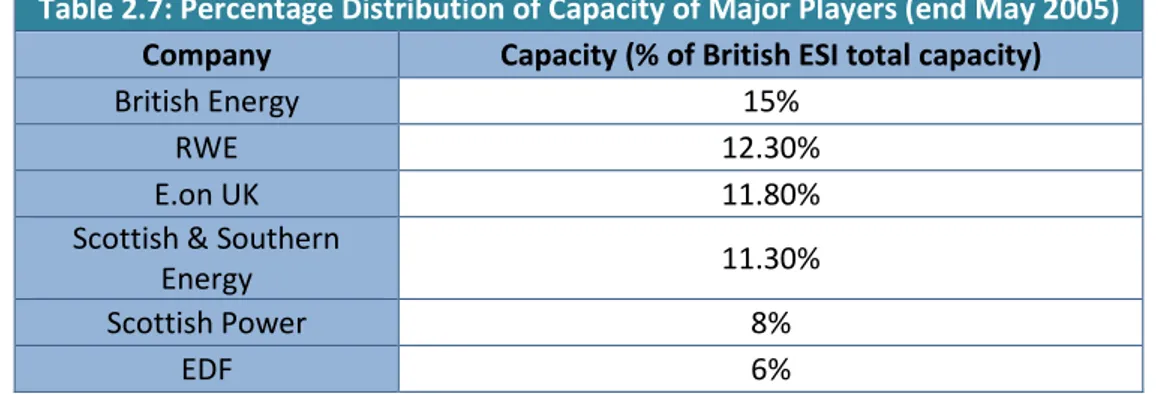
Without looking into the whole evolution of the British electricity market throughout the last 50 years, we will skip forward to 27th March 2001 when the New Electricity Trading Arrangement (NETA) was introduced in England and Wales. This voluntary bilateral market and power exchange was a sign of the government trying to reduce high electricity prices and reduce the concentration among generators. ELEXON was the operator of NETA, where all licensed electricity companies would abide by certain balancing and settlement codes. The majority of electricity traded under NETA was done through OTC (cover-the-counter) market and power exchanges. A trend started to follow in the coming years with generating and supply companies merging together and by 2005 the generation sector was decentralised leaving more than 40 major generators of which there were six major players dominating the British gas and electricity market (Cui, 2010).
Table 2.7: Percentage Distribution of Capacity of Major Players (end May 2005)
Company Capacity (% of British ESI total capacity)
British Energy 15%
RWE 12.30%
E.on UK 11.80%
Scottish & Southern
Energy 11.30%
Scottish Power 8%