Copyright ©2009 by the American Institute of Aeronautics and Astronautics Inc. All rights reserved
ISABE-2009-1276
Low Pressure System Component Advancements and its
Impact on Future Turbofan Engine Emissions
Konstantinos G. Kyprianidis, Dax Au
2, Stephen O.T. Ogaji, Tomas Grönstedt
1Department of Power and Propulsion, School of Engineering, Cranfield University Cranfield, Bedfordshire, MK43 0AL, United Kingdom
1Applied Mechanics
Chalmers University Gothenburg, Sweden
2Aerodynamics and propulsion
Institut Supérieur de l’Aéronautique et de l’Espace Toulouse, France
ABSTRACT
Within the European research project EnVIronmenTALly Friendly Aero Engines, VITAL, a number of low pressure system component technologies are being investigated. The emerging progress will allow the design of new power plants capable of providing a step change in engine fuel burn and noise. As part of the VITAL project a Technoeconomic, Environmental and Risk Assessment tool, the TERA2020, is being developed. Within this tool, means to assess the impact of component technology progress on the engine/aircraft system level has been implemented. Sensitivities relating parameters traditionally used to describe component performance, such as allowable shaft torque, low pressure turbine stage loading, fan blade weight and system level parameters have previously been published. The current paper makes an assessment of the impact of failing to deliver specific technology advancements, as researched under the VITAL project. The impact has been quantified, in terms of power plant noise and CO2 emissions.
INTRODUCTION
The aero engine industry is in constant search for more efficient and environmentally friendly power plants. Along with a continued progress in air traffic management, aircraft structures and aerodynamics, lighter and more efficient engines are being projected. Current and future engine noise and emission certification requirements make the search for
optimal engines truly multidisciplinary. Decision making on optimal engine cycle selection have to consider mission fuel burn, operating cost, engine and airframe noise and global warming impact. To conceive and assess engines in a variety of emission legislations, emission taxation policies, fiscal and Air Traffic Management environments, a Technoeconomic, Environmental and Risk Assessment (TERA) model has been developed.
VITAL is a new collaborative research project, running for four years, which aims to significantly reduce aircraft engine noise and CO2 emissions. It has a total budget of 91
million euros, including 51 million euros in funding from the European Commission. Snecma leads a consortium of 53 partners gathering all major European engine manufacturers: Rolls-Royce, MTU Aero Engines, Avio, Volvo Aero, Techspace Aero Rolls-Royce Deutschland and ITP, and the airframer Airbus.
Within the VITAL project ([1] and [2]), key technologies for three different turbofan architectures are being investigated targeting step reductions in engine CO2 and
noise emissions. As part of the VITAL effort, a number of universities cooperate on establishing a platform for multidisciplinary system analysis, the TERA2020 environment [3]. The tool is capable of evaluating the technology progress achieved within the project on engine/aircraft system level as well as to perform scenario studies of next generation turbofan engines. The activities within the VITAL project specifically target year 2020 entry into service engines, thus the acronym TERA2020.
Copyright ©2009 by the American Institute of Aeronautics and Astronautics Inc. All rights reserved Several efforts in the past have successfully targeted the
development of models capable of making multidisciplinary assessments of gas turbine engines at a preliminary design stage (such as [4], [5], [6], and [7]). However, the nature of these publications has been to convincingly present the capability of the tools by means of some application examples, rather than to focus on generating results that could be generalised.
The TERA2020 tool can be used to analyse the three VITAL configurations, i.e. the Direct Drive TurboFan, the Geared TurboFan and the Counter-Rotating TurboFan. The authors have already demonstrated in [10] how TERA2020 results can be quantified through the establishment of sensitivity factors. The sensitivity factors published in [10] allow rapid assessment of the impact of research on the three architectures. The sensitivities were formulated in such a way that they, whenever possible on a preliminary design stage, relate component design parameters with engine/aircraft performance. This approach distinguishes itself from the more simplistic approach of assuming an achievement on the module level. For instance, an LPT module weight reduction may be computed as a consequence of an increased stage loading parameter relating the stage loading directly to the aircraft performance rather than implicitly through module weight. In the current work, the previously published sensitivities are used for quantifying the impact of the component technologies researched under the VITAL project. More specifically, the impact of failing to deliver specific component improvements has been quantified, in terms of power plant noise and CO2 emissions, and will be presented
in latter sections of this paper.
NOMENCLATURE
Acronyms
CRTF Counter-Rotating TurboFan DDTF Direct Drive TurboFan
GTF Geared TurboFan LPT Low Pressure Turbine
LR Long Range
NEWAC NEW Aero engine Core concepts
SR Short Range
TERA Technoeconomic, Environemntal and Risk Assessment
VITAL EnVIronmenTALly Friendly Aero Engines
Symbols
c Blade chord
EPNL Effective Perceived Noise Levels F Thrust
h Blade height
s Blade pitch
SFC Specific Fuel Consumption SPL Sound Pressure Levels
SR Specific Range U Blade speed V Velocity W Aircraft weight Z Zweifel number α1 In-flow angle α2 Out-flow angle Δh Enthalpy change
Ψ Turbine stage loading parameter
Subscripts
N Number of flight phases M Number of noise sources tot Total
THE VITAL ENGINE CONFIGURATIONS
The VITAL project concentrates on new technologies for the low pressure system of the engine, which enables the development of low noise and low weight fan architectures for very high bypass ratio engines. To achieve these objectives, the VITAL project will investigate three different low pressure configurations, leading to low noise high efficiency power plants. The three configurations are the Direct Drive TurboFan supported by Rolls Royce, the Geared Turbofan by MTU and the Contra Rotating TurboFan by Snecma, illustrated in Figure 1, Figure 2 and Figure 3 respectively.
The DDTF architecture offers a re-optimised trade-off between fan and turbine requirements considering the low weight technologies introduced by the VITAL programme. The GTF considers combining a fan with a reduction gear train, to allow different rotating speeds for the fan on one hand, and the booster and turbine on the other. The CRTF offers a configuration with two fans turning in opposite directions, allowing for even lower rotational speeds, since the two fan rotors split the loads involved.
Copyright ©2009 by the American Institute of Aeronautics and Astronautics Inc. All rights reserved Figure 1 Direct drive turbofan architecture [1]
Figure 2 Geared turbofan architecture [1]
Figure 3 Counter-rotating turbofan architecture [1]
ENABLING TECHNOLOGIES
The technologies being built into the VITAL engines include ([1] and [2]):
• New fan concepts with the emphasis on two types: counter-rotating and lightweight fans
• New booster technologies for different operational requirements; low and high speed, associated aerodynamic technologies, new lightweight materials and associated coating and noise reduction design • Polymer composites and corresponding structural
design and manufacturing techniques are studied in parallel with advances in metallic materials and manufacturing processes
• Shaft torque density capabilities through the development of metal matrix composites and multi metallic shafts
• Low pressure turbine weight savings through ultra high lift airfoil design, ultra high stage loading, lightweight materials and design solutions
•
Technologies for installations of high BPR engines related to nozzle, nacelle and reverserESTABLISHING THE SENSITIVITIES
Weight, aerodynamic and noise sensitivities
Engine efficiency is quantified through the Specific Fuel Consumption parameter, SFC, which relates aircraft range R through the specific range parameter SR:
∑ ∫
=⋅
=
N i W W i idW
SR
R
, 1 , 2 , 1Where W is the aircraft weight, N is the number of flight phases (see Figure 5), and the specific range SR parameter is obtained by:
SFC
F
V
SR
⋅
=
Specific range relates the engine thrust F with flight velocity
V and SFC. For a given range R the change in aircraft
weight W is equal to the block fuel. The thrust requirement along the mission is dependent both on flight trajectory and aircraft controls as well as the aircraft takeoff weight and aerodynamic characteristics. From this, it is understood that engine efficiency improvements will require less fuel to be carried, which in turn will reduce aircraft wing size and aircraft empty weight, reducing thrust requirement further. It must therefore be appreciated that to establish sensitivities for a given technology a rubberized aircraft model is required and its thrust requirement must be integrated over a specified mission to find the requested values. Similarly engine weight reductions will translate to reduced aircraft takeoff weight which will reduce the aircraft thrust requirement and consequently decrease block fuel.
To establish the sensitivities of the technologies component models have to be formulated in such a way that they, whenever possible on a preliminary design stage, relate traditional component design parameters with engine/aircraft performance. This is done in this work, either through aerodynamic improvements or weight reductions.
Based on modelling the Sound Pressure Levels (SPL) generated by the engine components and the aircraft, time-integrated Effective Perceived Noise Levels (EPNL) can be estimated. In terms of noise performance, the engine is associated with some limitations set by ICAO [8] for a particular engine operating condition. These limitations depend on the number of engines and on the maximum take-off weight of the aircraft. Thus, as the engine performance modelling can predict its off-design operation, it is possible
Copyright ©2009 by the American Institute of Aeronautics and Astronautics Inc. All rights reserved to calculate the EPNL with respect to the three noise
certification flight conditions: the sideline, the flyover and the approach points [8]. The different noise sources (fan noise, LPT noise, jet noise etc) sum up logarithmically through the relation:
)
1
(
[EPNL]
10
log
10
, 1 10∑
==
M i EPNL tot iEPNL
The noise sensitivity of source i on EPNLtot, can be
described by the following equation:
i tot
EPNL
EPNL
∂
∂
It is clear from equation (1) that the absolute noise levels
EPNLi for all engine related noise sources as well as the
airframe have to be established. Therefore, detailed noise source modelling and component modelling has to be carried out for the establishment of the noise sensitivities. The models produced for TERA2020 provide the noise sources as expected from the fundamental models and thermodynamics, for all VITAL engine configurations. Data such as rotational speeds pressures and temperatures, blade speeds and tip Mach numbers are used to establish the component noise contributions as described previously. The separate sources are then combined into an EPNL value expressing the overall noise generation of engines and the airframe. The logarithmic sum, accounting for the combined effect of the various noise sources, can be calculated using equation (1). Thus, the models developed are able to predict the relative contributions from the different components/sources of the engines. Any changes in noise for a given component/source will then be directly translated to an EPNL change for the combined airframe/engine system.
THE TERA2020 MODULES
As part of the TERA2020 analysis the global engine noise is predicted in terms of EPNL for the given flight path. The predictions are provided by the acoustic module, Soprano, developed and refined with recent methods dedicated to each engine noise source, such as a coaxial jet or a contra-rotating fan [9]. Thus, the noise impact on new turbofan engines can be estimated and then included in their preliminary assessment.
A module for engine weight and dimensions [10] as well as plant cost modelling [11], WeiCo, is continuously being developed by Chalmers University and Stuttgart University. The weight and dimensions models are used to establish the
engine gas paths and to perform preliminary mechanical assessments as part of the multidisciplinary optimization. Thus, the impact of design choices e.g. varying stage numbers, mechanical speeds and component layout, can then be incorporated as part of the TERA2020 analysis. The aircraft performance module, HERMES, is provided by Cranfield University. It has its initial roots in the work of Laskaridis et al. [12]. The module provides estimates for the aircraft lift, drag, take-off performance, fuel burn and range. HERMES has been validated against FLOPS [13] and BADA [14].
The Cranfield in-house gas turbine performance code, TURBOMATCH [15], has been adopted for use in the VITAL TERA2020 software. TURBOMATCH is a generic gas turbine performance modelling code which has decades of experience built into it and has undergone many revisions and updates since its original version was assembled. These four modules, the noise, the engine weight and dimensions, the aircraft and the performance will now be described in somewhat more detail.
The noise module
The noise module was built from an acoustic empirical prediction code, developed within the research program SilenceR. The code, called Soprano, was initially based on correlations and prediction methods dedicated to the various engine noise sources. It was consecutively refined with more recent methods and appropriate assumptions in order to assess the technological achievements within the VITAL project.
Fan and compressors Heidmann ([16] and [17]) Coaxial exhaust jet Stone & Krejsa [18]
SAE ARP 876D [19]
Turbine Krejsa [20]
Airframe Fink [21]
Noise propagation SAE ARP 866A [22] Chien & Soroka [23] SAE AIR 1751 [24] Installation effects on
jet noise Blackner and Bhat [25] Contra-rotating rotors
interaction tone noise Hanson modified ([26] and [27]) Heidmann adapted ([16] and [17]) Table 1 Overview of implemented noise prediction methods
Public noise prediction methods in Soprano are summarized in Table 1. Most of the existing methods have been calibrated with data from previous and in-service engines. As new and different engine concepts are being investigated, the input conditions may be out of the validity
Copyright ©2009 by the American Institute of Aeronautics and Astronautics Inc. All rights reserved range of the methods. Some of the models are then
extrapolated for the optimization investigation, and assumed to be sufficient to capture the noise trends correctly.
For modern civil airliners, the three main noise sources are the fan noise, the exhaust jet noise and the airframe noise. The combustor and turbine noise are also estimated. As is well established, the turbine noise may occasionally become critical in the approach condition.
The new VITAL turbofans are expected to achieve significant reductions in the fan noise because of the lower relative tip speeds. This may eliminate the fan buzz-saw noise that characterizes state of the art turbofans. The DDTF engine may be designed to operate with lower fan tip Mach numbers. The fan tip speed of the GTF is reduced by the use of a gear box. The CRTF concept allows splitting the aerodynamic loading between two fans to achieve low speeds and pressure ratios. More detail on the implementation of the noise module can be found in [10].
Emissions module
Due to regulatory limits set by ICAO [28] and other organizations it is necessary to predict the emission index for the main engine pollutants CO2, NOx, CO, UHC and
Smoke. Therefore, an emissions prediction model was developed for the TERA2020 software in order to evaluate the environmental impact of the VITAL engines. The model can be used to assess the gaseous pollutant production using data from the aircraft and engine performance models i.e. the thermodynamic cycle parameters for the combustion chamber. This assessment is undertaken for the ICAO landing and take-off cycle, as well as for the entire aircraft flight mission; these results are subsequently used as input in the TERA2020 environment tool. For the purposes of this paper, the gaseous pollutant assessments have been restricted to CO2 emissions only, since NOx emissions levels
attained are not expected to be representative for year 2020 technology. Similar TERA2020 assessments for NOx
emissions will be presented within the European project NEWAC [33].
The weight and dimensions module
The weight module for the TERA2020 analysis is based on a methodology similar to the work presented by Onat and Klees [34] and later developments as presented by Tong [35]. Default values on parameter settings given in the original report have been updated extensively, in order to correspond more closely to state of the art jet engine technology as well as to model expected future technology levels. Several updates on the modelling have also been introduced, such as new correlations for hollow fan blades
and containment weight prediction, disc weight modelling and improved models for hot and cold structures. The flexibility of the input has also been increased to range from non-dimensional input to very detailed data such as pre-specified gas paths for compressors/turbines and thickness distributions for discs.
Figure 4 illustrates how the weight model captures technology progress. The cross sectional images of the three spool DDTF configuration are given for two levels of technology; year 2000 entry of service and year 2020 entry of service. Performance data is in both instances set to represent technology levels expected to be available for year 2020 entry of service engines. Note that some parts of the shafts as well as bearings are omitted in the two figures although they are included in the total weight estimate. Note that the tool estimates technology improvement both in the core and the low pressure system. The activities of developing the core models are however carried out within the NEWAC project [33].
The two cross sectional drawings illustrate the level of detail of the output produced by the weight and dimensions tool while performing cycle optimization. The diagram clearly illustrates how the need for advanced low pressure turbine aerodynamics becomes critical for these low levels of fan pressure ratio and corresponding rotational speeds. The conventional LPT operates with a stage loading coefficient of 4.5, see section sensitivity factors for a definition, resulting in a nine stage turbine, whereas the year 2020 LPT uses a value of 5.2. It also illustrates how improved aerodynamics of the IPC and the HPC components will contribute to a lighter and more compact engine. Note also that the use of an MMC shaft makes the future engine more compact and more space is made available for the HPT discs.
The aircraft module
The aircraft performance model, HERMES, was developed to fulfil a number of requirements including:
• Calculate aircraft performance data such as lift and drag coefficients, distance for take-off, etc. from available information on the geometry and mass of the aircraft • Calculate aircraft fuel burn, time elapsed and distance
covered for the baseline and derivative aircraft performing a given mission
• Allow for the modelling of different aircraft and engines
• Compute the range of the aircraft for a specified maximum take-off weight, payload and fuel load
Copyright ©2009 by the American Institute of Aeronautics and Astronautics Inc. All rights reserved Figure 4 Future ultra high bypass ratio engine designed using year2020 objective technology(upper half)
and year2000 technology (lower half)
A routine that “rubberizes” the aircraft wing is included in the module. The routine optimizes the aircraft wing for a given engine performance, weight and geometry to meet a defined design range. In this manner, typical “snowball” effects can be captured by the aircraft model with first order accuracy. The aircraft wing and tail geometry as well as the maximum take-off weight are iteratively adjusted to meet the design range. The iterations are carried out by assuming a constant wing loading. The model is applied to two business ranges; a long range mission here set to 5,550 km and a short range mission of 925 km. These two business ranges comprise the two missions referred to in this paper as the Short Range (SR) and Long Range (LR) missions.
As already mentioned, HERMES has been validated against data obtained from two sources, an aircraft flight optimization system, FLOPS [13], and aircraft database; BADA [14]. The FLOPS program was obtained from the NASA Langley research centre. BADA on the other hand is a product of EUROCONTROL experimental centre, under the European Organisation for the Safety of Air Navigation. More detailed description of the aircraft model can be found in Laskaridis et al. [12].
The performance module
The Cranfield in-house gas turbine performance code, TURBOMATCH [10], has been adopted for use in the VITAL TERA2020 model. TURBOMATCH is a generic gas turbine performance modelling code which has decades of experience built into it and has undergone many revisions and updates since its original version was assembled. Within the VITAL project the performance of the three engines, i.e. the DDTF the GTF and the CRTF have been defined in detail for the low pressure system of the engines. This provided calibration points to establish realistic engine performance for the nominal engine operating points. Data was provided for take-off, fly-over (a point for noise evaluation), top-of-climb, cruise and approach.
The TURBOMATCH code will be used to design the engine in top-of-climb and the other mission points are then run as off-design. Data is fed from performance to the noise model, the weight model and the aircraft model. The detailed data flow of the TERA2020 model has been described previously in [3].
Copyright ©2009 by the American Institute of Aeronautics and Astronautics Inc. All rights reserved Figure 5 Typical aircraft mission divided into flight phases
SENSITIVITY FACTORS
The computed the sensitivity factors, already published in [10], were determined by carrying out mission analysis. First, a 1% change in the technology parameters was introduced and then a mission study was carried out as indicated in Figure 5. The impact of the change in the generated noise and CO2 emissions was then computed.
It should be pointed out that some of the parameters relating weight and aerodynamic technology have to be introduced as step changes. These parameters were:
• Switch from conventional intermediate case materials to cold composites (part in bypass stream)
• Switch from conventional manufacturing of intermediate case to titanium fabrication
• Switch to new materials and new manufacturing techniques in the turbine exhaust case
• Switch of shaft material (Aermet100 material to metal matrix shaft)
• Sufficient pressure ratio in the first booster stage to remove a stage
• Sufficient stage loading in the low pressure turbine to remove a stage
To accommodate these step changes to establish sensitivities the following algorithm was used:
• First, the change was modelled as fully introduced • The weight impact of this change was then estimated • Finally the change in CO2 generation due to a one
percent weight change was calculated
RESULTS AND DISCUSSION
The main aim of this work has been to combine the sensitivity factors published in [10] with published information on the technologies developed under the umbrella of the VITAL project ([1], [2], [36], and [37]), in order to assess the impact of failing to deliver expected year 2020 technology for the VITAL engine configurations. More specifically, the impact of failing to deliver specific component technologies has been quantified, in terms of power plant noise and CO2 emissions, and will now be
presented.
Weight and aerodynamics
The impact of failing to deliver expected VITAL component aerodynamic improvements as well as weight reductions has been quantified in Table 2 through Table 7.
The results presented in these tables can be interpreted in multiple ways. First of all, it can be observed that year 2020 projected engine configurations for short range applications will be less affected by failure to deliver low pressure component technologies than the their long range application counterparts. The overall benefits in terms of CO2 emissions, as a result of achieving the VITAL
technologies, range from 4.7% to 5.5% for short range applications, and from 7.3% to 9% for long range applications. With the projected reduction in CO2 emissions for all engine configurations being 7% for VITAL [36], it can also be concluded in retrospect that the established sensitivities in [10] do capture the correct trends.
Copyright ©2009 by the American Institute of Aeronautics and Astronautics Inc. All rights reserved The larger “snow ball” effects, i.e. the impact of a
technology change after the engine/aircraft has re-optimized itself, expected for long range missions are confirmed by the tables. It should also be emphasized that although the sensitivity factors, when multiplied with an achieved technology progress, give a good estimate of its impact the ultimate measure of technology progress requires a complete re-optimization of the engine/aircraft system for the given mission.
Looking closer at these results, it can be observed for the VITAL ultra high bypass ratio engines that fan efficiency improvements as well as fan and thrust reverser weight reductions will dominate the projected CO2 benefits, with an emphasis on long range missions. Failure to achieve these technological goals will effectively more than halve any CO2 benefits expected from increasing engine bypass
ratio. It can also be observed that although all engine configurations will benefit from the VITAL technologies, some will be benefit more than others from certain improvements. For example low pressure turbine weight reductions and aerodynamic improvements are much more critical for direct drive configurations than geared solutions.
Noise
The impact of failing to deliver expected VITAL component noise improvements has been quantified in Table 8 through Table 13.
As can be observed from these assessments, expected VITAL low pressure turbine noise improvements are not expected to be a key contributor to overall engine noise, with the exception of the geared turbofan engine. The projected future reduction in FPR of ultra high bypass engines leads to reduced blade speeds both in the turbine and fan components. In combination with an increased BPR the relative impact of low pressure turbine noise is therefore suppressed.
On the other hand, fan noise remains the most critical noise source for high bypass ratio engines during take-off and fly-over. For approach conditions fan noise continues to remain an important source of overall engine noise while airframe noise becomes the critical contributor.
The relative importance of jet noise as a function of the mission was also quite marked in the sensitivities published in [10]. Since engines optimized for shorter missions generally have higher FPR and corresponding jet velocities, jet noise is relatively speaking more important for engines designed for short range missions.
In the present work, no jet noise or airframe noise assessments are presented due to luck of published information on the VITAL achievements for these noise sources in terms of EPNL.
Sensitivity
(ΔX = 1%) VITAL Technology Objective Technology Failure Impact Weight and Aero Technology Objectives ΔCO2 (%) ΔX (%) ΔCO2 (%)
Fan blade weight reduction 0.0057
Fan disc weight reduction 0.0017
Fan statics weight reduction 0.0112
30 0.56
Fan efficiency improvement 0.8197 2 1.64
Booster first stage pressure ratio 0.0403 15 0.60
Engine structures weight reduction through use of cold
composites 0.0090 25 0.23
Engine structures weight reduction through use of
titanium fabrication 0.0040 15 0.06
Hot structures weight reduction through materials and
manufacturing techniques 0.0039 18 0.07
Shaft weight reduction through material change
(allowable stress) 0.0058 50 0.29
Low pressure turbine ultra high lift (Zweifel number) 0.0102 25 0.26
Low pressure turbine ultra high aspect ratio 0.0206 20 0.41
Low pressure turbine ultra high stage load 0.0250 25 0.63
Thrust reverser weight change 0.0253 30 0.76
Total 5.50 Table 2 Direct Drive TurboFan Short Range (DDTFSR) weight and aerodynamic technology analysis
Copyright ©2009 by the American Institute of Aeronautics and Astronautics Inc. All rights reserved
Sensitivity (ΔX = 1%) VITAL Technology Objective Technology Failure Impact
Weight and Aero Technology Objectives ΔCO2 (%) ΔX (%) ΔCO2 (%)
Fan blade weight reduction 0.0088
Fan disc weight reduction 0.0016
Fan statics weight reduction 0.0239
30 1.03
Fan efficiency improvement 1.7921 2 3.58
Booster first stage pressure ratio 0.0141 15 0.21
Engine structures weight reduction through use of cold
composites 0.0200 25 0.50
Engine structures weight reduction through use of
titanium fabrication 0.0075 15 0.11
Hot structures weight reduction through materials and
manufacturing techniques 0.0045 18 0.08
Shaft weight reduction through material change
(allowable stress) 0.0102 50 0.51
Low pressure turbine ultra high lift (Zweifel number) 0.0116 25 0.29
Low pressure turbine ultra high aspect ratio 0.0234 20 0.47
Low pressure turbine ultra high stage load 0.0396 25 0.99
Thrust reverser weight change 0.0421 30 1.26
Total 9.04 Table 3 Direct Drive TurboFan Long Range (DDTFLR) weight and aerodynamic technology analysis
Sensitivity (ΔX = 1%) VITAL Technology Objective Technology Failure Impact Weight and Aero Technology Objectives ΔCO2 (%) ΔX (%) ΔCO2 (%)
Fan blade weight reduction 0.0069
Fan disc weight reduction 0.0022
Fan statics weight reduction 0.0128
30 0.66
Fan efficiency improvement 0.8533 2 1.71
Booster first stage pressure ratio 0.0046 15 0.07
Engine structures weight reduction through use of cold
composites 0.0103 25 0.26
Engine structures weight reduction through use of
titanium fabrication 0.0043 15 0.06
Hot structures weight reduction through materials and
manufacturing techniques 0.0030 18 0.05
Shaft weight reduction through material change
(allowable stress) 0.0028 50 0.14
Low pressure turbine ultra high lift (Zweifel number) 0.0086 25 0.22
Low pressure turbine ultra high aspect ratio 0.0173 20 0.35
Low pressure turbine ultra high stage load 0.0159 25 0.40
Thrust reverser weight change 0.0260 30 0.78
Total 4.69 Table 4 Geared Turbofan Short Range (GTFSR) weight and aerodynamic technology analysis
Copyright ©2009 by the American Institute of Aeronautics and Astronautics Inc. All rights reserved Sensitivity
(ΔX = 1%) VITAL Technology Objective Technology Failure Impact Weight and Aero Technology Objectives ΔCO2 (%) ΔX (%) ΔCO2 (%)
Fan blade weight reduction 0.0081
Fan disc weight reduction 0.0015
Fan statics weight reduction 0.0205
30 0.90
Fan efficiency improvement 1.1451 2 2.29
Booster first stage pressure ratio 0.0248 15 0.37
Engine structures weight reduction through use of cold
composites 0.0202 25 0.51
Engine structures weight reduction through use of
titanium fabrication 0.0079 15 0.12
Hot structures weight reduction through materials and
manufacturing techniques 0.0030 18 0.05
Shaft weight reduction through material change
(allowable stress) 0.0056 50 0.28
Low pressure turbine ultra high lift (Zweifel number) 0.0198 25 0.50
Low pressure turbine ultra high aspect ratio 0.0397 20 0.79
Low pressure turbine ultra high stage load 0.0141 25 0.35
Thrust reverser weight change 0.0389 30 1.17
Total 7.33 Table 5 Geared Turbofan Long Range (GTFLR) weight and aerodynamic technology analysis
Sensitivity
(ΔX = 1%) VITAL Technology Objective Technology Failure Impact Weight and Aero Technology Objectives ΔCO2 (%) ΔX (%) ΔCO2 (%)
Fan blade weight reduction 0.0065
Fan disc weight reduction 0.0025
Fan statics weight reduction 0.0140
30 0.69
Fan efficiency improvement 0.9036 2 1.81
Booster first stage pressure ratio 0.0434 15 0.65
Engine structures weight reduction through use of cold
composites 0.0084 25 0.21
Engine structures weight reduction through use of
titanium fabrication 0.0040 15 0.06
Hot structures weight reduction through materials and
manufacturing techniques 0.0040 18 0.07
Shaft weight reduction through material change
(allowable stress) 0.0055 50 0.28
Low pressure turbine ultra high lift (Zweifel number) 0.0090 25 0.23
Low pressure turbine ultra high aspect ratio 0.0181 20 0.36
Low pressure turbine ultra high stage load 0.0156 25 0.39
Thrust reverser weight change 0.0246 30 0.74
Total 5.48 Table 6 Counter-Rotating TurboFan Short Range (CRTFSR) weight and aerodynamic technology analysis
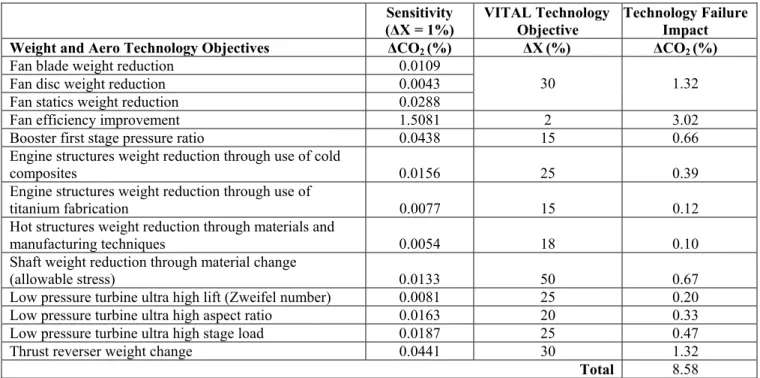
Copyright ©2009 by the American Institute of Aeronautics and Astronautics Inc. All rights reserved Sensitivity (ΔX = 1%) VITAL Technology Objective Technology Failure Impact Weight and Aero Technology Objectives ΔCO2 (%) ΔX (%) ΔCO2 (%)
Fan blade weight reduction 0.0109
Fan disc weight reduction 0.0043
Fan statics weight reduction 0.0288
30 1.32
Fan efficiency improvement 1.5081 2 3.02
Booster first stage pressure ratio 0.0438 15 0.66
Engine structures weight reduction through use of cold
composites 0.0156 25 0.39
Engine structures weight reduction through use of
titanium fabrication 0.0077 15 0.12
Hot structures weight reduction through materials and
manufacturing techniques 0.0054 18 0.10
Shaft weight reduction through material change
(allowable stress) 0.0133 50 0.67
Low pressure turbine ultra high lift (Zweifel number) 0.0081 25 0.20
Low pressure turbine ultra high aspect ratio 0.0163 20 0.33
Low pressure turbine ultra high stage load 0.0187 25 0.47
Thrust reverser weight change 0.0441 30 1.32
Total 8.58 Table 7 Counter-Rotating TurboFan Long Range (CRTFLR) weight and aerodynamic technology analysis
Sensitivity (ΔX = -1EPNdB) VITAL Technology
Objective Technology Failure Impact
Take-off Fly-over Approach Take-off Fly-over Approach
Noise Source
ΔEPNL (EPNdB) ΔX (EPNdB) ΔEPNL (EPNdB)
Fan noise EPNL 0.730 0.540 0.390 6 4.38 3.24 2.34
LPT noise EPNL 0.002 0.002 0.003 4.5 0.01 0.01 0.01
Table 8 Direct Drive TurboFan Short Range (DDTFSR) noise technology analysis
Sensitivity (ΔX = -1EPNdB) VITAL Technology
Objective Technology Failure Impact
Take-off Fly-over Approach Take-off Fly-over Approach
Noise Source
ΔEPNL (EPNdB) ΔX (EPNdB) ΔEPNL (EPNdB)
Fan noise EPNL 0.840 0.650 0.300 6 5.04 3.90 1.80
LPT noise EPNL 0.001 0.002 0.002 4.5 0.00 0.01 0.01
Copyright ©2009 by the American Institute of Aeronautics and Astronautics Inc. All rights reserved
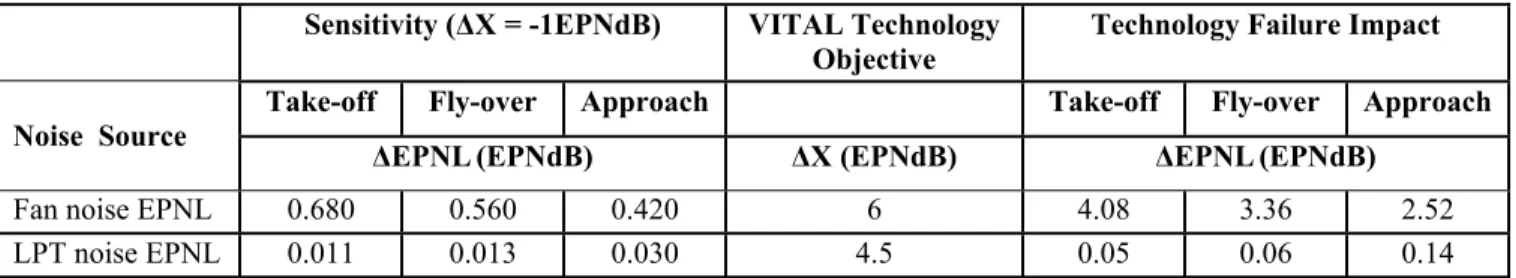
Sensitivity (ΔX = -1EPNdB) VITAL Technology Objective
Technology Failure Impact
Take-off Fly-over Approach Take-off Fly-over Approach
Noise Source
ΔEPNL (EPNdB) ΔX (EPNdB) ΔEPNL (EPNdB)
Fan noise EPNL 0.680 0.560 0.420 6 4.08 3.36 2.52
LPT noise EPNL 0.011 0.013 0.030 4.5 0.05 0.06 0.14
Table 10 Geared Turbofan Short Range (GTFSR) noise technology analysis
Sensitivity (ΔX = -1EPNdB) VITAL Technology
Objective Technology Failure Impact
Take-off Fly-over Approach Take-off Fly-over Approach
Noise Source
ΔEPNL (EPNdB) ΔX (EPNdB) ΔEPNL (EPNdB)
Fan noise EPNL 0.780 0.640 0.310 6 4.68 3.84 1.86
LPT noise EPNL 0.020 0.022 0.049 4.5 0.09 0.10 0.22
Table 11 Geared Turbofan Long Range (GTFLR) noise technology analysis
Sensitivity (ΔX = -1EPNdB) VITAL Technology
Objective Technology Failure Impact
Take-off Fly-over Approach Take-off Fly-over Approach
Noise Source
ΔEPNL (EPNdB) ΔX (EPNdB) ΔEPNL (EPNdB)
Fan noise EPNL 0.660 0.340 0.280 6 3.96 2.04 1.68
LPT noise EPNL 0.003 0.004 0.003 4.5 0.0135 0.018 0.0135
Table 12 Counter-Rotating TurboFan Short Range (CRTFSR) noise technology analysis
Sensitivity (ΔX = -1EPNdB) VITAL Technology
Objective Technology Failure Impact
Take-off Fly-over Approach Take-off Fly-over Approach
Noise Source
ΔEPNL (EPNdB) ΔX (EPNdB) ΔEPNL (EPNdB)
Fan noise EPNL 0.700 0.470 0.340 6 4.20 2.82 2.04
LPT noise EPNL 0.004 0.008 0.004 4.5 0.02 0.04 0.02
Copyright ©2009 by the American Institute of Aeronautics and Astronautics Inc. All rights reserved
SUMMARY AND CONCLUSIONS
The TERA2020 tool has previously been used by the authors to establish a number of sensitivity factors relating traditionally used component design parameters to engine/aircraft performance parameters. The resulting sensitivity factors allow a straightforward evaluation of the system level impact of component technology research progress. In particular, results were provided for the three VITAL configurations, with respect to aerodynamics, weights and noise, for two different mission definitions. The main aim of the present work has been to combine the sensitivity factors with published information on the technologies developed under the umbrella of the VITAL project in order to assess the impact of failing to deliver expected year 2020 technology for the VITAL engine configurations. More specifically, the impact of failing to deliver specific component improvements has been successfully quantified, in terms of power plant noise and CO2 emissions and was discussed extensively.
The study also increases confidence in the TERA2020 tool since the scenario of total failure, i.e. that no progress is achieved in any technology area for the time period 2000 to 2020, results in a total CO2 penalty quite in agreement with
the overall goals of the project as predicted by industry. In the authors’ opinion, all three engine configurations are optimal designs for the year 2020 and each has its own merits with respects to low technology risk and improved reliability, as well as reduced noise and CO2 emissions.
Their commercial competitiveness will therefore largely depend on how the aviation market will evolve in the years to come until 2020.
Perhaps the most important aspect of this work is that the presented results essentially provide the means for making estimates of the relative merits of future technology investment. The relative importance of certain future aero engine research activities have been highlighted for particular engine configurations.
ACKNOWLEDGMENTS
This study has been carried performed under the European Commission Contract AIP4-CT-2004-012271 and FP6-030876. The authors gratefully acknowledge this funding as well as the project partners collaboration. The work in this paper above was performed under VITAL WP 1.2 and NEWAC WP1.3, “Techno-Economic and Environment Risk Assessment”, and Cranfield University, Chalmers
University, and Institut Supérieur de l’Aéronautique et de l’Espace specifically contributed to the work presented in the paper. The authors would also like to thank J.A. Borradaile for the numerous inspiring discussions which helped us to put much of his invaluable industrial expertise into the TERA2020 tool internals.
REFERENCES
[1] Korsia, J.-J., 2007, “VITAL – European R&D
Programme for Greener Aero-Engines”,
ISABE-2007-1118
[2] Korsia, J.-J., and Guy, S., 2006, “VITAL, a European
R&D Program for Greener Aero-Engines”, 25th
International Congress of the Aeronautical Sciences. [3] Bretschneider, S., Arago, O., and Staudacher, S.,
2007, “Architecture of a Techno and Environmental
Risk Assessment Tool Using a Multi-Modular Build Approach”, ISABE-2007-1103, 18th ISABE
Conference, Beijing, China.
[4] Claus, R.W., Evans, A.L., Lytle, J.K., and Nichols, L.D., 1991, "Numerical Propulsion System
Simulation," Computing Systems in Engineering,
Vol. 2, pp. 357-364.
[5] Jeschke, P., Kurzke, J., Schaber, R., and Riegler, C., 2004, “Preliminary Gas Turbine Design Using the
Multidisciplinary Design System MOPEDS”,
Vol. 126, 2, pp. 258-264.
[6] Alexiou, A., and Mathioudakis, K., 2005,
"Development of Gas Turbine Performance Models Using a Generic Simulation Tool", ASME TURBO
EXPO, GT2005-68678.
[7] Kyprianidis, K.G., Colmenares Quintero, R.F., Pascovici, D.S., Ogaji, S.O.T., Pilidis, P., and Kalfas, A.I., 2008, “EVA – A Tool for Environmental
Assessment of Novel Propulsion Cycles”, ASME
TURBO EXPO 2008, GT2008-50602, Berlin, Germany.
[8] Environmental Technical Manual on the use of Procedures in the Noise Certification of Aircraft - Doc 9501 - Annex 16 - Chapter 3.
[9] Au, D., and Leblanc, A., 2008, “Contra-rotating fans
noise prediction for jet engine performance Optimization”, ACOUSTICS2008/307.
[10] Grönstedt, T., Au, D., Kyprianidis, K.G., and Ogaji, S.O.T., 2009, “Low Pressure System Component
Advancements and its Influence on Future Turbofan Engine Emissions”, ASME TURBO EXPO 09,
[11] Arago, O., Bretschneider, S., and Staudacher, S., 2007, “A Unit Cost Comparison Methodology for
Turbofan Engines”, ASME TURBO EXPO 07,
ASME-GT2007-27485.
[12] Laskaridis, P., Pilidis, P. and Kotsiopoulos, P, 2005,
“An Integrated Engine-Aircraft Performance Platform for Assessing new Technologies in Aeronautics”, ISABE-2005-1165.
[13] McCullers LA. 1984, “FLOPS: Aircraft
Configuration Optimization”. NASA CP-2327.
[14] http://www.eurocontrol.be/eec/public/standard_page/ proj_BADA.html, cited Sept. 2008.
[15] MacMillan, W.L., 1974, “Development of a Modular
Type Computer Program for the Calculation of Gas Turbine Performance”, Ph.D. thesis, Cranfield
Institute of Technology.
[16] Heidmann, M.F., 1979, “Interim Prediction Method
for Fan and Compressor Source Noise”, NASA
Technical Memorandum X-71763.
[17] Kontos, K.B., Janardan, B.A., and Gliebe, P.R., 1996,
“Improved NASA-ANOPP Noise prediction - Computer Code for Advanced Subsonic Propulsion Systems, ANOPP evaluation and fan noise model improvement”, NASA Contractor Report 195480.
[18] Stone, J.R., Krejsa, E.A., and Clark, B.J., 2003, "Jet
Noise Modelling for coannular Nozzles Including the Effects of Chevrons", NASA Contractor Report
212522.
[19] Society of Automotive Engineers, 1994, “Gas
Turbine Jet Exhaust Noise Prediction”, SAE ARP
876D.
[20] Krejsa, E.A., and Valerino, M.F., 1976, “Interim
prediction method for turbine noise”, NASA
Technical Memorandum X-73566.
[21] Fink, M.R., 1977, “Airframe Noise Prediction
Method”, Federal Aviation Administration, Report
FAA-RD-77-29.
[22] Society of Automotive Engineers, 1975, “Standard
values of atmospheric absorption as a function of temperature and humidity”, SAE ARP 866A.
[23] Chien, C.F., and Soroka, W.W., 1975, “Sound
Propagation Along an Impedance Plane”, J. Sound
& Vib, Vol. 43, No. I, pp. 9–20.
[24] Society of Automotive Engineers, 1981, “Prediction
method for lateral attenuation of airplane noise during takeoff and landing”, SAE AIR 1751.
[25] Blackner, A.M., and Bhat, T.R.S., 1998, “Installation
effects on coaxial jet noise, an experimental study”,
Aerospace Sciences Meeting and Exhibit, Reno, NV, AIAA-98-0080.
[26] Hanson, D.B., 1985, “Noise of Counter-Rotation
Propellers”, Journal of Aircraft, Vol. 22, No. 7, pp.
609–617.
[27] Whitfield, G.E., Mani, R., and Gliebe, P.R., 1990
“High Speed Turboprop Aeroacoustic Study (Counterrotation)”, NASA Contractor Report
185241.
[28] International Civil Aviations Organization, 1995,
“ICAO Engine Exhaust Emissions Data Back”, First
Edition, Doc 9646-AN/943.
[29] Baughcum S.L., Tritz G.T., Henderson S.C. and Picket D.C., 1992, "Scheduled civil aircraft emissions
inventories for 1992: Database development and analysis", NASA CR 4700.
[30] Lefebvre, A.W., "Gas Turbine combustion", McGRAW-HILL SERIES in Energy, Combustion and Environment.
[31] Rizk, N.K., and Mongia, H.C., 1994, "Emissions
Predictions of different gas turbine combustors", In
AIAA, editor, Aerospace Sciences Meeting and Exhibit, Reno, NV.
[32] Lee, Chi-Ming, 2007, “High Pressure Low NOx
Emissions Research: Recent Progress at NASA Glenn Research Center”, ISABE-2007-1270.
[33] Wilfert, G., Sieber, J., Rolt, A., Baker, N., Touyeras , A. and Colantuoni, S., 2007, “New Environmental
Friendly Aero Engine Core Concepts”, ISABE
2007-1126.
[34] Onat, E., and Klees, G.W., 1979, “A Method to
Estimate Weight and Dimensions of Large and Small Gas Turbine Engines”, NASA CR-159481.
[35] Tong, M.T., Ghosn, L.J., and Halliwell, I., 2002, “A
Computer Code for Gas Turbine Engine Weight and Disk Life Estimation”, ASME Paper GT-2002-30500.
[36] Korsia, J.-J., 2008, “VITAL project overview”, XNOISE 2008, Kiev.
[37] 2009, Presentation material, “The VITAL Final
Workshop: Steps Towards Clean – Quiet Engines & Aircrafts Noise and CO2 Reduction”, Budapest
Congress & World Trade Centre, 9-10 March, Hungary.
![Figure 2 Geared turbofan architecture [1]](https://thumb-eu.123doks.com/thumbv2/5dokorg/4793186.128464/3.918.65.454.107.229/figure-geared-turbofan-architecture.webp)