Airborne spreading and *
deposition of de-icing salt
a case study
Reprint from The Science of the Total Environment 235,
1999, pp. 161 168
Göran Blomqvist, VTI and
Eva-Lotta Johansson, Royal Institute of Technology,
KTH Haninge
, U 65 05 G) H Hm
m
x 0 >. h ...a h 35 U)I:|:l:l:l |||||||||| :'ÄIÄC'Ä'Ä'
Deposition
DePOSi O
.'.'I':'Z'Z* Swedish NationalRoadand ,
,Transport Research Institute
VTI särtryck 331 - 1999
Airborne spreading and
deposition of de-icing salt
a case study
Reprint from The Science of the Total Environment 235,
1999, pp. 161 168
Göran Blomqvist, VTI and
Eva-Lotta Johansson, Royal Institute of Technology,
KTH Haninge
Copyright 1999 with permission
Wiwen
ååååfgi? gggäfägå from Elsevier ScienceThe Science of the Total Environment 235 (1999) 161 168
the Science of the
Total Environment
An Intematlonal Journal for Sclentlflc Research into the Environment and Its Relationship with Man
www.elsevier.com/locate/scitotenv
Airborne spreading and deposition of de-icing salt
a case study
Goran Blomqvist , Eva-Lotta Johanssonb
aSwedish National Road and Transport Research Institute, SE-58l 95 Linköping, Sweden bRoyal Institute of Technology, KTH Haninge, Marinens Ua'g 30, .SE-136 40 Haninge, Sweden
Abstract
In this study it was concluded that between 20 and 63% of the de-icing salt applied on the road was transported by air and deposited on the ground 2 40 m from the road. The reason for the higher percentages is suggested to be intense snowfall, which leads to more splash generation and ploughing. Ninety percent or more of the total deposition occurs within 20 m at all transects. For all periods and both localities the deposition was greater on the east side of the road, which re ects the prevailing westerly winds in relation to the de-icing action occasions. © 1999 Elsevier Science B.V. All rights reserved.
Keywords: De icing salt; Airborne spreading; Deposition; Budget; Road weather information system (RWIS)
1. Introduction
Snow and ice control can be made with me-chanical or chemical methods. In Sweden the de-icing agent almost exclusively used is sodium chloride due to its low price. Sodium chloride is spread mechanically to the roads either as dry
*Corresponding author. Tel.: 13-20-41-71; fax: +46-13 20-40-30.
E-mail address: goran.blomqvist@vti.se (G. Blomqvist)
salt, moistured salt or in solution, depending on the state of the road.
The de-icing salt applied on the road surface can be spread to the roadside environment through different transport mechanisms such as runoff, in ltration, airborne spreading (splash, spray, particulates) and ploughing (Fig. 1). Salt has been found to be transported by air several hundreds of metres from the road above open ground (Kelsey and Hootman, 1992), but at forested sites the vegetation is ltering the air leading to higher deposited amounts on the
0048-9697/99/$ - see front matter © 1999 Elsevier Science B.V. All rights reserved. PII: S0048-9697(99)00209-0
162 G. Blomqvist, E. -L. Johansson / The Science of the Total Environment 235 (1999) 161 168
spray
splash i fistra tiea run off
ground water ievei
sampling bucket
Fig. 1. Conceptual model of transport mechanisms and sampling method.
ground under the vegetation (Hautala et al., 1995). Under certain conditions the vegetation is likely to be damaged by such salt deposition. Deposi-tion on the ground might also lead to effects such as alteration of soil structure and possible in l-tration and percolation to groundwater (Bäckman
and Folkeson, 1995).
The deposition of de-icing salt next to roads has been assessed by e.g. collecting the deposition in containers (Karlqvist, 1974; Kelsey and
Hoot-man, 1992; Pedersen and Fostad, 1996), by snow-sampling (Simini and Leone, 1986; McBean and Al-Nassri 1987; Hautala et al., 1995; Eliasson,
1996) by soil sampling (Hofstra et al., 1979; Drag
sted, 1980; Persson and Royseland, 1981; Jones et al., 1986; Rutter and Thompson, 1986; Pilon and Howard, 1987; Bäckman and Folkeson, 1995; Pedersen and Fostad, 1996; Rohr, 1996;
Bäck-man, 1997) or by analysing salt concentration in
vegetation (Hofstra and Hall, 1971; Bäckman and
Folkeson, 1995; Pedersen and Fostad, 1996). Budgets have been made for lead and PAHs
based on vehicular emissions (Harrison et al., 1985; Hewitt and Rashed, 1990).
In studies of airborne de-icing salt migration McBean and Al Nassri (1987) concluded that 90% of the deposited salt was found within 13 m. However, they assumed that the maximum possi-ble distance to which the salt will migrate is 30 m from the edge of the road shoulder, and in their investigation the deposition is not related to the amount of salt applied on the road. Pedersen and Fostad (1996) showed that 10 25% of the applied salt Was spread through the air and that most of this salt was deposited within 8 m of the roadway. The samples were taken 2 16 or 2 20 m from the
edge of the road and the budget is calculated from the total amount of road salt applied during that season.
The aims of the present study are to quantify the amount of de-icing salt transported by air (the remainder will be transported as runoff or in l-trate in the road construction) and deposited on the ground adjacent to the road and relate that to the total amount of salt applied on the road. During the deposition periods, meteorological parameters such as temperature, wind direction and speed, and precipitation amount and type were registered in order to investigate their im-portance for the deposition pattern.
2. Materials and methods
The Swedish National Road administration has developed a system for supervision of the local weather at some major Swedish roads. The Road Weather Information System (RWIS) measures, e.g. temperature in air and at road surface, wind velocity and direction and precipitation type and amount. In order to investigate the meteorologi-cal factors the two eld investigations were lo-cated at RWIS stations.
One of the localities chosen for eld studies was Älgviken, 50 km south of Stockholm (Fig. 2) at National Road 73 which has an average daily traf c of 8000 vehicles and a speed limit of 90 km h_l. At the locality the road runs in a north-south orientation with a ploughed eld west of the road and a meadow east of the road. On the west side
there is a ditch at about 4 m from the edge line,
G. Blomqvist, E. -L. Johansson / The Science of the Total Environment 235 (1999) 161 168 163 ...-....;l
[_
&
!./åå
N
ha» __le . 200 T W3» . . Fråg?
m
Fig. 2. Map of the two sampling localities (squares) and precipitation stations (circles).
about 6 m from the road. The Baltic Sea is about 2 km east of the road.
The other locality was Bankekind, 10 km south-east of Linköping (Fig. 2) at the National Road 35. The road has an average daily traf c of 5500 vehicles, a speed limit of 90 km h 1 and runs in a NW-SE orientation. West of the road there is a meadow and east of the road there is a harvested but not ploughed farmland. There are ditches on both sides of the road at 4 m from the edge line. The deposition was collected in 27-1
polyethy-lene buckets (175 mm diameter). The containers were placed in double transects 2 m apart at the
distances of 2, 4, 6, 10, 20, and 40 m from the
edge line of the road on both sides of the road. At Algviken the containers were collected and replaced once a week (i.e. 7 15 February, 15 22
February, and 22 February 1 March 1997, Fig. 3).
At Bankekind the containers were collected every two weeks (i.e. 6 19 February, and 19 February 3 March 1997, Fig. 3) except from a 400 m pro le
with containers placed at 2, 4, 6, 10, 20, 40, 60, 100, 200 and 400 m, where the containers were
collected after 4 weeks (i.e. 6 February 3 March 1997).
Both roads were de-iced with NaCl during the sampling period. Data about applied amount of salt were available at the local road maintenance stations. In this case the applied amount of salt was given in g~m_2 applied road surface or in tonnes per km road length. The amounts were recalculated to amounts of salt in g-m 1 in order to compare the amounts applied on the road to the amounts deposited at different distances. Fur-thermore, at each locality a road weather infor-mation device registered the amount and type of precipitation, speed and direction of wind and temperatures in the air and at the road surface every half-hour. According to Ericsson (1995) there is a rapid decrease in concentration of de-icing salt on the road within the rst hours after a de-icing action has taken place. Hence, the wind direction and speed was considered only
Bankekind
W &
Älgvian
|
|
|
llllllllllllllllllllllllllllll 3-2 -9 7G. Blomqvist, E. -L. Johansson / The Science of the Total Environment 235 (1999) 161 168
164
Älgviken, week 1, west side äÄlgviken, week 1, east side
100000 _ 100000
,_10000
;
10000 ;
5,1000
l
1000 a"E
& O'): 100
100 5
Q _ 05 O 1 2 10 . , t _ 10 g 40 20 10 6 4 2 2 4 6 10 20 40 Distance from edge line (m) Distance from edge line (m) Älgviken, week 2, west side Älgviken, week 2, east side100000 100000 10000 10000
& 1000
1000 cyes
U) U)100 -
100 %
ä
ea
2 10 . 10 2 40 20 10 6 4 2 2 4 6 10 20 40 Distance from edge line (m) Distance from edge line (m)Fig. 4. Deposition pattern in Älgviken, week 1 and 2. Estimated precipitation week 1, 15 20 mm, week 2, 15 20 mm. Amount of
salt applied on the road week 1, 405 g-m 1; week 2, 370 g-m_1.
NA 'E 1000 (m g Öcu Z
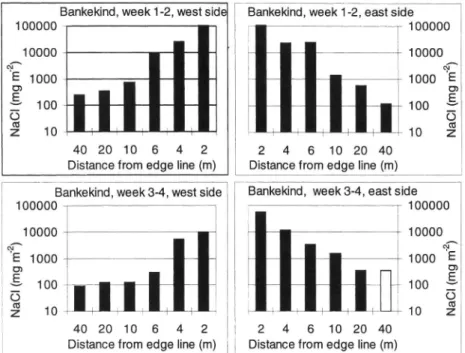
Bankekind, week 1-2, west side]
100000 10000
100
10 ,
40 20 10 6 4 Distance from edge line (m)
Bankekind, week 1-2, east side 100000 10000 1000 100 Na Cl (m g m'2 ) 10 2 4 6 10 20 40 Distance from edge line (m)
Fig. 5. Deposition pattern in Bankekind week 1 2 and 3 4. Estimated precipitation week 1 2, 25 30 mm; week 3 4, 7 10 mm
Bankekind, week 3-4, west side
100000 a 10000 'E 1000 O) 100 e Na CI (m 10 402010 6 4 2
Bankekind, week 3-4, east side 100000 10000 Na CI (m g m' 2) 4 6102040 2
Distance from edge line (m) Distance from edge line (m)
G. Blomqvist, E. -L. Johansson / The Science of the Total Environment 235 (1999) 161 168 165 Table 1
Percentages of depositions and winds
Älgviken, Älgviken, Bankekind, Bankekind, Week 1 Week 2 Week 1 2 Week 3 4 W E W E W E W E Percentage of collected salt deposited 32 68 26 74 44 56 19 81 on each side of the road
Percentage of collected salt deposited 79 78 91 94 94 93 86 85 within 10 m from edge line
Winds froma 61 39 100 0 45 55 95 5
Winds froma, speed > 5 ms_1 78 22 100 0 98 2 100 0 Percentage of salt applied, 20 63 36 26
deposited 2 40 m from edge line
aWinds that are parallel to the road orientation are not included.
for the rst 6 h following each de-icing operation.
Only the winds not parallel to the road were taken into account.
The samples were stored for 1 3 weeks prior to analysis. The water was ltered and samples of 100 ml were stored cool for further analyses. Subsequently, the concentration of Na was mea sured with an ICP (Induced Coupled Plasma Emission) of the brand Jobin-Yvon and the Cl-concentration was measured with a Dionex Dx-120 ion-chromatograph.
In order to calculate the total deposition the mean values were calculated from the double transects. Missing values (non- lled bars in Figs. 4 and 5) were interpolated by the geometric mean
between the surrounding two values (Fig. 4) and by extrapolating the second last value to the outmost position (Fig. 5). The total amounts of sodium chloride deposited on both sides of the road were then integrated and the sum related to the amount of de-icing salt applied on the road.
3. Results
For all periods and both localities, the deposi-tion was greater on the east side (Table 1).
During the rst week at Älgviken (Fig. 4), 20% of the total amount of salt applied on the road was deposited on the ground, 2 40 m from the
Älgviken, week 1 De po si te d am ou nt (m m) 4020106 4 2 0 2 4 6102040
Distance from edge line (m)
De po si te d am ou nt (m m) Älgviken, week 2 402010 6 4 2 0 2 4 6102040
Distance from edge line (m)
166 G. Blomqvist, E.-L. Johansson / The Science of the Total Environment 235 (1999) 161 168
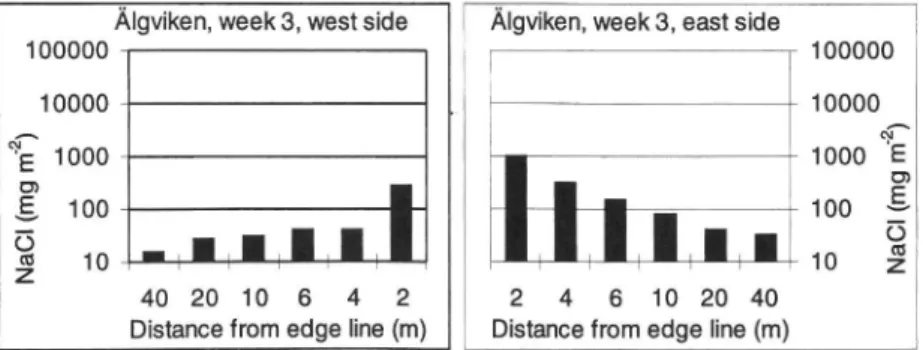
Älgviken, week 3, west side
100000 10000 1000 100 [ 10 40 20 10 6 4 2 Distance from edge line (m)
Na Cl (m g m' 2)
Älgviken, week 3, east side
100000 10000 -2 ) 1000
E
U)-100 E?
%
10 2 2 4 6 10 20 40 Distance from edge line (m)Fig. 7. Deposition pattern in Älgviken, week 3. Estimated precipitation week 3, 6 8 mm. No de-icing action took place.
edge of the road (Table 1). During the second
week a much larger amount of deposition was
found in the collectors close to the road (Fig. 6) and the total deposition was much greater (63%). The deposition was also registered during a week when no de-icing action took place (Fig. 3). The amount of salt deposited on the ground was one order of magnitude lower (Fig. 7), but still con-siderable taking into account that no salt was
applied on the road.
At Bankekind (Fig. 5) 36% of the salt applied on the road was transported by air and deposited 2 40 m from the road the rst 2-week period. (Table 1). During the second period less salt was deposited; 26% of the amount applied was de-posited. In the 400-m profile from Bankekind the deposition seems not to have levelled out at 40 m
(Fig. 8).
When considering both localities and all peri-ods, it is obvious that the major part of the
Bankekind, week 1-4, east side
100000 10000 ' I E 1000
«3
III
:100ea
lllllllll
2 10 2 4 6 10 20 40 60100200400 Distance from edge line (m)Fig. 8. Deposition pattern in Bankekind, week 1 4, long pro-le. Estimated precipitation week 1 4, 33 37 mm. Amount of salt applied on the road week 1 4, 1980 g-m_1.
deposition occurs within the rst few metres from
the edge line of the road (Fig. 9).
4. Discussion
Pedersen and Fostad (1996) showed that 10 25% of the applied salt was spread through the air. But since their result is calculated from deposition 2 16 or 2 20 m, and the salt probably is transported to greater distances, their result might be an underestimation. In this investigation 20 63% of the applied salt was spread through air and deposited 2 40 m from the edge line
(Table 1). One reason for the higher percentages
in this study is the longer pro les.
The reason for the high variation between the periods is that the transport mechanisms (Fig. 1) have different in uence depending on the meteo-rological conditions during each period. The high percentages in Älgviken week 2 (63%), and in Bankekind week 1 2 (36%) is suggested to be due to a period of intense snowfall occurring in these two periods which lead to more splash generation and ploughing. This can also be seen in the amount of liquid deposited within the first
metres in Älgviken week 2 as compared to
Älgvi-ken week 1 (Fig. 6). The high percentage of deposited salt during week 21n Älgviken1s coher-ent with Dragsted (1980) who found that the salt was transported a shorter distance during a pe-riod with many snowfalls than during a pepe-riod with just wet road surface.
For all periods and both localities, the deposi-tion was greater on the east side. When
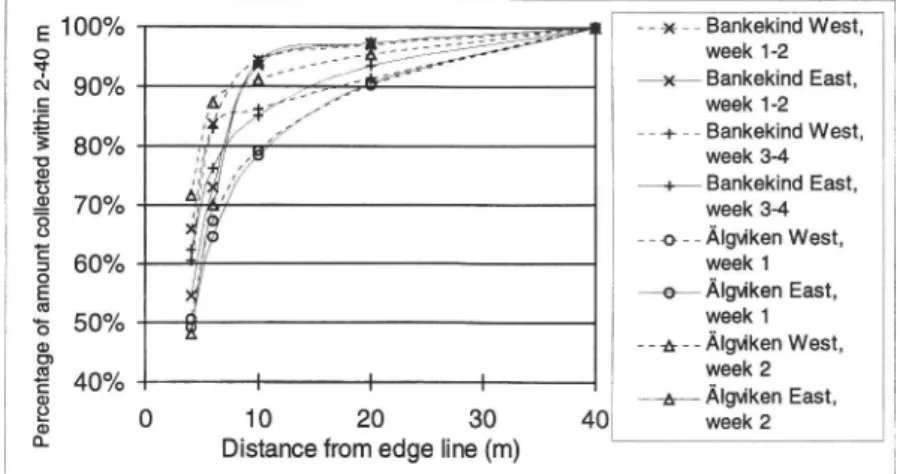
compar-G. Blomquist, E. -L. Johansson / The Science of the Total Environment 235 (1999) 161 168 167 1 00% 90% _ - * _ _ Bankekind West, week 1-2 x Bankekind East, week 1-2 _ _ + _ _ Bankekind West, 80% 70% week 3-4 + Bankekind East, week 3-4 o - Älgviken West, 60% 50% week 1 _e Älgviken East, week 1 1s - Älgviken West, week 2 40% t % 0 1 0 20 Pe rc en ta ge of am ou nt co ll ec te d wi th in 2-40 m 30 40 week 2 Distance from edge line (m)
+ Älgviken East,
Fig. 9. Distribution of the relative amount of deposited NaCl at each transect and time period.
ing the periods; the deposition on the east side was greater during the second week in Älgviken which coincided with strong solely westerly winds (Table 1). In Bankekind the deposition was notably higher on the east side weeks 3 4 when
there was a high percentage strong westerly winds
compared to the rst 1 2 weeks when there were more easterly than westerly winds, although the westerly winds were stronger (Table 1).
McBean and Al Nassri (1987) concluded that 90% of the total amount of deposited salt was found within 13 m. However, at roads with higher
velocities (80 and 100 km h ) no samples were
taken 1 6 m from the edge of the road where
most likely a large amount of deposition occurs. In our investigation 90% or more of the total deposition between 2 and 40 m has occurred within 20 m at all transects (Fig. 9).
Data from the nearest precipitation stations in the nationwide network, Aspvreten and Tyresta (Fig. 2), show that the depositions of Na and Cl vary considerably during February and March 1997 (Fig. 10). In the 400 m pro le the deposition at 100 m seems to be in accordance with back-ground values (Fig. 10), which means that some deposition has occurred between 40 and 100 m.
However, since there is no consistent background
value for NaCI-deposition, and since the
con-" Aspvreten, March Tyresta, March _____ Na CI (m g L" ) N CD & 01 0) *I 00 Tyresta, Feb ______ * Aspvreten, Feb ... 0 Bankekind, distance (m) 100
Fig. 10. NaCl-concentration in deposition 100 400 of the road at Bankekind as compared to regional background values for two precipitation stations (Aspvreten and Tyresta).
168 G. Blomqvist, E. -L. Johansson / The Science of the Total Environment 235 (1999) 161 168
tribution from background deposition is very small compared to the deposition resulting from road salt, no reduction for background deposition has been made in the calculations. The deposition between 40 and 100 m has been left out of account for the same reasons.
The high amount of deposition the third week in Älgviken is suggested to be a result of
resus-pension of road salt, which is considered to be of
importance for the increase of atmospheric
con-centrations of NaCl during winter (Nicholson and Branson, 1990).
Acknowledgements
This project has been nanced by the Swedish National Road Administration through the Cen-tre for Research and Education in Operation and Maintenance of Infrastructure (CDU) at the Royal Institute of Technology (KTH) in Stock-holm.
References
Bäckman L, Folkeson L. The in uence of de-icing salt on vegetation, groundwater and soil along highways E20 and 48 in Skaraborg County during 1994. VTI meddelande Nr 775A, 1995z45.
Bäckman L. Vintervägsaltets miljöpåverkan Resultat av jord- och grundvattenprovtagningar vid observation-sområden i Skaraborgs län 1994 1996. VTI Notat Nr 25, 1997 (in Swedish).
Dragsted J. Deicing salt and roadside trees, Vejdirektoratet, Denmark, Statens vejlaboratorium. Laboratorierapport 46, 1980:77 (in Danish, English abstract).
Eliasson Å. Spridning av vägsalt kring vägar. Göteborgs Uni-versitet: Projektarbete, Naturgeogra ska Institutionen, 199634 (in Swedish).
Ericsson B. Projekt Restsalt. En sammanfattning av kunskap-släget. Delrapport, Vägverkets publ. 1995:62, 11 pp. (in Swedish).
Harrison RM, Johnston WR, Ralph JC, Wilson SJ. The
bud-get of lead, copper and cadmium for a major highway. Sci
Total Environ 1985;46:137 145.
Hautala E-L, Rekilä R, Tarhanen J, Ruuskanen J. Deposition
of motor vehicle emissions and winter maintenance along roadside assessed by snow analyses. Environ Pollut 1995;87:45 49.
Hewitt CN, Rashed MB. An integrated budget for selected pollutants for major rural highway. Sci Total Environ 1990;93(1990):375 384.
Hofstra G, Hall R. Injury on roadside trees: leaf injury on pine and white cedar in relation to foliar levels of sodium
and chloride. Can J Bot 1971;49:613 622.
Hofstra G, Hall R, Lumis GP. Studies of salt induced damage to roadside plants in Ontario. J Arboricult 1979;5(2):25 31. Jones PH, Jeffrey BA, Watler PK, Hutchon H. Environmental
impact of road salting state of the art. The Research and Development Branch, Ontario Ministry of
Transporta-tion and CommunicaTransporta-tions, RR 237. 198653.
Karlqvist L. Vinteravfallet från väg och dess fixering i markpro len, Kvartärgeologiska avdelningen. Uppsala Uni-versitet: Forskningsrapport, Report 1974:11 (in Swedish). Kelsey PD, Hootman RG. Deicing salt dispersion and effects
on vegetation along highways, case study: deicing salt depo
sition on the Morton arboretum. In: D Itri FM, editor.
Chemical deicers and the environment. Chelsea, Michigan: Lewis, 1992:253 281.
McBean E, Al Nassri S. Migration pattern of de-icing salts from roads. J Environ Manage 1987;25:231 238.
Nicholson KW, Branson JR. Factors affecting resuspension by
road traf c. Sci Total Environ 1990;93:349 358.
Pedersen PA, Fostad O. Effects of deicing salt on soil, water and vegetation. Part I: Studies of soil and vegetation, MITRA nr. 01/96, Norges landbrukshogskole, Institutt for Plantefag, 1996:65 (in Norwegian, English summary). Persson AR, Royseland J. Skader på omliggende gronnsakareal
ved bruk av NaCl på vinterveg, Stenciltrykk nr. 36, Institutt for gronnsaksdyrking, Norges Landbrukshogskole, Ås, ISBN
82-576-5596-1, 1981229 (in Norwegian).
Pilon PE, Howard KWF. Contamination of subsurface waters
by road de-icing chemicals. Water Pollut Res J Canada 1987;22(1):157 171.
Rohr PK. Effects of deicing salt on soil, water and vegetation. Part II: Examination of soil and effects of deicing salt in selected soil type areas, MITRA nr. 02/96, Norges land-brukshogskole, Institutt for Plantefag, 199638 (in Norwe-gian, English summary).
Rutter AJ, Thompson JR. The salinity of motorway soils. III Simulation of the effects of salt usage and rainfall on sodium and chloride concentrations in the soil of central reserves. J Appl Ecol 1986;23:281 297.
Simini M, Leone IA. Studies on the effects of de-icing salts on