www.vti.se/publications Anne Bolling Mats Lidström Mattias Hjort Staffan Nordmark Håkan Sehammar Leif Sjögren Anders Genell Gunilla Sörensen
Improving the realism in
the VTI driving simulators
Shake final report
VTI rapport 744APublisher: Publication:
VTI rapport 744A Published: 2012 Project code: 200917 Dnr: 2006/0764-25 SE-581 95 Linköping Sweden Project:
Shake
Author: Sponsor:
Anne Bolling, Mats Lidström, Mattias Hjort, Staffan Nordmark, Håkan Sehammar, Leif Sjögren, Anders Genell and Gunilla Sörensen
VTI
Title:
Improving the Realism in the VTI Driving Simulators. Shake Final Report.
Abstract
The Swedish Road and Transport Research Institute (VTI) has three advanced moving base driving simulators. The aim of this project was to develop and implement new models concerning vibration, noise and graphics in order to improve the realism in the simulators. Moreover, a validation study was to be conducted.
Within the frame of the project the following were achieved;
• improvement of the tyre/road vibration models,
• improvement of the motion system by changing the rotation centre,
• improvement of the noise module facilitating reproduction of noise from tyre/road, • synchronization of the impressions from graphics, noise and vibrations caused by the road surface.
The validity of the models was tested in the VTI Simulator III. Statistical testing of differences between the car and the simulator indicated absolute validity for the subjective ratings of evenness and noise level and the objective measure speed, with the exception of areas surrounding speed limit signs where only relative validity was found. Relative validity was also indicated for the variable overall comfort. The results from the different validations show that the improvements have been successful and the driver in the simulator can now see, hear and feel the sensation of any road surface irregularities exactly when the wheels hit that part of the road. However, several improvements in the simulator models can still be desired.
Keywords:
simulator, model, validation, vibration, noise, graphics, speed
Utgivare: Publikation: VTI Utgivningsår: 2012 Projektnummer: 200917 Dnr: 2006/0764-25 581 95 Linköping Projektnamn: Shake Författare: Uppdragsgivare:
Anne Bolling, Mats Lidström, Mattias Hjort, Staffan Nordmark, Håkan Sehammar, Leif Sjögren, Anders Genell och Gunilla Sörensen
VTI
Titel:
Förbättrad realism i VTI:s körsimulatorer. Shake slutrapport.
Referat
Väg- och transportforskningsinstitutet (VTI) har tre avancerade körsimulatorer med rörelsesystem. Syftet med detta projekt var att utveckla och implementera nya modeller för grafik, vibrationer och buller, allt i syfte att öka realismen för föraren i simulatorn. Vidare skulle en valideringsstudie genomföras.
Inom ramen för projektet uppnåddes följande: • Utveckling av ett nytt grafiskt programpaket
• Förbättring av modellerna för vibrationer på grund av däck/väg
• Förbättring av rörelsesystemet genom förskjutning av rotationscentrum
• Förbättring av modulen för buller, genom återskapande av däck- och vägbuller. • Synkronisering mellan vägytans grafiska presentation, buller och vibrationer .
Modellernas validitet testades i VTI:s simulator III. Statistisk testning av skillnader mellan verklig bil och simulator indikerade absolut validitet för subjektiva bedömningar av vägytans jämnhet och tysthet och för det objektiva måttet hastighet, med undantag av områden där hastighetsgränsen ändrades. I dessa områden erhölls endast relativ validitet eftersom både accelerationer och retardationer var snabbare i simulatorn än i verklig bil. Relativ validitet indikerades också för det subjektiva måttet generell komfort. Resultaten från de olika valideringarna visar att förbättringarna har varit framgångsrika och föraren i simulatorn kan nu se, höra och känna ojämnheter i vägbanan exakt när hjulen träffar dessa. Fortfarande återstår dock många möjligheter till ytterligare förbättringar i simulatormodellerna.
Nyckelord:
simulator, modell, vibration, buller, grafik, hastighet, validering
Preface
The project Shake described in this report started in 2006 and was completed in 2012. It was initiated and financed by the VTI.
The authors have contributed with different parts in the text as follows; Data collection: Leif Sjögren.
Open format for road description and Visual simulation of road: Mats Lidström. Vibrations: Staffan Normark, Håkan Sehammar and Mattias Hjort. Parts of this text have been published in the Journal of Computing and Information Science in Engineering, Vol 11, December 2011 under the title “An Approach for Realistic Simulation of Real Road Condition in a Moving Base Driving Simulator”. Noise: Anders Genell.
The remaining parts are written by Anne Bolling and Gunilla Sörensen, whom also edited this report.
Many others have also contributed to the completion of this project. I wish to thank everyone who has been committed in various ways!
Linköping, November 2012
Anne Bolling Project manager
Quality review
Review seminar was carried out on the 29 October in 2012 where Sogol Kharrazi reviewed and commented on the report. Anne Bolling has made alterations to the final manuscript of the report. Jonas Jansson examined and approved the report for
publication on 3 December 2012.
Kvalitetsgranskning
Granskningsseminarium genomfört 29 oktober 2012 där Sogol Kharrazi var lektör. Anne Bolling har genomfört justeringar av slutligt rapportmanus. Jonas Jansson har därefter granskat och godkänt publikationen för publicering den 3 december 2012
Table of Contents
Summary ... 5
Sammanfattning ... 9
1 Background and aim ... 11
1.1 Driving simulators ... 11
1.2 The VTI Driving Simulators ... 11
1.3 The aim of the project ... 12
2 Data collection ... 13
2.1 Advanced collection of in-field road data ... 13
2.2 Road surface characteristics used in the road model ... 15
2.3 Discussion – Data Collection ... 16
3 Open format for road description ... 17
3.1 The OpenDRIVE® extension ... 17
3.2 Discussion – Open format for road description ... 18
4 Visual Simulation of Road, VISIR ... 19
4.1 VISIR technical data ... 19
4.2 Configuration of VISIR ... 20 4.3 Database ... 20 4.4 VISIR features ... 20 4.5 Communication ... 20 4.6 Discussion – VISIR ... 21 5 Vibrations ... 22 5.1 Vibration table ... 22 5.2 Literature ... 23
5.3 The vibration models... 23
5.4 Shock absorbers ... 28
5.5 Results with the improved vibration model ... 29
5.6 Calibration of the vibration model ... 30
5.7 Discussion – Vibrations ... 30
6 Noise... 32
6.1 Sound environment in a vehicle ... 32
6.2 Background ... 33
6.3 Tyre-road noise measurements ... 34
6.4 An auto Regressive model ... 35
6.5 Road surface profile spectrum ... 36
6.6 Joints, edges and puddles ... 39
6.7 Discussion – Noise ... 44 7 Results ... 45 7.1 Validation studies ... 45 7.2 Discussion – Results... 45 8 References ... 47 Appendix I ... 49 Appendix II ... 59
Improving the realism in the VTI driving simulators. Shake final report
by Anne Bolling, Mats Lidström, Mattias Hjort, Staffan Nordmark, Håkan Sehammar, Leif Sjögren, Anders Genell and Gunilla Sörensen
VTI (Swedish National Road and Transport Research Institute) SE-581 95 Linköping Sweden
Summary
Ever since the first VTI simulator in the early 70ties the simulator software has been continuously improved. The aim of this project called Shake was to develop and
implement new models concerning vibration, noise and graphics in order to improve the realism in the simulator. Moreover, a validation study was to be conducted.
The following improvements were desired:
• Development of new graphical image generator software • Improvement of the tyre/road vibration models
• Improvement of the motion system by changing the rotation centre • Improvement of the noise module facilitating reproduction of noise from
tyre/road
• Synchronization of the impressions from graphics, noise and vibrations caused by the road surface.
In order to achieve these improvements the following parts were included in the project.
Road characteristic data collection
A number of road surface characteristics were collected. The longitudinal profile was used as input to simulate realistic unevenness. The longitudinal slope was used to support the up and down hill effects. The mean transverse profile was used to create the effects of transverse unevenness such as rut depth shapes and also to create sections with water ponds. The crossfall parameter was used to support the slope of the transverse shape.
The measurement system used was VTI Laser RST, designed and built for high precision monitoring of the road surface condition.
Open format for road description
The vehicle’s position on the road surface is an important parameter in many advanced driving simulators. Hence, a comprehensive definition of the road is necessary, an open format is desired, and would make it possible to share road data between simulators. OpenDRIVE® provides such a tool. In OpenDRIVE® a road is described by its geometry, lanes and objects. VTI has used OpenDrive® since 2007 and has added a patch module to this standard, and has also developed an extension where the surface material is translated not only to visual appearance, but also to sound and vibration sensations of the surface.
The graphical package VISIR
The graphical package VISIR has been developed with the aim of creating a visual environment to be used together with other simulator equipment. It generates a
complete virtual presentation of the world as seen from a viewer`s perspective, normally the driver but other viewer positions are also possible.
New vibration model
A new vibration model based on measured road profiles has been developed. The most important improvements are;
• A new model for representing the wheels with a lateral stiffness component and a relaxation length model.
• Different locations for the centre of rotation, of vibrations induced in the vehicles roll behaviour, have been investigated and a new location has been implemented.
• The control of the motion system has been adapted to account for the roll centre position.
Noise model
A new noise model has also been developed. The approach has been to create a realistic sound experience for the driver with relatively simple means based on standard road surface roughness measurements.
This noise model comprises only three main parts. One part is the noise generator that very simply mimics the spectrum variation of the noise due to speed variations by applying an adaptive low-pass filter to a white noise signal. Another part is the static transfer function that is estimated from road texture data and in-car noise measurements. A third part is the sound effect generator that creates events such as driving through a pool of water or driving over a crack in the road.
Synchronization of the models
The purpose of all the improvements of the graphics, the vibration models and the noise model is to increase the realism of the sensation experienced when driving the
simulator. Hence, these models have been synchronized. The driver will be able to see, hear and feel the sensation of any road irregularity exactly when the wheels hit that part of the road. This makes it possible to create different areas on the road surface such as patches, pot holes and bridge edges.
Validation
The validity of the models was tested in the VTI Simulator III. Participants graded the quietness and evenness of the road surface and the overall comfort, when driving the roads both in the simulator and in real traffic. Furthermore, speed data were recorded. Statistical testing indicated absolute validity for the subjective ratings of evenness and quietness and the objective measure speed, with the exception of areas surrounding speed limit signs where only relative validity was found. Relative validity was also indicated for the variable overall comfort.
In another study evaluating road surface quality, the realism of the presentation of different road surfaces in the VTI Simulator III was also rated. Those results showed high ratings for all roads, indicating that the roads were perceived as realistic.
Conclusions
The improvements have made it possible to simulate roads with irregularities and unevenness.
The results from the validation study show no significant difference between the car and the simulator for the measures quietness and evenness. This could suggest that we have succeeded in recreating the road surface noise and vibration. Regarding level of speed, validation studies have until now mainly shown relative validity. In this study, however, absolute validity was indicated when the speed limit was constant.
Based on the results, we recommend that future projects run in Simulator III use the new models and that the corresponding model improvements are implemented in and validated for the Truck Simulator and the Simulator IV.
Förbättrad realism i VTI:s körsimulatorer. Shake slutrapport
av Anne Bolling, Mats Lidström, Mattias Hjort, Staffan Nordmark, Håkan Sehammar, Leif Sjögren, Anders Genell och Gunilla Sörensen
VTI
581 95 Linköping
Sammanfattning
Ända sedan den första VTI-simulatorn utvecklades i början 70-talet har mjukvaran kontinuerligt förbättras. Syftet med detta projekt som kallas Shake var att utveckla och implementera nya modeller för vibrationer, buller och grafik för att förbättra realismen i simulatorn. Dessutom skulle en valideringsstudie genomföras.
Följande förbättringar har genomförts:
• Utveckling av ett nytt grafiskt programpaket
• Förbättring av modellerna för vibrationer från däck/väg
• Förbättring av rörelsesystemet genom förskjutning av rotationscentrum • Förbättring av modulen för buller.
• Synkronisering mellan vägytans grafiska presentation, buller och vibrationer.
För att uppnå dessa förbättringar ingick följande delar i projektet.
Insamling av vägdata
Ett antal av vägbanans egenskaper insamlades. Den längsgående profilen användes som indata för att simulera realistiska ojämnheter. Den längsgående lutningen användes för upp- och nerförsbackar. Den genomsnittliga tvärprofilen användes för att skapa effekten av tvärgående ojämnheter som spårbildning och vatten pölar. Vägens tvärfall användes för att skapa den tvärgående lutningen.
Mätsystemet som användes var VTI Laser RST, konstruerad och byggd för att med hög precision bedöma vägytans tillstånd.
Öppet format för vägbeskrivning
Fordonets position på vägbanan är en viktig parameter i många avancerade
körsimulatorer. Därför behövs en heltäckande definition av vägen och ett öppet format skulle göra det möjligt att utbyta vägdata mellan olika simulatorer.
OpenDRIVE ® är ett sådant verktyg. I OpenDRIVE ® beskrivs en väg av dess
geometri, körfält och objekt. VTI har använt OpenDrive ® sedan 2007 och har lagt till en modul och utvecklat ett tillägg till denna standard. I och med detta kan man till vägytan koppla inte bara utseende utan även ljud och vibrationer som beror på ytan.
Grafikpaket Visir
Det grafiska programpaket Visir har utvecklats i syfte att skapa en visuell miljö. Det genererar en komplett virtuell presentation av världen sett från en betraktares
perspektiv, normalt föraren, men andra positioner är också möjliga.
Vibrationsmodell
En ny vibrationsmodell baserad på uppmätta väg profiler har utvecklats. De viktigaste förbättringarna är:
• En modell för att representera hjulen.
• En ny placering av simulatorns rotationscentrum.
• Anpassning av rörelse-systemet till det nya rotationscentrumet.
Bullermodell
En ny ljudmodell har också utvecklats. Strategin har varit att skapa en realistisk ljud-upplevelse för föraren med relativt enkla medel. Modellen är baserad på mätningar av ojämnhet i vägbanan. Bullermodellen omfattar tre huvuddelar: en del består av en brusgenerator som efterliknar det spektrum av buller som uppstår på grund av
variationer i hastighet,en andra del är en statisk överföringsfunktion som beräknas med
hjälp av data från vägtextur och från bullermätningar i bilen och den tredje delen är en ljudeffektgenerator som skapar ljud från till exempel körning genom vatten eller över en spricka i vägen.
Synkronisering av modellerna
Syftet med alla förbättringar av grafik, vibrationsmodell och bullermodell är att öka realismen när man kör simulatorn. Därför har dessa modeller också synkroniserats. Föraren kan se, höra och känna en vägojämnhet exakt när hjulen träffar den delen av vägen. Detta gör det möjligt att uppleva skillnader i vägytan som uppstår på grund av till exempel lagningar, potthål och broskarvar.
Validering
Efter implementering av de nya modellerna har validiteten i VTI Simulator III testats. Deltagarna i valideringsstudien graderade tysthet, jämnhet och total komfort, när de körde på tre olika vägar, både i simulatorn och i verklig trafik. Vidare registrerades hastighetsdata. Statistisk testning indikerade absolut validitet för de subjektiva bedöm-ningar av jämnhet och tysthet och för det objektiva måttet hastighet, med undantag för hastigheten i områden kring skyltar med ändrade hastighetsbegränsningar där endast relativ validitet indikerades. Relativ validitet indikerades också för måttet total komfort. I en annan studie som utvärderar vägbanans kvalitet gjordes subjektiva bedömningar av realismen i presentationen av olika vägbeläggningar i VTI Simulator III. Dessa resultat visade höga betyg för alla vägar, vilket indikerar att vägarna uppfattades som realistiska.
Slutsatser
Förbättringarna har gjort det möjligt att simulera vägar med skador och ojämnheter. Resultat från valideringsstudien visar ingen signifikant skillnad mellan bil och simulator för tysthet och jämnhet. Detta kan tydas som att vi har lyckats återskapa ljud och
vibrationer från vägbanan. När det gäller hastighet, har valideringsstudier hittills främst visat relativ validitet. Resultatet från denna studie tyder på absolut validitet på sträckor där hastighetsbegränsningen är konstant.
Baserat på resultaten, rekommenderar vi att framtida projekt som körs i Simulator III använder de nya modellerna och att motsvarande modellförbättringar genomförs i och valideras för Simulator II och Simulator IV.
1
Background and aim
1.1
Driving simulators
The concept of a driving simulator existed as far back as in the early 1970ies.
Considerable safety research was performed focusing on the driving dynamics of cars, in which stability issues were important. At that time, simulator developers focused on creating a dynamically-correct simulator and studied how different vehicle parameters influenced stability.
Simulators were mainly used in aviation, primarily for training in the use of the cockpit instruments. In a car driving situation, however, the driver does not rely on instruments to the same extent. Instead, the surroundings and dynamic forces are more important. Hence, it soon became clear that a high fidelity driving simulator required a
sophisticated motion simulation, a detailed model of the vehicle’s dynamics as well as a detailed visual description of the road environment.
1.2
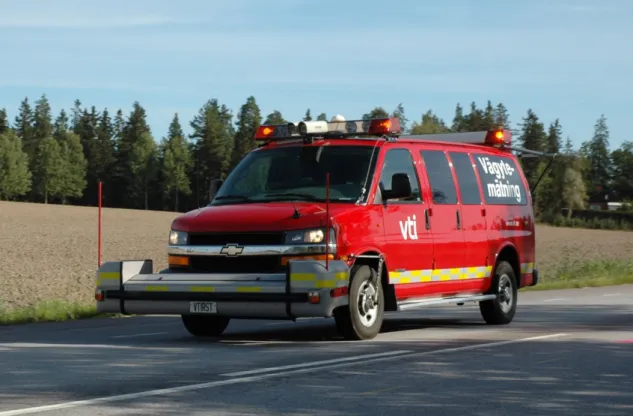
The VTI Driving Simulators
The Swedish Road and Transport Research Institute (VTI) has more than 40 years of experience of using simulators and is a leading authority in conducting simulator experiments and developing simulator. VTI has in 2012 three advanced driving simulators (see example in Figure 1). The software in the VTI Driving simulators is based on the concept of open source and in-house developed code. However, external models and software modules (e.g. commercial vehicle dynamics modules and
production code for active safety function) are sometimes integrated. Thanks to the full access to all the source code of the simulator software, the incorporation of external modules is normally easy to facilitate.
1.3
The aim of the project
The aim of this project was to develop and implement models in the VTI driving simulators and to develop new graphical image generator software. Specifically the following improvements were desired:
• Improvement of the tyre/road vibration models
• Improvement of the motion system by changing the rotation centre • Improvement of the noise module facilitating reproduction of noise from
tyre/road, surrounding traffic, and different types of warnings
• Synchronization of the impressions from graphics, noise and vibrations caused by the road surface. This includes impressions from damages and bumps, such as pot holes and bridge edges.
These improvements were conducted within the frame of the Shake project. The project also included validation of the models.
2
Data collection
When studying driver behaviour in the driving simulator it is desired that the representation of the road surroundings, the road geometry and the road surface
conditions become as real and authentic as possible. In order to improve the simulators in-field data has been collected through different methods.
2.1
Advanced collection of in-field road data
VTI has at its disposal a special measurement system, VTI Laser RST, see Figure 2, designed and built for high precision monitoring of the road surface condition. Moreover images and videos can be recorded along the route measured. This unique measurement system has been used to collect data for improvement of the models in the driving simulators.
Figure 2. VTI Laser RST, equipment to measure road surface condition and geometry.
2.1.1 The VTI Laser RST
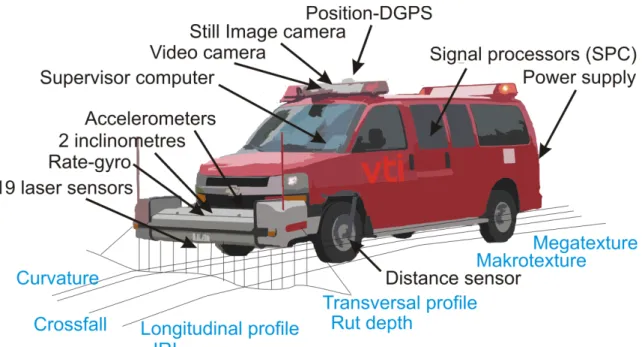
The VTI Laser RST consists of a data collection system and sensors mounted on a van. The system can measure the road condition in traffic speed (speed independent). Road conditions and geometry is defined as a number of measurable parameters, see Figure 3, representing relevant road surface characteristics.
The main part of the measuring system is the front bar. This bar contains 19 laser sensors, 2 accelerometers, 2 inclinometers and a rate gyro. To measure the traveled distance in the middle of the road, a pulse transducer is mounted on the left front wheel. On the roof the video and still image camera is mounted together with the GPS antenna. Inside the car a supervisory computer is placed for the operator to monitor and control the measuring process see Figure 3. The sensors are all connected to dedicated signal
processing cards. In principle there is one card for each measured road surface characteristic.
Figure 3. The Laser RST and sensors.
The profiles are sampled and stored at different frequencies depending on characteristic. A mean value per 20 meter is the standard presentation distance. The profiles collected (see Figure 4) can be used as input to the simulator models.
2.2
Road surface characteristics used in the road model
In the following a short description of each characteristic collected and used in the VTI Driving Simulators is given.
2.2.1 Longitudinal profile
The longitudinal profile is used as input to simulate realistic unevenness. The longitudinal profile is the basis for calculation of many parameters that describe unevenness along the road. Laser RST measures this profile almost continuously and the variable is presented as the height variance along the road. The longitudinal profile is not the complete ”true” geometric road profile, but is intended to cover a road profile including unevenness within the wavelength intervals of 0.5 – 100 m. The Laser RST collects three longitudinal profiles, one from each wheel track and one between the two tracks. Unevenness indices that can be calculated from the longitudinal profile are International Roughness Index (IRI), the German measure “Allgemeine Unebenheiten in Längsrichtung” (AUN) and the French “Notation par Bandes d´Onde” (NBO).
2.2.2 Longitudinal slope
The longitudinal slope is used to support the up and down hill effects. The longitudinal slope is a characteristic that represents the constructed or the natural topographic up and down slopes in the roads longitudinal direction. This parameter is measured with the help of an inclinometer mounted to sense the longitudinal slope. A compensation system is created to consider speed and accelerations.
2.2.3 Mean transverse profile
The mean transverse profile is used to create the effects of transverse unevenness such as rut depth and shapes, and also to create sections with water ponds. With the Laser RST a mean transverse profile is saved every meter.
2.2.4 Crossfall
The crossfall data is used in the road model. The road crossfall is the slope across the direction of travel. The crossfall is sometimes called transverse slope or banking.
2.2.5 Curvature
The parameter curvature is used to support the representation of effects of curves in the road model. The Laser RST measures the inverse of the road curvature by the use of a rate gyro. The curve information can also be gathered from the GPS coordinates.
2.2.6 Macrotexture
The macrotexture can be used as input to models that generates internal noise in the vehicle e.g. when passing a joint, but also for the general ambient noise. Macrotexture is a characteristic describing how rough the surface is, measured by the size of the
aggregates. This variable is normally measured and presented as the Mean Profile Depth (MPD). The Laser RST measures MPD in three tracks, the two wheel tracks and in the middle between them, resulting in a longitudinal profile sampled each millimeter.
2.3
Discussion – Data Collection
The ability to measure the profiles simultaneously and calculate indices makes the Laser RST highly valuable when testing new or altered simulator models. Synchronized with the collected RST-data, still images and video are recorded. This is also of considerable value when building a realistic environment scenario in a simulator.
As mentioned previously a number of road surface characteristics are collected simultaneously with the Laser RST. Presently only some of them are used as input to the driving simulator. Hence, more road characteristic variables could be utilized.
3
Open format for road description
The vehicle’s position on the road surface is an important parameter in many advanced driving simulators. Hence, a comprehensive definition of the road is necessary and an open format desired. An open format increases the flexibility when creating new roads in the simulator environment while an internal format obstructs the sharing of road data between simulators. Nevertheless most simulator environments have had their own proprietary formats for the logic description of the road system.
In 2006, however, an initiative to create an open format for the road descriptions was initiated by the German company VIRES. The format “OpenDRIVE®” has since then been accepted by several simulator constructors and may become part of a future standard of road description (VIRES, 2011).
OpenDRIVE® is a means of separating a road system into a set of roads, connected by junction areas or directly linked to each other. A road is described by its geometry, lanes and objects. The OpenDRIVE® specification of the road surface material indicates what material is used on each specific lane of the road.
VTI has used the OpenDRIVE® format for description of the logical road network in the VTI driving simulators since 2007. A detailed description of the OpenDRIVE® standard can be found at the homepage http://www.OpenDRIVE.org/.
3.1
The OpenDRIVE
®extension
There was no way within OpenDRIVE® to specify patches on the road surface – areas where the surface was defect or repaired with a different surface material. The existing object description method was not detailed enough, why VTI developed a patch method. This method defined a minor area, within a lane, where a different surface material is used. An example of the simulation of such areas is shown in Figure 5.
VTI has also developed a module where the material name is translated to visual appearance, and sound and vibration sensation of the surface. The patch module has been added to OpenDRIVE®, see Figure 6.
Figure 6. OpenDRIVE® and the VTI-extension.
The development of the VTI patch module resulted in an augmented version of the OpenDRIVE® standard version 1.3. Together with the VTI-extension this facilitates a unified way of describing the road properties where the tire position on road surface activates sound and vibration for each wheel according to the road and patch definitions.
3.2
Discussion – Open format for road description
The OpenDRIVE® format has improved the definition of the road and road surface significantly and made the Shake project possible to perform. The patch module developed by VTI has successfully improved the OpenDRIVE® format.
Introducing the OpenDRIVE® format as a standard for road description is
recommended, as an open format increases the flexibility when creating new roads and enables the sharing of road data between simulators.
4
Visual Simulation of Road, VISIR
When visualising the road or the rail, VTI driving simulators use the in-house
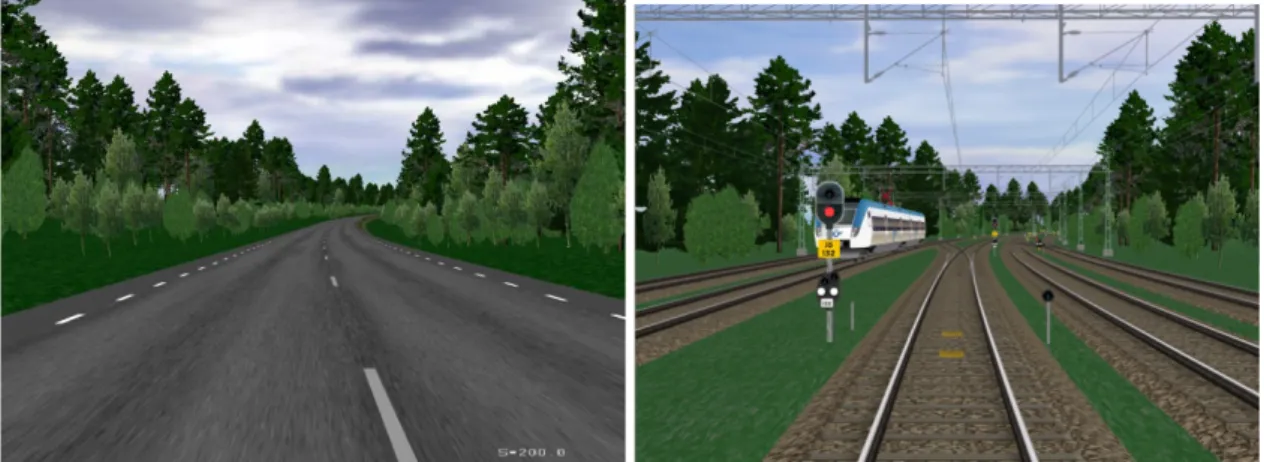
developed graphical image generator software VISIR, Visual Simulation of Road (or Rail). The intention of VISIR is to create an image generator that can be shared by several simulators and also by several users. The aim of the graphical package VISIR is to create a visual 3d-environment for use with other simulator equipment in different types of research and training simulators in a road or rail environment (see Figure 7). VISIR has been influenced by earlier in-house developed graphical packages, used in several research projects during the last years.
Dynamic views of the database are presented, including present status of all participating actors, as they have been defined via a network connection from an external computer. Alternatively, the system can be used in laptop-mode, where all controls are handled internally by a single computer.
It generates a complete virtual presentation of the world as seen from a viewer`s perspective. Even if the viewer normally is represented by the driver, other viewer positions in the environment are also possible. The viewer is always connected to an actor e.g. a vehicle, a train, a helicopter or other. Moving the viewer is accomplished by moving the connected actor.
VISIR should use open source libraries as much as possible. The only proprietary library used is the Mersive™ package, which handles geometric adjustments and edge blending.
Figure 7. Visual presentation of road (left) and rail (right).
4.1
VISIR technical data
The software VISIR is intended for use in all VTI driving simulators and the VTI train driver simulator. VISIR is developed under Windows XP, Windows 7 and Linux and uses OpenSceneGraph graphical engine and the Boost library. All code is written with object oriented methods in C++ using Visual Studio 2010 (Windows) and GCC (Linux). All software included in VISIR is licensed under the BSD-licence, except the following:
• OpenSceneGraph is licensed under the OpenSceneGraph Public License. • Mersive™ headers and libraries are the property of Mersive Technologies Inc.
VTI has been given permission to distribute Mersive™ headers and libraries with the code, but these still remain the property of Mersive Technologies Inc.
4.2
Configuration of VISIR
The world and graphical setup of VISIR is described in a set of definition files in XML-format (Extensible Markup Language). The main xml-file configures the setup of the software. It contains information of the database, the displays and the viewports for all participating image channels.
The database is defined in separate xml-files, which are linked to the visual simulation as defined in the configuration-file. The database itself delivers a visual environment visible from the viewer position.
4.3
Database
The database consists of two parts, a graphical and a logical. Any image or model format, supported by OSG can be used as the graphical part of the database, including 3DS and OpenFlight files. At present (2012), however, only OpenDRIVE® is
implemented as the logical part of the software database of the road version.
An additional data format, implemented by VTI, is using the OpenDRIVE® definitions to generate the road part of the graphical database, including road surface, road lines, objects et cetera. The OpenDRIVE® data is then supplemented by a resource file, which defines the qualities of the surfaces and the textures, defined by names in the
OpenDRIVE® file. The surrounding terrain is also added separately, all defined using the road as reference.
In addition to this, a set of actors/vehicles are defined as objects with individual internal states. For a vehicle this state can be spinning wheels or lighted headlights.
4.4
VISIR features
The following features are included in VISIR:
• Generation of road surface from OpenDRIVE®
files.
• Generation of surrounding terrain with trees and other objects from XML-description.
• Skydome.
• Dynamic lighting conditions, i.e. position, colour and intensity.
• Multiple screens per image generator and multiple viewports per screen. • Geometric correction and edge blending via Mersive Technology built in. • Dynamic fog (although no volumetric fog).
4.5
Communication
The control of the different actors and environmental properties of the database is handled by an external computer source or, in a lap-top version, by internal software.
This simulation kernel program computes all state dependent data such as vehicle speed and position. It communicates with the VISIR software via a network using a protocol where only the difference since the last update is sent in order to minimize the amount of data over the network. At the moment (2012) this data is sent (via UDP multicast) to all graphic channels simultaneously.
4.6
Discussion – VISIR
The development of VISIR has resulted in an improved visual presentation and made it possible to share software between users and simulators. Thanks to this the maintenance and development costs for each platform can be minimized. This graphical software package is continuously under development. A potential improvement is to add more variability to the terrain generation module in the VISIR software.
In the future, it is desired to simulate night conditions where all vehicle headlights are simulated.
5
Vibrations
Parts of this text have been published in the Journal of Computing and Information Science in Engineering, Vol 11, December 2011 under the title “An Approach for Realistic Simulation of Real Road Condition in a Moving Base Driving Simulator”. The vibrations were at an early stage generated by modelling each tyre as a vertical spring/mass/damper system, excited by a point following the road envelope.
Traditionally, however, the road data input has been in the form of FFT (Fast Fourier Transform) transformed road data, and a longitudinal profile with the same spectral distribution as the measured road had to be created. The resulting longitudinal profile consisted of only one wheel track, leading to vibrations that were purely vertical without any roll or lateral movement.
5.1
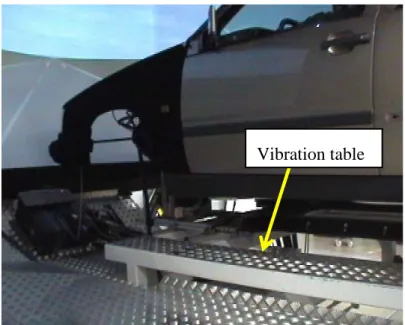
Vibration table
Inside the dome the cabin is mounted on a vibration table in order to get a more realistic road sensation (see Figure 9). This vibration table is not only producing road vibrations but also the expected roll, pitch and heave motion of the car body itself in relation to the road surface. The vibration table is controlled by three vertical actuators and one
horizontal actuator.
Vibration table
Figure 8. Vibration table, VTI Simulator III.
The actuator stroke is +/- 0.06 m and results in a working range of: • +/- 6 degrees roll
• +/- 3 degrees pitch
For the purpose of simulating road vibrations the bandwidth of the vibration table plays an important role. The bandwidth should be as high as possible to be able to follow the command values. The actuators are however not chosen to optimize bandwidth since they must be able to also simulate roll, pitch and heave of the car. The figure below (see Figure 10) shows the response of the vibration table in vertical direction to a white noise
input signal. The transfer function between commanded and actual measured values shows that the bandwidth is approximately 8 Hz.
Figure 9. Vertical acceleration and transfer function, vibration table.
5.2
Literature
In order to pick out the most suitable models to simulate tire vibrations, and for real-time simulations in the simulator, one must first look at the dynamic properties of a tire. The tire vibration characteristics for both high and low frequency ranges are described in Appendix I, which is based on a literature review by Gent and Walter (2005). The main points from this literature review are:
• For frequencies below 20 Hz, the tire vibrations can be described by a simple spring/damper model.
• For higher frequencies, the vibrations stem from tire imbalances, as well as road unevenness, and a more complex model must be used.
Due to the limitations of the driving simulator vibration table, it was decided to stick with the spring/damper model that was already implemented in the vehicle model.
5.3
The vibration models
The vibration model has been improved considerably, resulting in a major enhancement in simulation realism. The new vibration model is based on measured road profiles. The most important improvements are;
• A new model for representing the wheels has been developed, where a lateral stiffness component of the wheel has been introduced, together with a relaxation length model. This lateral stiffness affects the vertical position of the roll centre, and is needed for realistic roll and lateral movements.
110 110.5 111 111.5 112 112.5 113 113.5 114 114.5 115 -0.5 0 0.5 time sec acc [ m /s 2 ]
Vertical Acceleration fp12-6 08-Mar-2007 16:50:36
ZaccNoiseInput ZaccSimCabin 0 5 10 15 20 25 -20 -15 -10 -5 0 5 Ga in d b frequency Hz Transfer function
• Different locations for the centre of rotation, of vibrations induced in the vehicles roll behaviour, have been investigated and a new location has been implemented.
• The control of the motion system has been adapted to account for the roll centre position.
The vibration model uses an update frequency of 2000 Hz for the calculations, while the simulator movements are updated with a frequency of 200 Hz.
The vibration model was developed, and validated by using the following procedure: 1. A passenger car was equipped with accelerometers and rotation sensors, and the
vibrations from driving on a few different roads with a roughness varying from smooth to very bumpy were recorded.
2. The recorded vibrations were sent as input signals to the driving simulator motion system, to verify that the simulator was capable of reproducing the vibrations.
3. The road sections used for the vibrations measurements were measured with the VTI Laser Road Surface Tester, which measured the road profile with high precision using several laser beams.
4. The improved vibration model was developed, and with the measured road geometry as input, vibrations were generated and measured in the driving simulator. These vibrations compared well with those measured on the road during objective measurements.
In order to simulate also the highest vibration frequencies buttkickers were used. They were controlled by the signal from the audio channel. The level of the signal was chosen based on a subjective assessment of what gave the most realistic vibration.
5.3.1 Preliminary experiments in the simulator
In order to confirm the signal quality, the signals were measured in the simulator in the same way as measured in a Volvo V70 used during the field tests. No significant discrepancies could be detected. Test drivers on the other hand experienced the
vibrations, and especially the roll motion, as much more obtrusive in the simulator as in in the real car.
All the VTI driving simulators with moving bases utilize an outer lateral motion, moving the dome as well as the simulator cab sideways. This renders the lateral accelerations during lane changes and overtaking manoeuvres. Inside the dome the vibration table will render the roll motion of the car body around a roll axis defined by the geometrical constraints of the vibration table. If this axis does not correspond to the instantaneous roll centre of the real car motion some false signals (lateral accelerations) will be generated and disturb the driver’s impression.
These false cues can be minimized and counteracted in the simulator if an opposing lateral motion is added and synchronized with the roll motion. In principle it is then possible to choose the height of the instantaneous roll centre by this compensation from the outer lateral motion.
During the subjective evaluations of the vibrations in the simulator this height was increased and the change was obvious to all test drivers and considered beneficial in the sense that the effect of the roll motion was less obtrusive and the overall feeling
improved. These observations indicated that much more attention must be given to the position of the instantaneous roll centre and initiated a thorough analysis of the
mechanical hardware and theoretical vibration model itself to see if any factors had been overlooked in the original design. The following sections will deal with these problems in more detail.
5.3.2 Calculation of roll centre position in the vibration table
The vibration table is equipped with four hydraulic actuators, three vertical and one longitudinal (Figure 11) and is designed to have four degrees of freedom (vertical, longitudinal, roll and pitch). Two lateral rods (Panhard links) constrain the motion of the car body laterally. This arrangement is very similar to a suspension linkage for a stiff axle equipped with Panhard rods (Mitschke [5]). The roll centre is claimed to be situated at the middle of the Panhard rod. A stringent analysis confirmed the
conclusions in Mitschke [5] and the instantaneous roll centre was found not to move more than +20 mm vertically and laterally when the vibration table actuators produced a roll angle of +7 deg. On the other hand the position of the rotation centre was situated far lower than assumed earlier and hence a correction motion with the outer lateral motion was added to move the instantaneous roll centre upwards.
Figure 10. Principles of the VTI Simulator vibration table (rear view).
5.3.3 Original vibration model
In the original vibration model the wheels on each side of the vehicle were assumed to follow an experimentally measured track so the contact patch of every wheel could be excited vertically. The tracks on the left and right side of the car are different but were measured simultaneously. This motion was transferred vertically through the vertical stiffness and viscous damping of the tires, the suspension system with its links, springs,
Kinematical Roll centre Actuators
shock absorbers and roll stabilizers reduced to points straight above the wheel centres. These forces on the sprung mass from the four wheels would result in roll, pitch and vertical motion of the sprung mass.
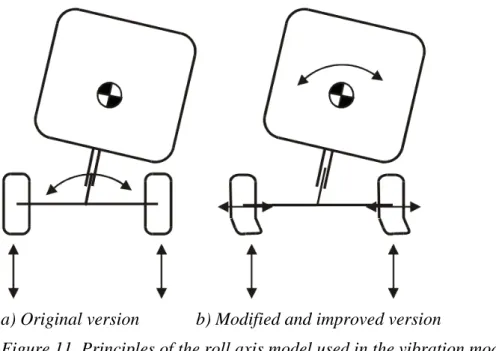
For the motion of the sprung mass a modified, so called roll-axis model was utilized (Figure 5 a) where the roll centre was decided by the geometrical design of the
suspension system. The result was some kind of roll motion around the fixed roll centre. It should be noted that the unsprung mass was assumed not to move laterally at all which resulted in a lateral motion and acceleration to the upper parts of the sprung mass including the head of the driver.
5.3.4 Improved vibration model
The preliminary experiments in the simulator indicated that the measured values from the simulator model for vibrations compared well with theoretical calculations. The vertical position of the instantaneous centre of rotation had to be raised above the mechanical roll centre of the suspension system. The unsprung mass had to have a lateral degree of freedom and hence the lateral tire stiffness was introduced into the vibration model. If this stiffness is very high the roll motion approaches a motion
around the kinematical roll axis and if it is very low, the rotation occurs mainly around a longitudinal axis running through the centre of gravity. Thus there will be a lateral motion between the tire rim and the contact patch between the tire and the road. Due to the rotation of the wheels the contact patch strives to creep back to a position straight under the wheel centre delayed by a factor based on the relaxation length of the tire. This is in fact the key factor in the modified vibration model. The vertical disturbances due to the unevenness of the road induce a roll motion of the sprung mass around its centre of gravity. The unsprung mass moves laterally and the lateral stiffness of the tires builds up a reaction force, but this force tends to approach zero due to the creep
mechanism in the contact patch when this is constantly moving to a position straight under the wheel centre. The relative roll motion between the sprung and unsprung masses still occurs around the so called roll axis defined by the kinematics of the
suspension system, but due to the lateral motion of the unsprung mass the instantaneous centre of rotation in the new model is positioned higher up in the vertical direction, see Figure 12.
a) Original version b) Modified and improved version
Figure 11. Principles of the roll axis model used in the vibration model.
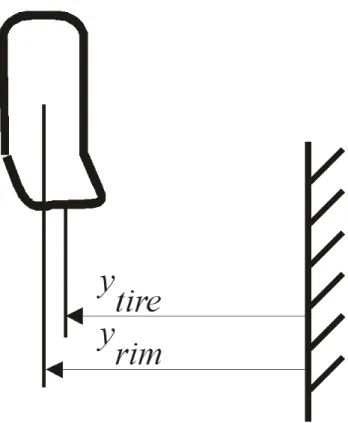
The connection between the lateral positions of the tire ytire and the rim yrim (Figure 13)
was given by a simple first order filter;
rim tire tire y T y T y + 1⋅ = 1 ⋅ where u T =δrelax
The value of δrelax depends on the specific tire characteristics.
In this expression the longitudinal speed u of the vehicle is not allowed to be less than a certain threshold value when the vehicle approaches a full stop.
Figure 12. Lateral stiffness of tire
The reaction force index on the sprung mass is given by
)
(
rim tire tirlat yC
y
y
F
rim=
−
−
where Ctirlat (N/m) is the lateral stiffness of the tire. The reaction force will quickly
decrease for low frequencies due to the creeping effect while at higher frequencies the tire will more and more act as a pure, lateral spring.
5.4
Shock absorbers
Viscous damping is created by the shock absorbers. This damping is highly nonlinear in its nature. Especially there is a great difference between the compression and the
expansion phases. Further the motion in the suspension system is damped by friction losses in bushings and linkage systems. These are very difficult to measure and/or estimate but are important to the impression of the vibrations from the road. In Reimpell [6] a lumped value of + 100 N per wheel is estimated and a similar quantity is added as very steep truncated damping around the origin in the shock absorber characteristics. An example is shown in Figure 14.
Figure 13. Example of shock absorber characteristics with added Coulomb friction.
5.5
Results with the improved vibration model
In order to validate the new model, measurements were performed on one rural road and in the simulator at the speed of 70 km/h. The replayed signals from these field
measurements were after some signal analysis compared with the signals from the vibration model in the simulator. In Figure 15 the results in Power Spectral Density (PSD) are depicted and it is clear that the curves are very similar in the region over 0.5 Hz. The difference that can be noted in the spectra below 0.5 Hz is due to high pass filtering of the road profiles before entering the vibration model. Wavelengths over 100 m are very unreliable and hence the profiles are filtered.
Figure 14. Comparison between Power Spectral Density (PSD) diagrams for vibrations measured in the simulator and in the real car (Field Test). Top diagram the roll
velocity. Bottom diagram vertical acceleration. Speed is 70 km/h.
5.6
Calibration of the vibration model
One problem that occurs in simulators is that the level of vibration is experienced
rougher in the simulator than on the real road. In order to deal with this problem a “scale factor” is used. When modelling the vibrations, different levels of road roughness are implemented simply by changing this scale factor.
The calibration of the scale factor was performed as follows. A rather rough road was measured and the road profiles implemented in the vibration model (and the simulator). Five drivers drove this road in a real car at 70 km/h and then immediately afterwards in the simulator where two settings (or scale factors) were presented. The driver’s task was to determine which of the two settings corresponded best to the real road. The results indicated that the vibration motion in the simulator was far too obtrusive and there seemed to be a consensus of choosing a scale factor around 0.2. Ideal the chosen scale factor should be 1.0 which equals measured vibrations on the real road.
5.7
Discussion – Vibrations
Because of its capabilities to reproduce cabin vibrations in the ride comfort range, VTI Driving Simulator III proved to be highly useful to simulate road irregularities and unevenness. In order to adjust the simulator vibration models to the theoretical models a new location of the centre of rotation has been implemented.
However, a scale factor around 0.2 had to be used for the vibrations to give the test subjects a similar impression as on the real road. The study gave no explanation for the preference of this rather low scale factor. This is of course a rather confusing result.
Hence, every step in the measurement chain from measuring the road to the signals in the simulator was checked and rechecked again by measurement with redundancy, but no explanation was found.
One could speculate about the effects of the high pass filtering of the road profiles where the long wavelengths of the road tracks are filtered away and there might be artefacts left in the signal close to the filter frequency.
Another explanation of this disparity could be that the vibrational motion inside a dome where the driver is sitting quite close to the video screens makes the motion more obtrusive than driving a car in an open landscape. The video landscape projected on the screens is not modified in any way to compensate for the vibration motion.
It would also be interesting to compare the vibrations experienced in the described experiment with the vibrations that will be experienced in a simulator without any dedicated vibration table inside the dome. This might assess the importance of the visual cues during vibration.
6
Noise
6.1
Sound environment in a vehicle
The tyre/road noise, engine noise and aerodynamic noise (wind noise) are the main contributors to the sound environment in the car under normal driving conditions. At low speed the engine noise is dominating and at very high speed the wind noise
becomes more dominant, but for a speed range between approximately 30 and 120 kph the tyre/road noise is the dominating source. The tyre/road noise increases with speed – to what extent is determined by which mechanism and transfer path is dominating at the particular speed.
In order to reduce the noise, car manufacturers generally adopt one of two strategies; isolating or damping the cabin, or fit the car with quieter tyres. The former strategy is becoming increasingly difficult to adopt as demands increase for lighter constructions that are easily assembled. Quieter tyres are fitted mainly by premium segment brands with wide tyres and powerful engines, partly to avoid masking the engine sound with tyre noise.
The tyre/road noise is generated when the tyre is rolling across a surface. The combined irregularities of the tyre and the surface give rise to vibrations in the tyre that partly are propagating into the vehicle and partly generates noise at the contact point. The
tyre/road noise that reaches the driver through two main paths: one path is represented by noise that is generated at the contact point and is radiated through the cabin partitions to the driver (airborne path), the other path is represented by vibrations in the tyre that are propagating through the construction causing noise to be radiated from vibrating parts (structure borne path), which is illustrated in Figure 16.
Figure 15. Air borne (top) and structure borne (bottom) sound propagation into a car cabin.
The tyre/road noise is stochastic in character, and mostly lack salient tonal components. One exception is tyres with poorly designed tread pattern that through regularly spaced tread blocks give rise to a tonal sound. Inside the car the noise is dominated by the low frequency content, due to the physical properties of the transfer paths. The directivity of the noise source at the contact point is also contributing to the low frequency dominance inside the car, which can be noted when passing a vertical wall, e.g. inside a tunnel, that reflects high frequency noise back into the car.
6.2
Background
A literature survey was performed using sources available to the VTI library in Swedish and English published after 1990. No references directly related to tyre-road noise were found, but some related to simulator studies where "realistic road noise" was used, although without specifying any properties.
The more interesting references, see appendix II, can be divided into two categories: those who deal with tyre-road noise radiation from a theoretical point of view and those who deal with tyre-road noise in relation to the needs and demands from the automotive industry, where such issues are commonly named NVH – noise, vibration and
harshness.
In the first category a number of studies were found regarding modelling of sound radiation close to the tyre surface and even more studies were found regarding modelling of mechanisms responsible for generation and propagation of vibrations in the tyre. Unfortunately all models presented in these articles are much too complicated and detailed to be used in a real-time simulator environment, not only due to
computational cost, but also due to the need for large sets of highly detailed input data regarding the construction, rubber blend etc. for the particular tyre. Even with access to the needed input data, the results in many cases need to be validated against
measurements or against other models.
In the second category there are some references dealing with tyre-road noise from various viewpoints, but no tyre-road noise models useful for a simulator environment was found. To meet the demands from the automotive industry there are some
commercial products specialized for measuring, analysing and auralizing (the acoustic equivalent to visualising) tyre-road noise. Such systems are mostly built on a large set of measurements of transfer functions from all engine mount points and contact points between wheel suspension, chassis and body to the interior of the car. Such sets are generally called Transfer Path Analysis (TPA). The TPA is then combined with
theoretical calculations of effects from changing different properties such as stiffness of mount points or addition of sound insulation etc. Results from such calculations can then be quantified and can also be listened to through an updated auralization. While it would be possible to use such a system in the VTI driving simulators, they seldom take the road surface properties into account, and it would crave a large
investment in knowledge and equipment to be able to perform the needed measurements and adjustments. The aim of this project has instead been to achieve an environment that is "good enough" using a simpler model.
6.3
Tyre-road noise measurements
As a basis for the model development a number of recording of tyre-road noise were performed inside a Volvo XC70 driven at speeds between 50 and 90 km/h. At speeds below 30 km/h the engine noise was deemed too prominent to achieve valid tyre-road noise measurements. The pavement was Swedish type ABS 16 tarmac ("Asfaltbetong, Stenrik" roughly translating to Dense Asphalt Concrete) with a 16 mm maximum stone size. In order to obtain highest possible fidelity the recordings were done using a HEAD Acoustics HMSIII binaural recording mannequin placed in the passenger seat. The resulting spectrum can be seen in Figure 17.
Figure 16. Spectra of tyre-road noise inside a car cabin at 50, 70 and 90 kph.
The overall A-weighted sound pressure level can be seen to increase by approximately 5 dB(A) with a speed increase from 50 to 70 km/h, and by approximately 3dB(A) with a speed increase from 70 to 90 km/h.
The spectra show the same prominent negative slope with increasing frequency up to approximately 6 kHz where it levels, most likely due to that wind noise and rattle and squeak from the car interior is the dominating source in the high frequency range, and to that the dynamic range of the recording equipment has been reached – the dynamic range of the signal is larger than 100dB. The same spectra averaged within one-third octave bands can be seen in Figure 18.
Figure 17. One-third octave band spectra of tyre-road noise inside a car cabin at 50, 70 and 90 km/h.
6.4
An auto Regressive model
6.4.1 Simplification
In order to keep the model as simple as possible, some conditions were defined: 1. The contact between tyre and the road surface is modelled as a point.
2. The tyre follows the road surface profile perfectly without ever loosing contact. 3. The tyre is moving at constant speed at each momentary time step.
4. The transfer paths into the cabin, both air borne and structure borne are represented by one single linear transfer function.
These conditions are visualized in the diagram in Figure 19, where η(x) is the road surface profile and the tyre is rolling across the profile at the velocity V. The resulting vertical vibration velocity u(t) is chosen as the parameter generating the noise radiating into the cabin.
Figure 18. A simple model of a tyre rolling on a rough surface texture η(x).
A simple diagram of the resulting model can be seen in Figure 20. The road surface profile η(x) gives the surface profile height as a function of distance x. The vehicle moves at the velocity V [m/s] which provides a simple expression for the vertical displacement y [m] as a function of time through y(t) = η(V*t), which corresponds to the first box in the diagram. The second box corresponds to a time derivative of the vertical displacement, resulting in the vertical velocity u [m/s] of the tyre. Finally, the third box represents the combined transfer function H of all transfer paths between the contact point and the ear of the driver. This includes air borne as well as structure borne noise and also includes damping in the tyres.
Figure 19. Computation path from road texture η(x) to sound pressure p(t).
This approach includes a number of simplifications, e.g. avoiding taking the detailed physical properties of the contact between the tyre and the road into account. This model is intended to be as simple as possible to generate useful tyre-road noise and should not be considered a proper physical model.
Provided it is possible to determine the combined transfer function H, measurement data of η(x) can be fed directly into the model, but in most cases the simulated environment will likely just contain some data about type of pavement, such as maximum stone size, mean profile depth (MPD) and age or degree of wear, and generate a corresponding road surface profile as needed.
6.5
Road surface profile spectrum
In order to generate a realistic road surface profile signal, a representative measurement done at VTI of a profile spectrum from a newly laid pavement was used as reference. Figure 21 shows the measured road surface profile spectrum (dotted curve) together with two lines (dashed curve) whose crossing point, the "knee", represents the
wavenumber where the spectrum changes shape from flat to sloped. Included is also the response from a first order Butterworth low-pass filter (solid curve) showing how it is
possible to create a spectra shape similar to the measured profile spectrum, with very simple means. The knee in the example represents a wavelength of about 20mm which corresponds roughly to the expected maximum stone size (16mm for ABS 16).
Figure 20. Power spectral density of road texture compared to an estimated cutoff wavelength and an adapted filter.
A simple model for generating a profile spectrum can be seen in Figure 22, where white noise w(n) is filtered using a first order Butterworth low-pass filter G to provide a profile signal η(x).
Figure 21. Simple generation of road texture data, η(x), from ordinary white noise, w(n), using a first order Butterworth low pass filter.
6.5.1 The combined transfer function H
By knowing input data, in this case the road surface profile spectrum, and measuring output data, in this case the noise spectrum inside the car, the combined transfer function H can be determined. The reference measurement of road surface profile and interior noise spectrum needs to be performed for each vehicle that should be modelled, unless the difference between a finished model and a new vehicle can be estimated e.g. by a simple level difference. In the current case H has been estimated for one vehicle
and one road surface profile using Burg's method. The model system was chosen through trial and error until the fit to the measured data was considered satisfactory, resulting in an autoregressive filter with 64 coefficients (cf Figure 23).
Figure 22. Comparison between measured frequency response and system-identified transfer function H.
The impulse response of the filter (cf Figure 24) shows the behaviour in the time
domain, and it can be seen that the filter rings for about 0.3 seconds, which corresponds well to the expected reverberation time inside a normal car cabin.
Figure 23. Impulse response of the system-identified transfer function H.
6.5.2 Results
The results from using the estimated transfer function together with a stochastically generated road profile signal can be seen in Figure 23. The model (markers) fit the measured data (lines) reasonably well, except for a slight overestimation by the model around 1 kHz at low speed. Subjective comparison with sounds from real traffic indicated validity of the model.
6.6
Joints, edges and puddles
A similar mechanism as for the tyre-road noise is responsible for generating the characteristic sound that occurs when crossing a sharp edge, such as a thermal expansion joint of a bridge or a cracks or pot holes in the road. Sudden vertical acceleration excites the tyre cavity resonances which radiate air borne and structure borne sound into the cabin. This vertical acceleration is modelled by a wheel with radius r being lowered to a depth of h into a hole with width w (cf. Figure 25).
Figure 24. Model of a wheel with radius r passing over a hole of width w causing a drop of height h.
The relationship between depth h, radius r and gap width w is given by:
The cavity resonances are tonal in character and are heavily damped, i.e. have a relatively short reverberation time, mainly due to the large viscous losses in the rubber of the tyre. Figure 26 shows recordings of a number of passes over a thermal expansion joint of a bridge concatenated into one time signal, exemplifying the transient nature of the sound as well as the semi random distribution of signal envelope shape.
Figure 25. Recorded time signal of noise from crossing a thermal expansion joint of a bridge.
The sound from an impulse excitation due to an edge of height h, or a hole that gives the same parameter h using the formula above, was modeled in a simple way by applying exponential envelop functions to sinusoids of frequencies corresponding to the first few harmonics of the tyre cavity resonance:
where A are the amplitudes of the tonal components, f are the frequencies and d are the damping factors of the envelope functions all given below. This formula is valid for constant speed, if it is not constant the overall volume must be adjusted by the vehicle speed, i.e. a 20% increase in speed yields a 20% increase in sound volume. The volume must also be scaled in the same manner for the height (or hole parameter) h.
Figure 26. Adaptation of frequency and damping values to measured data.
The damping factor (y-axis) for each harmonic frequency (x-axis) was determined to maximise the fit to the data (z-axis), using cross-correlation between model and measurement data. This was repeated in a trial and error effort until the relative
amplitudes of the harmonics allowed a satisfying optimization of damping factors for all three harmonics. The resulting relative amplitudes, frequencies and damping factors can be found in Table 1. The absolute amplitudes were determined by ear inside the
simulator cabin.
Table 1. Parameters for the polynomial model of tyre impulse noise.
Relative amplitude Frequency Damping factor
0 dB 25 Hz 4.5
-2 dB 41 Hz 11
-4 dB 47 Hz 11
A comparison of normalised time signals of measured and modelled impulse noise can be seen in Figure 28.
Figure 27. Comparison of measured and modelled time signal of tyre impulse noise.
Puddles or generally wet road surfaces also affect the noise that is generated. The physical explanation is that water on the road surface form a spray of small bubbles that burst randomly, creating a high frequency hiss determined mainly by the speed of the vehicle and the amount of water on the road. A very simple model to achieve this effect was created by using high frequency noise and applying random low frequency
amplitude and phase modulation. When listening, this was subjectively judged to give a satisfactory result. The resulting spectrum is presented in Figure 29.
Figure 28. Spectrum of modelled noise from driving through puddles in the road.
6.7
Discussion – Noise
The mechanisms involved in noise generation are very complex and a real time application of a detailed noise generation model that creates realistic noise and vibrations is a futile approach due to computation cost. In the VTI Simulators the approach is instead to create a realistic experience for the driver with relatively simple means based on standard road surface roughness measurements available to VTI. The model involves a number of simplifications, and comprises only three main parts: a velocity dependent noise generator, a static global transfer function and a sound effect generator. The noise generator very simply mimics the spectrum variation of the noise due to speed variations by applying an adaptive low-pass filter to a white noise signal. The static transfer function is estimated from road texture data and in-car noise
measurements. The sound effect generator creates events such as driving through a pool of water, by filtering and randomly phase-shifting high frequent noise, or driving over a crack in the road, by creating a highly damped sinusoid similar to that from tyre cavity resonance or suspension resonance. Modelled and measured road noise levels show reasonably good similarity, and the adequacy of the simulated road noise is indicated when listening.
The noise model described is well suited for real time simulation purposes, especially if a random road profile generation is used. The filters involved contain less than 64 coefficients, and only the first order filter used for road profile generation needs to be updated at each time step. The larger filter corresponding to the combined transfer function is static for each simulator run.
One aspect of the wet surface noise that has not been included is the low-frequent booming sound that occurs when the spray of water hits the underside of the car. Such a feature could be implemented in the future, if there would be need for e.g.