1
OCCUPANT DIVERSITY IN MODELLING AND EVALUATION
RELATED TO SOFT TISSUE NECK INJURIES IN LOW SEVERITY
IMPACT
Astrid Linder, Robert Thomson
Swedish National Road and Transport Research Institute (VTI) GÖTEBORG, Sweden
E-mail: astrid.linder@vti.se, robert.thomson@vti.se Mats Svensson, Anna Carlsson
Chalmers University of Technology GÖTEBORG, Sweden
E-mail: mats.svensson@chalmers.se, anna.carlsson@chalmers.se f
Paul Lemmen, Humanetics Europe GmbH WATERINGEN, The Netherlands, E-mail: plemmen@ humaneticsatd.com
Kai-Uwe Schmitt
Arbeitsgruppe für Unfallmechanik (AGU), ZURICH Switzerland
E-mail: schmitt@agu.ch
Ernst Tomasch
Graz University of Technology GRAZ, Austria
E-mail: ernst.tomasch@tugraz.at
ABSTRACT
It is well established that the risk of soft tissue neck injuries (or whiplash associated disorders) is higher for females than for males, even in similar crash conditions. Injury statistics from the mid 1960´s until today all show that females have a higher risk of sustaining such injury than males, ranging from 1.5 to 3 times higher. These injuries arise in one of the most frequent collision types and thus an important societal issue.
Testing and evaluation of automotive systems are essentially determined by crash test dummies representing the 50th percentile male crash test dummy. While this dummy corresponds to a 90th -95th percentile female with regards to stature and mass, it may not be applicable for assessing the biomechanics of females, particularly for injuries resulting from low velocities rear impacts. Females and males have different anthropometry and mass distributions which may influence the interaction of the upper body with the seat backrest and head restraint and thus the injury risk.
2
In this study the anthropometry and mass distribution of an average female was established. The anthropometry of the 50th percentile female for a rear impact crash dummy model was derived from data published in the scientific literature and data available to the consortium. This data was used to develop a finite element model of an average female dummy EvaRID (Eva – Female, RID – Rear Impact Dummy) and a new loading device called BioRID 50F. Both the numerical and physical models were based on the currently available rear impact dummy of an average male, the Biofidelic Rear Impact Dummy (BioRID) II.
Volunteer tests involving male and female subjects were performed. Analysis of the volunteer tests resulted in dynamic response corridors that were used in the evaluation of the EvaRID model. Initial evaluations of seat performance were also undertaken with the male and female versions of the BioRID II physical test devices. The results show how the design of the seats are sensitive to the occupant mass distributions and, in some cases, resulted in poorer performance when loaded with a smaller and lighter dummy model. Future safety evaluations need to be adjusted to account for different occupant size and gender.
1 INTRODUCTION
Whiplash Associated Disorders (WADs) also called whiplash injuries poses a huge burden to patients but also to insurers and the national health care systems. Euro NCAP assess that WAD results in an annual cost of over €10 billion to European society (EuroNCAP, 2012). Estimates for the European Union, based on (Kullgren et al. 2007), indicate that 300 000 citizens suffer whiplash injuries in the European Union annually, of which 15 000 result in long term suffering. More than 50 % of those injured are females (Storvik et al. 2009, Kullgren and Krafft 2010). Whiplash injuries also occur at relatively low velocity changes (typically <25 km/h) (Eichberger et al. 1996; Kullgren et al. 2003), and in impacts from all directions, although rear impacts are most frequently featured in accident statistic (Watanabe et al. 2000). This combination of high frequency and low impact severity results in a significant societal costs and exposure.
Current designs and evaluations of vehicle safety essentially address the average male. What has not been fully addressed in vehicle safety is the relative risk for injury based on gender. In the case of whiplash injuries, injury statistics from the mid 1960´s until today show that females have a higher risk of sustaining whiplash injuries than males, ranging from 1.5 to 3 times higher (Kihlberg 1969; O’Neill et al. 1972; Thomas et al. 1982; Otremski et al. 1989; Maag et al. 1990; Morris & Thomas 1996; Dolinis 1997; Temming & Zobel 1998; Richter et al. 2000; Chapline et al. 2000; Krafft et al. 2003; Jakobsson et al. 2004; Strovik et al. 2009).
The design focus for the average male car occupant has led to safety improvements for this occupant group. Concepts for whiplash protection seats have proved to be more effective for males than females (Kullgren & Krafft 2010). The risk reduction concerning permanent medical impairment was approximately 45% for females and 60% for males. These results suggest that the effectiveness of different seat concepts may vary when occupied by males and females. It is important to further validate these differences and to understand the reason behind such differences, in order to achieve better protection for females in particular, as well as for males.
Females and males have different anthropometry and mass distribution, which may influence the interaction of the upper body with the seatback and head restraint, and consequently the injury risk. For example, the deflection of the seat frame, back rest padding and springs may depend on the mass and/or the centre of mass of the upper body with respect
3
to the lever about the seatback hinge. The deflection of the structures of the back rest affects the plastic deformation, energy absorption and the dynamic head-to-head restraint distance, as well as the rebound of the torso (Svensson et al. 1993; Dolinis 2002; Viano 2003). The motion of the head relative to the head restraint may be affected by seated height in relation to the head restraint geometry. It has been reported that females have a somewhat different dynamic response in rear volunteer tests, such as a greater head x-acceleration, a greater (or similar) T1 x-acceleration, a lower (or similar) Neck Injury Criterion (NIC) value and a more pronounced rebound than males (Szabo et al. 1994; Siegmund et al. 1997; Hell et al. 1999; Welcher & Szabo 2001; Croft et al. 2002; Mordaka & Gentle 2003; Viano 2003; Ono et al. 2006; Linder et al. 2008; Schick et al. 2008, Carlsson et al. 2010; Carlsson et al. 2011). In addition, there are anthropometric differences between males and females, such as stature, weight, body part dimensions and mass distribution (Pheasant & Haslegrave, 2006).
Crash test dummies are used when developing and evaluating the occupant protection performance of a vehicle. The 50th percentile male crash test dummy correspond to a ~ 90th– 95th percentile female with regards to stature and mass (Welsh & Lenard 2001), resulting in females not being well represented by the existing low velocity rear impact male dummies; the Biofidelic Rear Impact Dummy (BioRID) and the Rear Impact Dummy 3 Dimensional (RID3D). Consequently, the current seats and whiplash protection systems are primarily adapted to the 50th percentile male without consideration for female properties, despite a higher whiplash injury risk in females.
2 OBJECTIVES
A European research effort was initiated in the 7th Framework project Adaptive Seat to Reduce Neck Injuries for Female and Male Occupants (ADSEAT) project. The overall objective of ADSEAT was to provide guidance on how to evaluate the protective performance of vehicle seat designs aiming to reduce the incidence of whiplash injuries for both males and females. Given the influence of gender on whiplash injury risk has been established and the known injury risk for females is higher, the ADSEAT project focused resources on the female occupants. To further explore and evaluate the performance of seat design with respect to gender issues, several objectives were identified in ADSEAT::
• Average female anthropometry: establish geometry and mass distributions of an average female seated in a car seat
• Virtual dummy model: develop a Finite Element Model of a crash test dummy of an average female.
• Physical dummy model: develop a first generation loading device for physical testing • Proof of concept: demonstrate the performance and establish future development needs for the assessment tools with relevant verification data for test devices
The ADSEAT project had a comprehensive scope and included the analysis of real world accident data, investigations of injury criteria, and guidelines for seat design beyond the scope of this paper.
4
3 METHODS
3.1 Average female anthropometry
The anthropometry of a rear impact crash dummy model of the 50th percentile female was established based on data found in the scientific published literature. The following data were identified as input to a test dummy: Dummy (model) total weight and if available, each assembly weight
• Seated height
• All related chest dimensions (depth and width) • All related pelvis dimensions (depth and width) • Lengths of limbs (distance between joints)
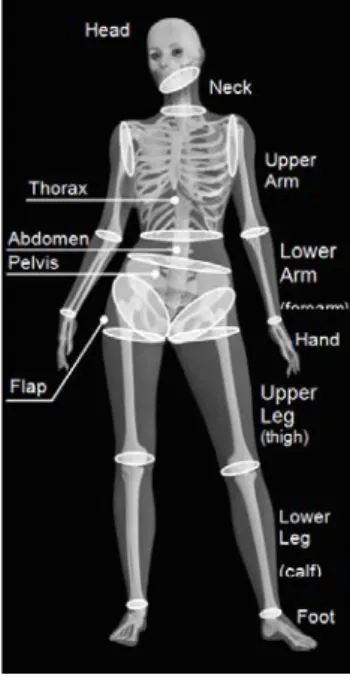
Examples of the relevant anthropometric segments of interest are illustrated in Figure 1.
Figure 1: Body segmentation based on Young et al. (1983)
The data for the 50th percentile female was primarily collected from studies by Schneider et al. (1983), Diffrient et al. (1974), and Young et al. (1983). Both Young et al. and Schneider et al. derived stature, weight, and seated height for the 50th percentile female from the National Health and Nutrition Examination Survey (HANES) of 1971–1974 by Abraham et al. (1979). According to Young et al. (1983), the HANES survey provides the most current and appropriate general population model available for US adult females. However, as Young et al.(1983) only considered a limited age range (21–45 years) compared to Schneider et al. (1983) (18–74 years), the latter source was used for extracting the anthropometric data. In addition, anthropometric data taken from the ergonomic programmes The Generator of Body Data (GEBOD), and the mannequin developed especially for the ergonomic analysis of cars (RAMSIS), was used to validate the collected data. Product specification from the BioRID II hardware dummy model was used for direct comparison of anthropometry data. The data sources identified above had to be synthesized into a specification for a 50th percentile female
5
model. Schneider et al. (1983) described in detail how the anthropometry was defined for the 5th percentile female as well as the 50th and 95th percentile male crash test dummies. This method was used to establish the anthropometry of the average size female model developed in the ADSEAT project for the use as assessment tools.
3.2 Virtual dummy model
The average sized female rear-impact Finite Element Dummy model, EvaRID (Eva - female/RID - Rear Impact Dummy) Finite Element (FE) model was developed in LS-Dyna. The process began by scaling down the existing BioRID II dummy model. Local re-meshing was required to compensate for time step and element distortion effects resulting from the scaling. To meet the anthropometric requirements in terms of mass and dimension, the longitudinal dimensions and mass were initially scaled to obtain values representing a 50th percentile female. Subsequently, breadth and depth dimensions were established based on the scaling method of each body segment in detail, described in Chang et al. (2010. Joint properties for the EvaRID V1.0 dummy model were adopted from the BioRID II dummy model and the curvature of the neck, spine etc. were the same for both models. A seat model representing the volunteer test set-up was constructed for the evaluation of the dynamic response of the EvaRID V1.0 model with validation data. The seat back and head restraint consisted of stiff panels which were covered in foam and lined with plush fabric. The stiffness of the supporting springs in the seat were measured and implemented in the Finite Element Model.
3.3 Physical dummy model
A loading device called BioRID 50F, generally representing the anthropometry and overall joint stiffness of a 50th percentile female, was built by modifying a BioRID II dummy. The BioRID 50F was assembled using modified parts originating from a BioRID II 50th percentile male dummy. Target dimensions and masses of the BioRID50F’s body segments were based on the EvaRID LS-Dyna Model described above. The main modifications involved the scaling of the torso jacket and reducing the length of the BioRID II spine by 2 segments and reducing the vertebral joint stiffnesses. BioRID II has neck muscle substitutes and these were equipped with weaker springs in the female version. Arm and leg segments were shortened and material was removed to better represent the 50th percentile female anthropometry identified earlier.
3.4 Proof of concept
The application of the surrogate occupants is the evaluation of automobile seats under rear-impact conditions. In particular, the assessment tools should detect and differentiate between different seat designs and anti-whiplash systems. To verify the function of EvaRID, comparison to general human (volunteer) response to EvaRID’s output under non-injury loading conditions is important. The basic function of BioRID 50F in sled tests on a laboratory seat as well as on different vehicle seats. The test results were compared to volunteer tests which used the same laboratory seat and to similar tests conducted by Euro NCAP with the male BioRID II dummy.
Test data from volunteer tests comprising male and female volunteers in identical test conditions were collected and analysed. The volunteers´ heads were equipped with a harness with tri-axial accelerometers mounted on the left side, and an angular accelerometer mounted
6
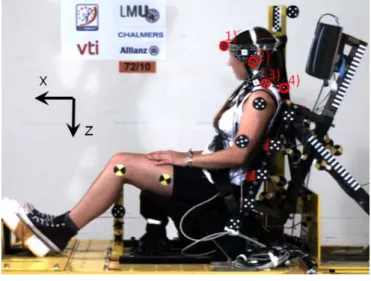
on the right side of the head, as close to the centre of gravity as possible. Two linear accelerometers, in x and z direction, were placed in a holder attached to the skin at four points near the spinal process of T1. The upper body was equipped with a harness with tri-axial accelerometers mounted on the chest. Linear accelerometers were placed on the bullet sled and on the target sled. The test setup and the position of markers and instruments on the volunteers are shown below (Figure 2). Additionally, the head-to-head restraint distance and contact time were extracted from the data set. The volunteers wore a lap belt during the test.
A series of rear impact sled tests comprising eight female volunteers, representing the 50th percentile female, were performed at a change of velocity of 5 km/h and 7 km/h. Additional volunteer tests with a greater initial gap between the head and the headrest were with a test group of eight female and eight male volunteers, at a change of velocity of 7 km/h. The test setup was essentially the same as the previous volunteer test series except for minor changes to the seat base design and head restraint made to simplify the mathematical modelling of the seat. The head-to-head restraint distance was increased to ~15 cm to delay head restraint contact. Due to the increased head-to-head restraint distance, the average acceleration was reduced to ~2g to ensure the safety of the volunteers.
The volunteers were selected based on their stature and mass being close to a 50th percentile female and male respectively, according to the University of Michigan Transportation Research Institute (UMTRI) study (Schneider et al. 1983). For the female volunteers, the stature ranged between 161–166 cm at an average of 163 cm, and the mass ranged between 54.5–66.8 kg at an average of 59 kg. For the male volunteers, the stature ranged between 171–179.5 cm at an average of 176 cm, and the mass ranged between 69.8– 81.0 kg at an average of 75 kg.
The data collected in the tests were analysed and performance corridors for relevant parameters were created. The corridors were defined over time and represent +/- 1 Standard Deviation (SD) of the average response measured for the test groups.
Figure 2: Volunteer test setup
To demonstrate the performance and usage of the physical loading device, BioRID 50F, first a verification test was run using the same sled test arrangement as in the volunteer tests. Then a series of 4 sled tests with production car seats were conducted according to the Euro
7
NCAP protocol (delta V- 17 km/h). The tests were conducted with both the male and female versions of the BioRID II and the results were compared to identify differences between the dummy “genders”.
4 RESULTS
4.1 Average female anthropometry
The review and analysis of all the anthropometrical data lead to the final specifications for the EvaRID. Table 1 summarises the masses of the EvaRID components together with the corresponding values the BioRID II 50 percentile male. The segment lengths determined for EvaRID are presented with BioRID II data for reference. Details about the anthropometric data for the remaining body segments are described in Linder et al. (2011).
The mass data in Table 1 shows that all body segments except the pelvis are upper leg are less than 80% the mass of the corresponding segments in the BioRID II. The pelvis and upper legs are essentially the same mass in the EvaRID as in the BioRID II.
Table 1: The mass, mass distribution and Mass Ratio of the BioRID II and the EvaRID.
Body Part
EvaRID BioRID II MEvaRID
MBioRID Mass [kg] % of total Mass [kg] % of total Head x1 3.58 5.7 4.54 5.8 0.789 Upper Torso1) x1 19.58 31.4 26.61 34.0 0.736 Pelvis2) x1 15.84 25.4 15.80 20.2 1.003 Upper Arm x2 1.40 2.2 2.02 2.6 0.691 Lower Arm3) x2 1.16 1.9 2.23 2.9 0.518 Upper Leg4) x2 5.67 9.1 5.99 7.7 0.947 Lower Leg5) x2 3.43 5.5 5.44 7.0 0.631 TOTAL 62.32 100 78.24 100 -
1) The upper torso consists of the thorax, the abdomen, and the spine (including the neck).
2) Flaps included. 3) Hand included. 4) Flap excluded. 5) Foot included.
8
Table 2: Comparison of segment lengths for EvaRID and BioRID II.
Body Part Length Scale Factor
Segment EvaRID [cm] BioRID II [cm] Length LEvaRID LBioRID II Bredth BEvaRID BBioRID II Depth DEvaRID DBioRID II Head1) 20.308) 21.59 0.940 0.925 0.935 Neck2) 10.288) 12.04 0.854 0.910 0.854 Upper Torso3) 47.948) 52.65 0.911 0.910 0.888 Pelvis 25.828) 25.83 1.000 1.000 1.003 Upper Arm4) 26.408) 26.14 1.010 0.823 0.823 Lower Arm5) 23.408) 24.88 0.941 0.765 0.765 Upper Leg6) 38.908) 40.55 0.959 1.014 1.014 Lower Leg7) 45.708) 49.55 0.922 0.861 0.861
4.2 Virtual dummy model
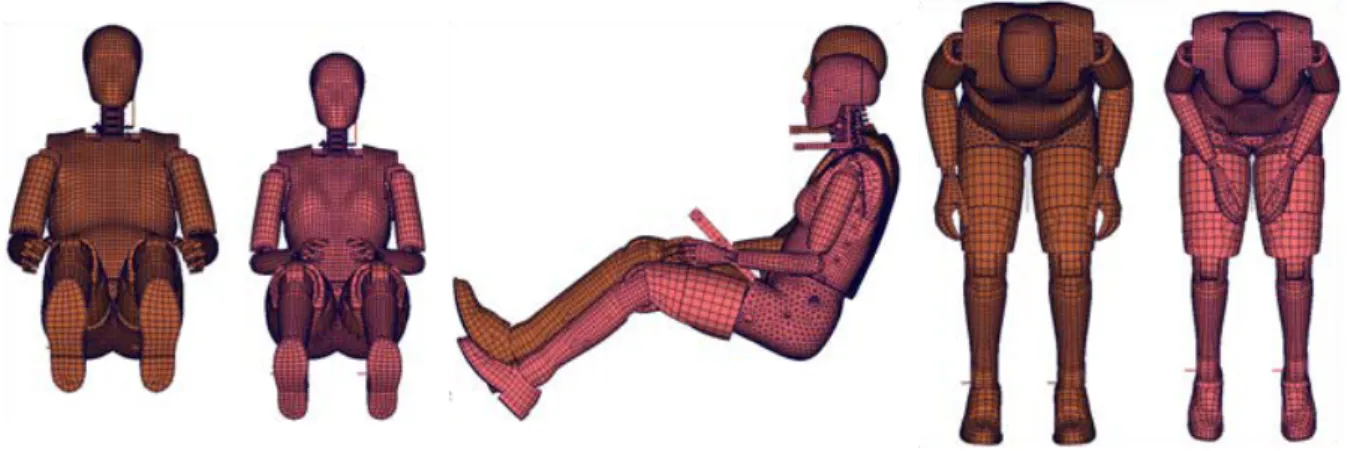
The Finite Element dummy Model, EvaRID, was based on the same design concept as the 50th percentile male rear impact dummy, BioRID II, and both are shown in Figure 3. The segment dimensions are a result of anthropometric data in Tables 1 and 2. The most important features to note are the shorter sitting height and the narrower thorax.
The spine EvaRID is a scaled BioRID II spine but spine curvature could not be updated due to a lack of data. Joint stiffness and damping in EvaRID were scaled by 70% from BioRID II. This was based on reported differences between females and males in static neck flexion and extension muscle strength (Foust et al. 1973). Affected parts included torsion pin stiffness, bumper stiffness, discrete damping elements as well as friction elements. Details about the scaling used are described in Linder et al. (2011).
The time step for FE models is an important parameter to keep simulation times as short as possible. LS-Dyna uses mass scaling to modify the mass of critical elements controlling the time step and this feature was examined in the model development. A target time step of 0.5 microseconds was achieved with only a 15 g increase in mass to some components in the torso.
The model statistics are given in Table 3. There are approximately 189000 elements, the majority of which solid elements. Ghost views of the model to indicate the general structures and configuration are shown in in Figure 4 with a 10 mm mesh background.
1) Top of head to chin. 2) C0/C7 joint to C7/T1 joint.
3) C7/T1 joint to mid-point of hip joints. 4) Shoulder joint to elbow joint. 5) Elbow joint to wrist joint. 6) Hip joint to knee joint.
7) Knee joint to bottom of heel along tibia. 8) Diffrient et al. (1974).
9
Table 3: Model statistics for EvaRID
Item Total
Number
Parts 405
Sections 25
Materials 52
Curves & Tables 102
Nodes 148229 Elements (Total) 189216 Accelerometer 7 Beam 4576 Discrete 2 Shell 72567 Solid 112064 Joints 20 Contact surfaces 6
10
Figure 4: Ghost Views of the EvaRID Model
4.3 Physical dummy model
The physical test device developed in ADSEAT was not intended to be a production test dummy, but as an instrument to provide test data for production car seats. EvaRID is only applicable in situations when detailed FE models of the seat were available. Thus a loading device based on BioRID II was used to document performance of existing seats. The loading device representing in mass and height an average female was named BioRID 50F (Schmitt et al. 2012), Figure 5.
Figure 5. BioRID 50F in volunteer test seat
The main modifications to the thorax required that the original thorax jacket was trimmed according to Figure 6. The grey areas indicate sections that were removed allowing the sitting height and breadth to be reduced.
11 Shoulder height 10thrib height 51mm 40mm 32mm 88mm
Figure 6: Cutting Pattern for Thorax Jacket for BioRID 50F
The segment mass distribution is shown in Table 4. The target masses for the segments in BioRID50F were close to the target values in EvaRID except for the torso and pelvis. Although both components differ, their combined mass in the BioRID50F is similar to that in EvaRID, 36.4 kg.
Table 4: The mass of each body part of the BioRID II, BioRID50F, and EvaRID
Dummy Segment BioRID II Mass BioRID50F Mass EvaRID Mass [kg] [kg] [kg] Head 4.44 3.32 3.58 Torso1) 27.16 22.43 19.58 Pelvis 11.67 12.03 15.84 Arm (upper) 2.02 1.46 1.40 Arm (lower) 2.26 1.25 1.16 Leg (upper) 6.86 5.72 5.67 Leg (lower) 5.80 3.83 3.43 Total 77.15 62.30 62.32 1) Including neck/spine
4.4 Proof of Concept
4.4.1 Virtual dummy model
Volunteer data was collected and analysed to produce various performance corridors to verify the EvaRID performance. Details of the volunteer studies and the data analysis are available in Carlsson et al (2011). Pre-simulation positioning of the dummy model was conducted and correlation to the initial position of the EvaRID model with a volunteer was ensured by checking each position. The simulations with the EvaRID were performed at 7 km/h. The results showed in Figures 7-9 compares simulated results with the EvaRID model with
12
response corridors and Volunteer #50, who most resemble the EvaRID dummy model in terms of mass and initial position.
The head and T1 x-accelerations were essentially close to the test results and close to, or within the test corridors (Figure 7). EvaRID has a more damped head acceleration response than the volunteer but the T1 acceleration had higher frequency components in EvaRID. Peak values are in agreement in both magnitude and timing.
Figure 7: Comparison of EvaRID acceleration response (red) with corridors constructed from all volunteer test data (orange) and Volunteer #50 (black)
The head and T1 x-displacements were close to the volunteer test results before the rebound at around 95 ms (Figure 8). Both head and T1 rearward excursions for EvaRID are close to Volunteer #50 but begin forward motions sooner, indicating stiffer response. This is most noticeable in T1 displacements. It is interesting to note that Volunteer #50 had a stiffer response that the other volunteers as indicated by the position of the black curve within the corridor. From the T1 rebound and the simulation animation; it was observed that EvaRID by design has a torso with much stiffer properties in extension then in flexion.
Figure 8: Comparison of EvaRID displacement response (red) with corridors constructed from all volunteer test data (orange) and Volunteer #50 (black)
The angular displacement of EvaRID’s head was within the corridor for the first 250 ms (Figure 9 - left). However, the angular displacement of T1 rotation response was essentially outside the corridor.(Figure 9 - right). This reveals that the EvaRID model torso has
13
considerably stiffer properties in extension than flexion. The properties of the Finite Element Model of the seat and seatbelt may also contribute to certain discrepancies.
Figure 9: Comparison of EvaRID angular displacement response (red) with corridors constructed from all volunteer test data (orange) and Volunteer #50 (black)
Sensitivity studies were performed to increase knowledge of the model´s response and optimise its performance. Initial studies focused on reducing the spinal stiffness by 30% to reflect differences in muscle tone between males and females. The torsion pin diameter, bumper stiffness and damper stiffness were reduced by 30% followed by a sequence of simulations investigating the influence of the flesh in the thorax/abdomen region. The BioRID dummy is designed such that the flesh contributes to the dummy response and practical experience gained with the hardware dummy has exposed that variations in flesh stiffness do in fact affect the neck results. Due to the EvaRID dummy model having been fitted with breasts, both the stiffness and mass in the upper torso region are affected. To study the influence of the above, the stiffness of the flesh was varied, the approach for modelling the breasts evaluated, and the interaction between flesh and spine in the upper torso region checked. This parameter, as well as friction between dummy and seat base/back, respectively was varied in the simulations.
It was found that none of the considered parameters resulted in a significant improvement of T1 rotation. Further detailed investigation into the BioRID and EvaRID model revealed that using numerical friction, as well as other numerical formulations to tune its response was necessary.
As a final check, the second volunteer data series were simulated. A better defined seat with a rigid base was incorporated and the head-to-headrest distance was increased in these tests. The seat was modelled in detail before positioning the EvaRID model on the seat, using pre-simulations in which only gravity acts on the model. Figure 10 displays the relevant data from simulations and tests. Head and T1 accelerations (upper left and lower left plots) and head and T1 angular displacements (upper right and lower right) are given for the 2 different occupant positions: position #1 (blue, 144 mm head-to-headrest distance) and position #2 (red, 158 mm head-to-headrest distance). Corridors from the volunteers are indicated by grey lines. Good correlation is obtained for most signals; and T1 rotation is improved over the initial results in Figure 10. The T1 angular displacements, however, are still below the corridor for the first 160 msec. The influence of dummy positioning on the seat was studied
14
by applying a variety of pre-simulations. Dummy positioning can have a pronounced effect and was observed in hardware tests. The simulation results shown in Figure 10 were obtained with a version of the EvaRID model in which numerical friction modelling was omitted, and stiffness of the spine reduced by 30% to represent differences in muscle tone compared to males.
Figure 10: Head and T1 accelerations and angular displacements for position #1 (blue, 144 mm head-headrest distance) and position #2 (red, 158 mm head-headrest distance). Volunteer Corridors indicated by grey lines.
4.4.2 Physical Dummy Model
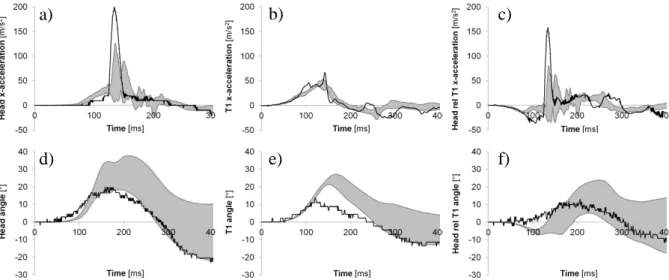
To evaluate the dynamic response of the BioRID 50F, one verification test was performed in the same test setup as the 50th percentile female volunteers. The overall response of the dummy performance in comparison to the volunteer corridors is presented in Figure 11. The BioRID 50F’s head remained in its initial position relative to the ground for a longer time which delayed the head x-acceleration onset compared to the volunteers. This led to an earlier and more powerful head-to-head restraint contact and a greater and somewhat earlier peak head acceleration for the BioRID 50F compared to the volunteers (Figure 11a). The T1 x-accelerations were similar for the volunteers and the BioRID 50F during the first ~85 ms. As the upper torso of the BioRID 50F was pushed forward by the seatback, the T1 x-acceleration started to increase, resulting in a minor, local, peak at 106 ms (Figure 11b). However, since the head lagged behind, the T1 x-acceleration decreased before it peaked again as the head reached the head restraint.
15
Figure 11 X-accelerations of (a) the head, (b) the T1 and (c) the head relative to T1;
angular displacements of (d) the head, (e) the T1 and (f) the head relative to T1; for the 50th percentile female volunteers (grey corridor) and the BioRID 50F (solid black line).
The head rearward angular displacement of the BioRID 50F was close to the corridor of the female volunteers (Figure 11d) however, the onset began somewhat early. The peak T1 rearward angular displacement was lower and earlier for the BioRID 50F compared to the female volunteers (Figure 11e). The volunteers exhibited a small flexion of the head relative to the T1 angular displacement during the first ~160 ms (negative values in Figure 11f) since the rearward angular displacement of T1 began earlier than that of the head. This small flexion was not found in the BioRID 50F due to the early onset of the head angular displacement. As the volunteers’ heads began to rotate rearward, the flexion of the head relative to T1 changed into extension (positive values in Figure 11f). The corresponding extension angle for the BioRID 50F was within the corridor of the female volunteers.
The BioRID50F was further evaluated by comparing its performance to BioRID II when tested in the same 4 production car seats. Seats A,B, and D were originally rated as good by Euro NCAP and seat C was rated as marginal. Figure 12 is a normalized plot of the dummy performance (BioRID II result is baseline) using some performance data reported earlier and the Euro NCAP criteria. The Nkm criterion was also modified to reflect female injury thresholds in the sense that the reference values used to calculate the criterion were reduced to 60% of the corresponding values for males. This modified criterionis reported as Nkm*.
The seats performing well for the BioRID II did perform as well with the female dummy in place. It is also noteworthy that the marginal seat, C, had some of the best results when tested with the BioRID50F. The main observation from the tests was the different interaction of the dummy and the seatback. In particular, the BioRID50F was narrow enough to fit between the main seatback frame. The different loading on the seatback caused noticeably different kinematics compared to the BioRID II test.
a) b) c)
16
Figure 12: Comparison of BioRID50F to BioRID II Response in 4 Production Car seats.
5 DISCUSSION
As a first step in the process of developing better test surrogates to represent the female portion of the population, a new Finite Element Model and a physical loading device were created. The EvaRID and BioRID 50F were created by scaling anthropometry, geometry, and mass properties based on the BioRID II dummy model. The weight distribution of the female surrogates are different the male based BioRID II. EvaRID and BioRID 50F both have a slightly lighter torso, a heavier pelvis and somewhat heavier upper legs. However, the joint stiffness and curvature of the spine, torso and neck were the same as that of the BioRID II.
During the evaluation it was observed that the EvaRID V1.0 model showed less angular motion of the torso/spine in extension in comparison to the subjects (Figure 9). Due to having inherited the design and properties of the BioRID II dummy model, only basic scaling adjustments of joint characteristics were made in the EvaRID model. Consequently, the T1 rotation is expected to be considerably less compared to the response of the real subjects during the extension motion. The rotation of the head relative to T1 suggests that further improvement to T1 (or spine) flexibility is important to correct the neck motion. The next step in the EvaRID model development process is tuning the spine stiffness and geometry. The importance of seatback offset was identified in the second volunteer tests but a lack of sine curvature data for females makes it difficult for further parameter studies of seatback/torso interaction until more data is available. It is possible that the construction of the BioRID II model does not contain the components needed to mimic the dynamic response of both males and females. Should that be the case, new design features should be taken into consideration.
The BioRID 50F showed promising results for a simple first step to a physical prototype. Given that the spine components could not be scaled as in the FE model, simple segment removal was used to “scale” the spine to the female sitting height. This mechanical construction also limits the joint stiffness and damping characteristics except for the muscle surrogate in the neck. Even with the limitations to the approach, the physical prototype performed well in verification tests using volunteer data.
Both the physical and virtual dummies have demonstrated overly stiff responses for the angular displacement of T1. It is not yet certain if the shortcomings can be corrected by modifying the joint stiffness characteristics, modification of spine curvature, or a combination of both is needed. Further development of EvaRID is needed to address this issue.
17
Preliminary testing with the BioRID50F demonstrated the sensitivity of safety evaluations to the reference conditions represented by the test device. Seats designed and preforming well for the male population are not necessarily providing protection for females. The assumption that the cumulative capture of the population in a percentile approach can also be considered as false. Although the 50 percentile male represents the 90-95 percentile of the female population, the BioRID 50F tests show how the 90 “female” – a BioRID II – did not capture the kinematics of the 50 percentile female. The accident studies on whiplash demonstrating the higher injury risk for females and lower efficiency of anti-whiplash systems (Kullgren and Krafft 2011) underline a need for a broader assessment of safety systems.
Once fully validated, a virtual dummy model of an average female could be utilised together with the existing model of the average male, in the design and evaluation of adaptive seat systems in order to provide enhanced neck injury protection for vehicle occupants for female as well as male vehicle occupants.
6
CONCLUSION
The ADSEAT project has established the anthropometric data of an average female needed to develop and evaluate different occupant surrogates for safety evaluations of seats and associated anti-whiplash systems. This information is needed to address the gender issues observed in whiplash injuries as documented in accident analyses. A Finite Element Model of an average female – EvaRID -and with physical loading device the size and weight of an average female – BioRID 50F – were developed and verified by demonstrating their performance using volunteer data collected and analysed by the ADSEAT consortium. Both surrogates are useful research resource but need further validation and development work to be considered a robust tool for automotive safety applications.
To evaluate how close the dummy model´s response was to that of a human, the EvaRID was compared to the corridors and response curves gained in volunteer tests comprising females. Further work on the joint stiffness properties was found to be needed for the model to achieve a response fully within the corridors in the volunteer tests.
First tests of the BioRID 50F were compared to the volunteer corridors and, similar to EvaRID, had responses close to the corridors, indicating further tuning was needed. The initial test results comparing the BioRID II and BioRID 50F showed that, in similar test conditions, the response for female occupant can be very different in terms of loading to the neck, than for male occupants when in tested in the same seat. Conditions favourable for a female may be penalized by a male dummy and vice versa.
7 ACKNOWLEDGEMENTS
This study is funded by the European Commission within the 7th Framework Programme. Additional funding has been received from the Swedish Transport Agency.
18
REFERENCES
Carlsson A, Siegmund GP, Linder A, Svensson M (2010) Motion of the Head and Neck of
Female and Male Volunteers in Rear Impact Car-to-Car Tests at 4 and 8 km/h, Proc.
IRCOBI Conf., Hanover (Germany), pp. 29–39.
Carlsson A, Linder A, Davidsson J, Hell W, Schick S, Svensson M (2011) Dynamic
Kinematic Responses of Female Volunteers in Rear Impacts and Comparison to Previous Male Volunteer Tests, Traffic Inj. Prev., Vol. 12, No. 4, pp. 347–357.
Chapline JF, Ferguson SA, Lillis RP, Lund AK, Williams AF (2000) Neck pain and head
restraint position relative to the driver's head in rear-end collisions, Accid. Anal. Prev.,
Vol 32, No. 2, pp. 287–297.
Croft AC, Haneline MT, Freeman MD (2002) Differential Occupant Kinematics and Forces
Between Frontal and Rear Automobile Impacts at Low Speed: Evidence for a Differential Injury Risk, Proc. IRCOBI Conf., Munich (Germany), pp. 365–366.
Diffrient N, Tilley AR, Bardagjy JC (1974) Humanscale 1/2/3 – A Portfolio of Information, The MIT Press, Cambridge, MA.
Dolinis J. (1997) Risk Factors for “Whiplash” in Drivers: A Cohort Study of Rear-End
Traffic Crashes, Injury, Vol. 28, No. 3, pp. 173–179.
Eichberger A, Geigl BC, Moser A, Fachbach B, Steffan H (1996) Comparison of Different
Car Seats Regarding Head-Neck Kinematics of Volunteers During Rear End Impact, Proc.
IRCOBI Conf., Dublin (Ireland), pp. 153–164.
Foust DR, Chaffin DB, Snyder RG, Baum JK (1973) Cervical Range of Motion and Dynamic
Response and Strength of Cervical Muscles, Proc. 17th Stapp Car Crash Conf., SAE
730975, pp. 285–308.
Hell W, Langwieder K, Walz F, Muser M, Kramer M, Hartwig E (1999) Consequences for
Seat Design due to Rear End Accident Analysis, Sled Tests and Possible Test Criteria for Reducing Cervical Spine Injuries after Rear-End Collision, Proc. IRCOBI Conf., Sitges
(Spain), pp. 243– 259.
Jakobsson L, Norin H, Svensson MY (2004) Parameters Influencing AIS 1 Neck Injury
Outcome in Frontal Impacts, Traffic Inj. Prev., Vol. 5, No. 2, pp. 156–163.
Kihlberg JK (1969) Flexion-Torsion Neck Injury in Rear Impacts, Proc. 13th AAAM, pp. 1– 16.
Krafft M, Kullgren A, Lie A, Tingvall C (2003) The Risk of Whiplash Injury in the Rear Seat
Compared to the Front Seat in Rear Impacts, Traffic Inj. Prev., Vol. 4, No. 2, pp. 136–140.
Kullgren A, Eriksson L, Boström O, Krafft M (2003) Validation of neck injury criteria using
reconstructed real-life rear-end crashes with recorded crash pulses, Proc. 18th ESV Conf.
(344), Nagoya (Japan), pp. 1–13.
Kullgren A, Krafft M, Lie A, Tingvall C (2007) The Effect of Whiplash Protection Systems in
Real-Life Crashes and Their Correlation to Consumer Crash Test Programmes, Proc. 20th
ESV Conf. (07-0468), Lyon (France), pp. 1–7.
Kullgren A, Krafft M (2010) Gender Analysis on Whiplash Seat Effectiveness: Results from
Real-World Crashes, Proc. IRCOBI Conf., Hanover (Germany), pp. 17–28.
Linder A, Svensson M, Carlsson A, Lemmen P, Chang F, Schmitt K-U, Kullgren A (2011) EvaRID - Anthropometric and biomechanical specification of a finite element dummy model of an average female for rear impact testing, Proc. ESV Conf. Washington, USA,, Paper Number 11-0374.
19
Linder A, Carlsson A, Svensson MY, Siegmund GP (2008) Dynamic Responses of Female
and Male Volunteers in Rear Impacts, Traffic Inj. Prev., Vol. 9, No. 6, pp. 592–599.
Maag U, Desjardins D, Bourbeau R, Laberge-Nadeau C (1990) Seat Belts and Neck Injuries, Proc. IRCOBI Conf., Bron (France), pp. 1–14.
Morris AP, Thomas PD (1996) Neck Injuries in the UK Co-operative Crash Injury Study, Proc. 40th Stapp Car Crash Conf., SAE 962433, pp. 317–329.
EuroNCAP (2012) Whiplash testing, http://www.euroncap.com/Content-Web-Page/c8d00e17-f3ed-4864-89c7-5a8af2798f03/whiplash.aspx, access 2012-11-20 O’Neill B, Haddon W, Kelley AB, Sorenson WW (1972) Automobile Head Restraints—
Frequency of Neck Injury Claims in Relation to the Presence of Head Restraints, Am. J.
Public Health, Vol. 62, No. 3, pp. 399–405.
Ono K, Ejima S, Suzuki Y, Kaneoka K, Fukushima M, Ujihashi S (2006) Prediction of Neck
Injury Risk Based on the Analysis of Localized Cervical Vertebral Motion of Human Volunteers During Low-Speed Rear Impacts, Proc. IRCOBI Conf., Madrid (Spain), pp.
103–113.
Otremski I, Marsh JL, Wilde BR, McLardy Smith PD, Newman RJ (1989) Soft Tissue
Cervical Injuries in Motor Vehicle Accidents, Injury, Vol. 20, No. 6, pp. 349–351.
Pheasant S, Haslegrave C (2006) Bodyspace: Anthropometry, Ergonomics, and the Design of
Work, Taylor & Francis, 3rd ed., ISBN 0-415-28520-8.
Richter M, Otte D, Pohlemann T, Krettek C, Blauth M (2000) Whiplash-Type Neck Distortion
in Restrained Car Drivers: Frequency, Causes and Long-Term Results, Eur. Spine J., Vol.
9, No. 2, pp. 109–117.
Schick S, Horion S, Thorsteinsdottir K, Hell W (2008) Differences and Commons in Kinetic
Parameters of Male and Female Volunteers in Low Speed Rear End Impacts, TÜV SÜD,
Whiplash – Neck Pain in Car Crashes, 2nd Intern. Conf., Erding (Germany).
Schmitt KU, Weber T, Svensson M, Davidsson J, Carlsson A, Björklund M, Jakobsson L, Tomasch E, Linder A (2012) Seat testing to investigate the female neck injury risk –
preliminary results using a new female dummy prototype, Proc. IRCOBI Conf., Dublin
(Ireland), paper-no. IRC-12-33, pp. 263.
Schneider LW, Robbins DH, Pflüg MA and Snyder RG. (1983) Anthropometry of Motor
Vehicle Occupants, Final Report, UMTRI-83-53-1, University of Michigan Transportation
Research Institute.
Siegmund GP, King DJ, Lawrence JM, Wheeler JB, Brault JR, Smith TA (1997) Head/Neck
Kinematic Response of Human Subjects in Low-Speed Rear-End Collisions, Proc. 41st
Stapp Car Crash Conf., SAE 973341, pp. 357–385.
Storvik SG, Stemper BD, Yoganandan N, Pintar FA (2009) Population-Based Estimates of
Whiplash Injury Using NASS CDS Data, Biomed Sci Instrum., No. 45, pp. 244–249.
Svensson MY, Lövsund P, Håland Y, Larsson S (1993) Rear-End Collisions—A Study of the
Influence of Backrest Properties on Head-Neck Motion Using a New Dummy Neck, SAE
930343, pp. 129– 142.
Szabo TJ, Welcher JB, Anderson RD, Rice MM, Ward JA, Paulo LR, Carpenter NJ (1994)
Human Occupant Kinematic Response to Low-Speed Rear End Impacts, Proc. 38th Stapp
Car Crash Conf., SAE 940532, pp. 23–35.
Temming J, Zobel R (1998) Frequency and Risk of Cervical Spine Distortion Injuries in
Passenger Car Accidents: Significance of Human Factors Data, Proc. IRCOBI Conf.,
20
Thomas C, Faverjon G, Hartemann F, Tarriere C, Patel A, Got C (1982) Protection against
Rear-End Accidents, Proc. IRCOBI Conf., Cologne (Germany), pp. 17–29.
Viano D (2003) Seat Influences on Female Neck Responses in Rear Crashes: A Reason Why
Women Have Higher Whiplash Rates, Traffic Inj. Prev., Vol. 4, No. 3, pp. 228–239.
Welcher JB, Szabo TJ (2001) Relationships Between Seat Properties and Human Subject
Kinematics in Rear Impact Tests, Accid. Anal. Prev., Vol 33, No. 3, pp. 289–304.
Welsh R, Lenard J (2001) Male and Female Car Drivers – Differences in Collision and Injury
Risks, Proc. 45th AAAM, Texas (USA), pp. 73–91.
Young JW, Chandler RF, Snow CC, Robinette KM, Zehner GF, Lofberg MS (1983)
Anthropometric and Mass Distribution Characteristics of Adult Female Body Segments,