d o i: 10.1075/idj.16.3.03por
Thomas Porathe
Measuring effective map design for route guidance
An experiment comparing electronic map display principles
Keywords: navigation, wayfinding, route guidance, 3-D maps
Route guidance systems in vehicles has started to use an oblique, slanted view of the map, mimicking something of the egocentric perspective the driver sees through the windscreen. Is this an effective strategy? What is the most effective map design to convey route guidance to drivers, and how can this be measured? In an experiment with four different modes of map displays the speed of decision making and accuracy of navigation have been tested. The four map types were: the traditional paper map, the north-up electronic map with position plotting (the symbol of the vehicle moving in the static map), the head-up electronic map (map moving, the position of the vehicle static and facing up) and the egocentric view map display, a 3-D scenery mimicking the world outside the wind screen. The experiment showed clearly that the egocentric 3-D view was the most effective.
1. Introduction
1.1 Wayfinding
Wayfinding is a fundamental human activity. We are constantly involved in wayfinding activities as we move around in our everyday life. In well known environments
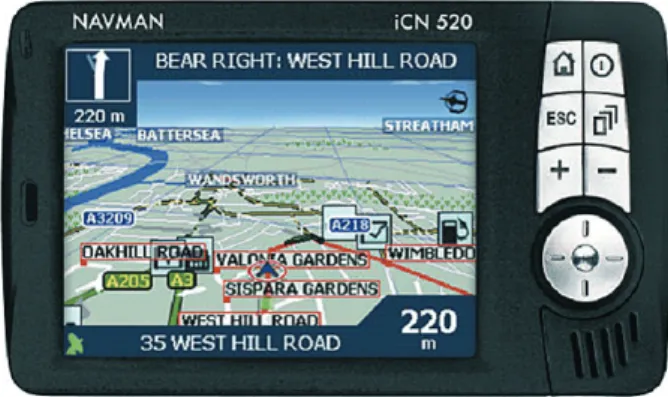
this is mostly done unconsciously but in unknown or large environments we use different kinds of wayfinding aids. For instance, in resent years wayfinding applications in cars has become popular. On a small screen in front of the driver, a map is shown. The map shows a portion of the vicinity of the car and a symbol moving in the map represents the position and orientation of the car; all made possible by precise GPS positioning. The map can often be displayed in different modes and most recently a slanted “3-D view” has begun to appear (see Figure 1). What is the rationale behind this view and how effective is it compared to other modes of map display?
Figure 1. An example of a commercial wayfinding
application for use in cars. The slanted “3-D view” (Curtsey of Navman Europe Ltd., 2007)
In this paper I will make a brief review of some historical wayfinding applications and report on a recent experi-ment where the effectiveness and user friendliness of different modes of map displays are compared.
1.2 Cognitive maps
As soon as the space we move around in becomes larger than what we can overlook from a single location, we need some kind of wayfinding aid. These aids can be inner, mental constructs, or outer cognitive artifacts. In a well known surrounding such as in our apart-ment or on our way to our work we use our spatial memory, what Tolman (1948) called cognitive maps. Cognitive maps are an inner, mental representation of space. The knowledge needed to build the cognitive map can be acquired in different ways: for instance by look-ing at an ordinary map or by overlooklook-ing an area from a high building. But it can also be constructed stepwise by moving around in the area. The knowledge is then acquired in a series of higher levels of understanding described by Siegel and White (1975) as landmark
knowl-edge, route knowledge and survey knowledge. Landmark
knowledge is when you use the visual appearance of places to orient your self, e.g. the railway station, the church or the river. Rout knowledge is the next level of understanding when you can connect your landmarks into a route, e.g. “turn left at the railway station and go past the church until you reach the river.” Finally, survey knowledge is the highest form of spatial knowledge. It is when you have a spatial understanding of how land-marks and routs are connected which makes it possible for you to make inferences such as calculating shortcuts and distances along routs which you never have used before. Survey knowledge can be compared to the mental structure Tolman called cognitive maps. However, cognitive maps does not have to be correct; they can also be based on misunderstandings. All people have errors
in their cognitive maps. Often these errors are so large that Barbara Tversky (1993) suggested that they instead should be termed cognitive collages. They can still work as wayfinding aids, but may sometimes lead us astray, or make us misjudge distances or directions. These cogni-tive maps are part of our long term memory and suffer from the same well known limitations as other features of memory.
But even if the cognitive map is correct, we may get lost if we do now know our position and orientation in the cognitive map. It can happen in your apartment, in a dense forest, or at sea in fog or darkness. You can stumble over a chair in your dark apartment because someone moved it, i.e. you cognitive map was wrong, but you can also stumble because you were not moving in exactly the direction you thought. In 1999 the Norwegian high speed ferry Sleipner ran aground along her regular route and several people were killed. The officers knew the route very well, having traveled there daily for several years. But it was a dark night and for some moments they were not paying attention to the flashing beacon on the coast in front of them which was their steering mark. During this time the ship slowly turned and when they started to look for the beacon again it was gone and they could not locate it for several seconds. When they finally saw it they realized that they were 45 degrees off course. For a few seconds they had lost their orientation. Not because their cognitive map was wrong, but because their position and orientation in the map was. So a good map is not enough to ensure safe navigation, you have to know where in the map you are. And to do this you need some means of positioning. Visually this can be done by cross bearings and leading lines: by looking around us we unconsciously triangulate landmarks into a more or less accurate position. We can also do this in more precise way using instruments. Another mean is dead reckoning; this is when you use knowledge of your speed and direction to extrapolate your position based on a
recent one. Electronically positioning is now days done in a very accurate way by triangulating distances to satel-lites, e.g. the GPS system.
When the space you travel through is unknown or becomes larger than what can be stored in the cognitive map, we need artifacts to aid us. Th roughout history we fi nd two fundamentally diff erent types of wayfi nding artifacts that use two diff erent kinds of perspectives and based on the spatial understanding of route knowledge and survey knowledge: the wayfi nding direction and the
map.
1.3 Wayfi nding directions
Th e earliest forms of wayfi nding artifacts we know are from the ancient Greek and Roman periods: the sailing
directions for sea travel and the itineraries for land travel.
From the fi ft h century BC we have remains of a Greek sailing direction (periplus) by Scylax of Caryanda. Th ese sailing directions consist only of lists of places and distances (measured in stadia. One stadium is 178 m). Th e following translated fragment is typical:
Libya begins beyond the Canopic mouth of Nile… Th e fi rst people of Libya are the Adyrmachidae. From Th onis the voyage to Pharos, a desert island (good har-bourage but no drinking water) is 150 stadia. In Pharos are many harbours. But ships water at the Marian Mere, for it is drinkable. It is a short sail from Pharos to the mere. Here is also Chersonesus and harbour: the coast-ing thither is 20 stadia. Beyond Chersonesus is the bay of Plinthine. Th e mouth of the bay to Leuce Acte (white beach) is a day and a night’s sail… (Cotter 1971, p.250)
In an even more cruder form we fi nd the same general idea for wayfi nding on land some 600-700 years later in the Roman itineraries. In the Antonine Itinerary over the British province we can read:
Durocobrivis xii Verolamo xii Londinio xxi
for the route between Dunstable, St. Albans and London (Rivet & Jackson, 1970). Th e itineraries of the Roman empire consisted of just names of places and the distance between them measured in thousands of passus (one Roman pace was a double step, about 1.48 meters). But they were a suffi cient aid for wayfi nding for the armies as the marched along the Roman roads.
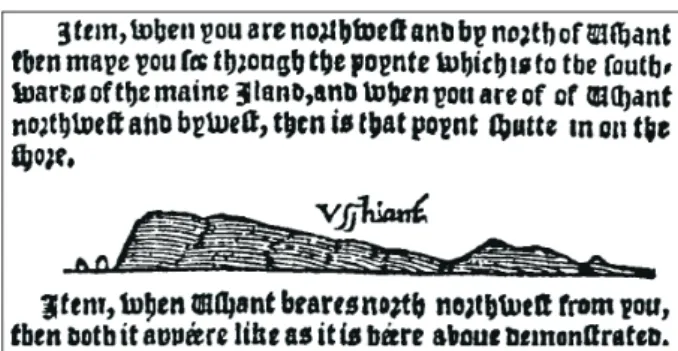
In the 16th century the French pilot Pierre Garcia started to incorporate simple wood cuts into sailing directions that he published. Th ese pictures or coastal
views added valuable information of the visual
appear-ance of landmarks that otherwise would have been diffi cult to describe (see Figure 2).
Th e concept of the wayfi nding direction is simple: Th ey describe the world from the subjective perspective of our eye as we move through it – or rather, as the world moves towards our fi eld of vision. We call this perspec-tive egocentric, as it is based on our subjecperspec-tive experi-ence and the sailing directions and itineraries describe it with words or with both words and pictures in much
Figure 2. A coastal view of Île d’Ouessant at the western tip of Bretagne in France (“Ushant” in English). A woodcut from Robert Norman’s 1590 Safegarde of Saylers (Taylor, 1956).
the same way as the map reader in a rally car or a high speed combat boat today will read a list of wayfinding instructions to the driver These descriptions can then be directly translated back to the real world for wayfinding. However, one constraint is important; the wayfinding instruction is only valid for a certain route and a certain direction, the route could be a road or a coastline and this of course constitutes a drawback as travel becomes complex and people wanted to go by other routes. A need for a more comprehensive wayfinding artifact becomes apparent and this problem is solved by compil-ing many routs into what we know as a map. The level of survey knowledge is reached.
1.4 Maps
The map is maybe the most well known of all wayfinding artifacts. The map is an iconic representation of the land-scape depicted from a bird’s eye view but in a synthetic, orthographic projection, meaning that every point on the map is depicted from a position directly above. Apart from occasional visits to mountain tops this was not the natural perspective of man until she started to use hot air balloons in the 18th century. But somehow we seem to have cognitive structures to relatively easy understand this type of ex-corporal representations. Already in the 2nd century the Roman writer Lucian states that the perspective of looking down from on high was common among geographers (Whittaker, 2004).
The first known examples of maps are clay tablets from the Mesopotamian civilization around the 14th-13th century BC. These maps were however not wayfinding devises but probably more of cadastral maps drawn to document property rights.
The use the map is somewhat indirect, actually not at all intuitive and has to be learned. When we look at a map, we imagine ourselves hovering in the air, observ-ing ourselves as objects movobserv-ing over the surface of the
map. We call this perspective exocentric, as we observe ourselves from the outside.
A problem was that to be able to draw a map of an area a lot of information had to be acquired. Distances and directions had to be triangulated into a coherent understanding of space. This is a much larger under-taking than might be evident at first. Hutchins (1995, p. 111) writes that “a navigation chart represents the accumulation of more observations that any one person could make in a lifetime. It is an artifact that embodies generations of experience and measurements”. I spite of this, Greek cartographers like Eratosthenes and Ptolemy managed to construct surprisingly accurate maps of the known world in the centuries around the birth of Christ. However, not even these maps were intended as wayfind-ing aids. In maritime navigation the sailwayfind-ing direction was the standard onboard wayfinding artifact well into the 18th century. The first preserved nautical chart (the Carta Pizana) appeared already in the end of the 13th century, but the costly, often colored and gold plated portolan charts were never intended for the harsh and damp environment of a ships deck. It was first with the Merca-tor projection and the Dutch map makers in the 16th century that the exocentric perspective started to concur out the egocentric in nautical navigation.
1.5 Two kinds of spatial understanding
In the wayfinding directions and in the maps we find two different kinds of spatial understandings. The egocentric view is the natural view of man and has many intui-tive properties connected to it. The exocentric view is a synthetic view that has to be learned. It involves several difficulties as we have to transform the view from exocentric to egocentric to be able to act on it. We do that using what is called mental rotations (Shepard & Metzler, 1971). For instance, when we are facing south and look at a map oriented with north up (which is the
most common orientation maps are printed in since the days of Ptolemy) we have to make two mental rotations to construct the exocentric view needed to compare the map and the outside world (see Figure 3).
Shepard & Metzler concluded in their well known experiment that there was a linear relationship between time and the size of the angle an object had to be mental-ly rotated. That is: a mental rotation is not instantaneous, meaning that in an environment where time is in short supply (like in high speeds) and the angle of a mental rotation is large (like when going south using a north-up map) we may be facing a problem. Can this problem be overcome by using the more direct method of egocentric route guidance?
There are no remaining maps from the Roman Empire. In fact the British historian Whittaker (2004) suggests that the ancient Romans did not use maps at all. Their understanding of geographical space was instead
based entirely on what he calls hodological space, after the Greek word ‘hodos’ meaning road, as adapted by the Italian historian Pietro Janni (1984). Janni explains that the Roman had a one-dimensional understanding of space where two itineraries with routes from A to B and from A to C gave no understanding of the relationships between B and C. Much the same as using a modern day schematic underground map would be a successful way finder for overground travel. How is it possible for an empire to be so successful conquerors as the Romans without maps? Maybe it was because the egocentric wayfinding perspective can be just as effective as the egocentric in certain situations? To bring some clarity on this I conducted an experiment, earlier presented in a PhD dissertation concluding an information design proj-ect for nautical charts (Porathe, 2006). As I think there is a more general lesson to learn from these findings I will here shortly present them again in more generic terms.
Figure 3. Mental rotations: the navigator experiences the real world through the egocentric view he sees with his eyes. Maps present the world in an exocentric view, where the navigator has to imagine himself as an object seen from a bird’s eye perspective. In order to align the exocentric map with the world the navigator has to perform a series of mental rotations. (Picture by the author.)
2. Method
2.1 Objective
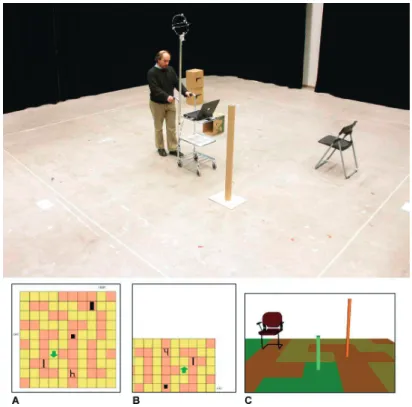
My objective was to test the effectiveness of three differ-ent modes of electronic map displays. Two traditionally used in car and ship navigation systems: the exocentric north-up and head-up modes and the new egocentric view (3-D mode). As a comparison a traditional hand held paper map was tested. The test was conducted in a small studio maze (see Figure 4).
The north-up map is shown as map A, bottom left in Figure 4, the way it was presented on the laptop of the cart in the situation depicted in the photo, top. The map was fixed and the position of the cart was presented as a small green arrow that moved and rotated on the map.
The head-up map is shown in B, bottom middle in Figure 4. It shows the same situation as depicted in the photo and in maps A and C. Here the green position arrow was fixed in the centre lower half of the screen and the map moved and rotated as the cart moved.
The new egocentric 3-D view is shown in C, bottom right in Figure 4. A green rod fixed in the middle of the screen represented the position of the cart and the 3-D map moved and turned much as the VR landscape in a computer game. The screen dump in C represents also the position of the cart in the photo.
The paper map was similar to map A, bottom left in Figure 4, but without the position arrow. It was printed on an A4 paper and subjects held the paper map in their hand and were allowed to rotate it or keep it north-up as they wished. They still had to drive the cart through
Figure 4. Top, the studio maze, a 6 m by 6 m area with four landmarks and a subject driving the cart. Bottom left (A) the 2-D map in the north-up mode as it was shown on the screen of the lap top computer on the cart for the very position shown in the top photo. The middle (B) map is the exocentric map in head-up mode and right (C) is the egocentric 3-D view.
the track using the other hand as the application logged their results. (This was really easy as the cart was light and easy to maneuver.) During this test the laptop screen was black.
2.2 Experimental setting
A 6 by 6 m square was marked on the floor in a studio. The square was divided into an invisible 10 by 10 grid squares. Each square measured 0.6 by 0.6 m.
Four different maze designs were made in the same grid. Each maze consisted of an allowed track and forbidden areas where a “grounding” was recorded if the vehicle entered. The allowed track had a light color on the maps but was not in any way marked on the studio floor. The NoGo areas had a darker color; they were not marked on the studio floor either.
It was possible to drive trough each maze using the track. There was only one track so no decision making had to be made as far as which way to go. The subjects only had to translate the map to the real world. Each track through the four different mazes had the same length and the same amount of turns.
For each maze one conventional exocentric 2-D map and one 3-D model was constructed. Four landmarks – two piles of cardboard boxes, a paper tube and a chair – were placed on the studio floor in the maze and marked on the maps to serve as reference points.
As a vehicle a small four wheeled cart covering a ground plane of 0.45 m by 0.38 m was used. All four wheels could rotate, making the cart easy to maneu-ver. The cart had a shelf where a lap top computer was fitted. The computer ran on batteries so no cords had to be attached to the cart during the experiment. The computer was fitted with a custom made real-time 3-D software application that was used to show both the 3-D egocentric and the exocentric 2-D north-up and head-up maps. The application was also used to monitor and log
the time it took to complete the track and the number of “groundings” made by the subjects.
The subjects always used the four different tracks from 1 to 4 in that order, but the map type used for each track was randomized.
A Qualisys Medical infrared tracking system was used to detect the position and orientation of the cart and send x, y and heading back to the lap top by wireless LAN as to mimic a GPS system. The uncertainty of the system setup was less than 2 cm. The update frequency of the tacking system was 50 Hz.
Forty-five subjects were randomly selected from a population of available students, teachers and personal at the university. 24 were male and 21 female. They had different navigational experiences. Some had very little or ordinary experience, some were active orienteer or amateur sailors; one was a schooled naval corvette navi-gator enlisted in the Swedish navy.
The subjects were first guided through a practice session on a special trial track. When the subjects agreed on having understood the process the experi-ment started. Each subject drove the cart though all four tracks. The order in which the different maps were used was randomized. The instruction to the subjects was to drive the cart though the mazes as fast as possible with as few “groundings” as possible.
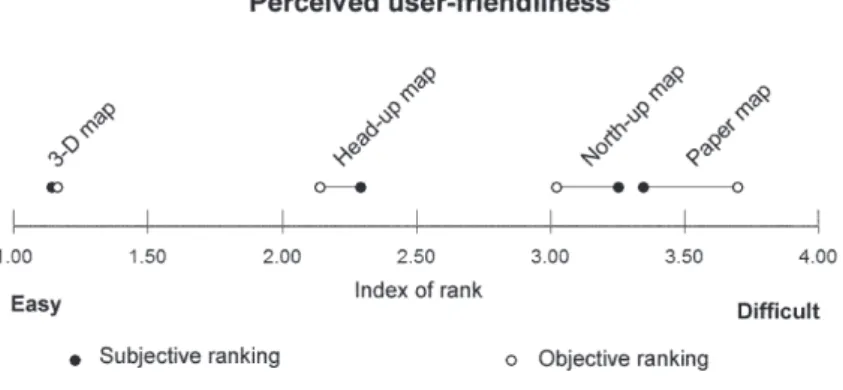
After the four sessions a short interview took place. The subjects were asked about their previous navigation experience and they were asked to fill in a ranking form where they ranked the four map types after perceived user-friendliness. They also took a psychological figure rotations test, to try to establish some sort of objective measure of their spatial abilities.
3. Results
3.1 Main results
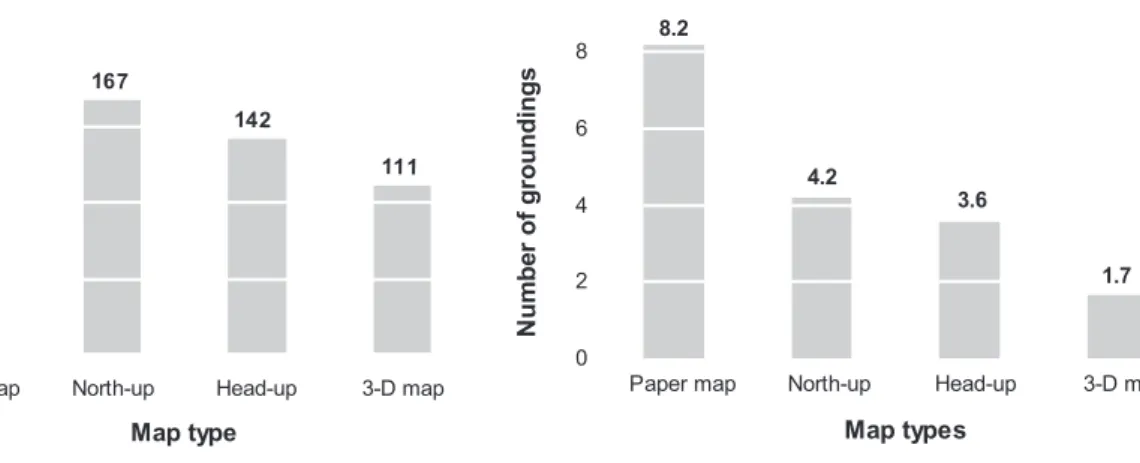
The results showed that the use of the egocentric 3-D view gave the fastest times through the mazes with a mean time-on-track for all 45 participants of 111 s, the head-up map came second with a mean of 142 s, then the north-up map with 167 s and the paper map with Hårt mellanslag (see Figure 5). In this test, decision making using the north-up map was 1.4 times faster than using a traditional paper map, the head-up map 1.6 times faster and the egocentric 3-D view 2.1 times faster than using the paper map. When observing the experiment, it was evident that it was the decision making process – hesitat-ing in front of a turn, decidhesitat-ing which direction to turn – that was the major cause of time difference.
The number of “groundings” gave the same results: using the 3-D view resulted in the fewest number of groundings with a mean of 1.7 groundings for the whole
group; the head-up map 3.6, north-up 4.2 and the paper map 8.2 (see Figure 6). So navigation using a north-up map resulted in 0.5 times the number of groundings as compared to the traditional paper map, using the head-up map 0.4 times as many and using the 3-D map 0.2 times as many groundings as using the paper map. The difference in time on track between the map types was statistically significant at the 1% level.
(F(3,132,0.01) = 46.6, p < 0.01). The same was true for the number of “groundings”: the influence of the map type on the number of groundings was statistically significant at the 1 % level (F(3,129,0.01) = 3.94, p < 0.01).
After the test the subjects were asked to rank the perceived user-friendliness of the different map types on a scale from 1 – 4, where “1” was the easiest and “4” the most difficult map to use. The 3-D map was classified as the easiest with a mean index of 1.1 followed by the head-up map with a mean index of 2.3. North-head-up had 3.2 and the paper map 3.3. (These are the black dots in Figure 7.) Interesting to note is that the paper and the north-up Time-on-track (Mean for all subjects)
167 142 111 230 0 50 100 150 200 250
Paper map North-up Head-up 3-D map
Map type Ti m e on tr ac k (s )
Figure 5. The mean time (y-axes) for all subjects on the track split up on the four different map types (x-axis)
Number-of-groundings (Mean for all subjects)
4.2 8.2 1.7 3.6 0 2 4 6 8
Paper map North-up Head-up 3-D map
Map types N um be r o f g ro un di ng s
Figure 6. The mean number of errors (y-axes) for all subjects on the track split up on the four different map types (x-axis)
maps were considered almost equally difficult to use while indexing the results for time-on-track in a similar manner (white dots), showed clearly better results with than the north-up map than with the paper map.
3.2 Influence of experience
The subjects map experiences were classified into three groups: “large” (e.g. the subject had been competing in orientation, had long experience of navigating leisure boats), “average” or “little.” The group with “large experi-ence consisted of 12 subjects, the “average” group of 23 and the “little” group of 9. The mean values of time-on-track for each group are shown in Figure 8. These results were however not significant due to the small sizes of the groups.
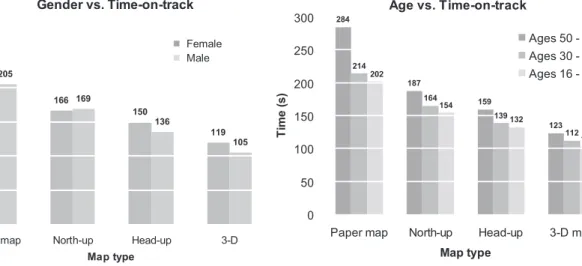
3.3 Influence of gender
Splitting the test results for the 21 female and the 24 male subjects and looking at the mean value for time-on-track we see a small difference in the results favoring male navigation in the maze. The difference reached almost Figure 7. Subjective ranking of user-friendliness. See the text for an explanation
Map experience vs. Time-on-track
314 178 163 136 232 186 152 114 166 121 107 89 0 50 100 150 200 250 300 350
Paper map North-up Head-up 3-D map
Map typ Ti m e (s ) No map experience Average map experience Large map experience
Figure 8. Time-on-track split for three groups of experience in navigation. Dark, staples ”no” experience, mid gray staples “average” experience and light gray ”large” map experience
significance on the 5 % level for the paper map test for time-on-track (p = 0.051) and number-of-groundings (p = 0.054). For the 3-D map the gender difference was not significant, p = 0.119 for time-on-track and p = 162 for number-of-groundings. See Figure 9.
3.4 Influence of age
A division into age groups was made to see if there was any difference in the results of navigation between people of different ages. Three groups were formed: age 16-29 (19 persons), age 30-49 (14 persons) and age 50-63 (11 persons). As far as navigating with the paper map there is a significant difference on the 5 % level between the age groups 16–29 and 50–63 for number-of-ground-ings (p = 0.031) and very close to significance for time-on-track (p = 0.053). See Figure 10.
Gender vs. Time-on-track 259 166 150 119 205 169 136 105 0 50 100 150 200 250 300
Paper map North-up Head-up 3-D
Map type Ti m e (s ) Female Male
Figure 9. Time-on-track split for male and female subjects. The dark gray staples are the female subjects and the light gray staples the male subjects
Age vs. Time-on-track 284 187 159 123 214 164 139 112 202 154 132 103 0 50 100 150 200 250 300
Paper map North-up Head-up 3-D map Map type Ti m e (s ) Ages 50 - 63 Ages 30 - 49 Ages 16 - 29
Figure 10. Time-on-track split for subjects divided on three age groups
Figure 11. Time-on-track for subjects split on three groups of different spatial ability according to results on the figure rotation test.
Spatial test score vs. Time-on-track 341 199 166 132 222 168 146 115 186 151 127 99 0 50 100 150 200 250 300 350 400
Paper map North-up Head-up 3-D map
Map types Ti m e (s ) Stanine 3 - 5 Stanine 6 - 7 Stanine 8 - 9
3.5 Influence based on spatial test score
All subjects were tested on the figure rotation test generally a part of a battery of tests used to judge spatial abilities. The results of the test were normalized into a so called stanine value 1-9, where 5 is the mean value for the normalization group. The mean value for this test group was 6.9. The test score for time-on-track was divided into three groups of stanine values 3-5, 6-7 and 8-9. The results for time-on-track are shown in Figure 11.
4. Conclusion
The results of the wayfinding experiment showed clearly that, at least in the laboratory maze, the egocentric 3-D view was more efficient than traditional exocentric map views in head-up or north-up mode, or a paper map. There was also a clear preference for the egocentric 3 D view to the traditional exocentric maps amongst the test subjects.
Looking at the test results by splitting them into groups of different ages, gender, experience and spatial ability gave non-significant results, but taken for valid they support results presented in e.g. Halpen (2000), that spatial ability generally decreases with age and favors males.
The results suggests that experience has an influence but also that map mode influence both experienced and inexperienced the same.
The results also suggest that spatial ability, as
measured by the figure rotation test, has something to do with the navigational skill. This adds to the validity of the experiment.
The tendency was the same for the number-of-groundings. These results are omitted in the Figures here for lack of space but can be found in Porathe (2006). This experiment was originally aimed at nautical navigation but results may be equally important for
navi-gation in general, for example in cars.
An interesting finding was that the ancient egocentric point of view used in the Greek sailing direction and in the Roman itineraries, boosted with modern GPS posi-tioning showed to be more efficient in route guidance, that the prevailing exocentric paradigm.
References
Cotter, C. (1971). A Brief History of Sailing Directions. Journal of
Navigation, 36, 249–261.
Halpen, D. F. (2000). Sex Differences in Cognitive Abilities, Mahwah, NJ: Erlbaum.
Hutchins, E. (1995). Cognition in the wild. Cambridge: MIT Press. Janni, P. (1984). La mappa e il periplo: cartografia antica e spazio
odologico. Rome.
Navman Europe Ltd. (2007). http://www.navman.com Porathe, T. (2006). 3-D Nautical Charts and Safe Navigation,
Dis-sertation no. 27, Malardalen University Press. Available at http://www.diva-portal.org/index.xsql?lang=en Search for author “Porathe.”
Rivet, A. L. F. & Jackson, K. (1970). The British Section of the An-tonine Itinerary, Britannia, Vol. 1. 1970, pp. 34-82. http://links. jstor.org/sici?sici=0068-113X%281970%291%3C34%3ATBSOTA %3E2.0.CO%3B2-9
Shepard, R. N., & Metzler, J. (1971). Mental rotation of three-dimensional objects. Science, 171, 701–703.
Siegel, A. W., & White, S. H. (1975). The development of spatial representations of large scale environments. In H. W. Reese (Ed.), Advances in child development and behavior, (10, pp. 10–55). New York: Academic Press.
Taylor, E. G. R. (1956). The Haven-Finding Art. London: The Institute of Navigation, Hollins & Carter.
Tolman, E. C. (1948). Cognitive Maps in Rats and Men.
Psychologi-cal Review, 55, 189–208.
Tversky, B. (1993). Cognitive maps, cognitive collages and spatial mental models. In A. U. Frank & I. Campari. (Eds.), Spatial
information theory, a theoretical bases for GIS. Proceedings of
COSIT’93. Berlin: Springer.
Whittaker, C. R. (2004). Rome and its Frontieres: The Dynamics of
About the author
Thomas Porathe is assistant professor in Information Design at
Mälardalen University in Eskilstuna, Sweden. He also manages the university’s User Experience Lab. He has done research on the usability of maps and on map design for seven years and received his Ph.D. in 2006. He also works part time with Mari-time Human Factors at the Department of Shipping and Marine Technology at Chalmers University of Technology in Göteborg, Sweden.
Contact
Dr. Thomas Porathe School of Innovation Design and Engineering Mälardalen University Box 325
SE-63105 Eskilstuna Sweden