Procedural priming of a numerical cognitive illusion
Kimmo Eriksson
∗ †Fredrik Jansson
‡†Abstract
A strategy activated in one task may be transferred to subsequent tasks and prevent activation of other strategies that would otherwise come to mind, a mechanism referred to as procedural priming. In a novel application of procedural priming we show that it can make or break cognitive illusions. Our test case is the 1/k illusion, which is based on the same unwarranted mathematical shortcut as the MPG illusion and the time-saving bias. The task is to estimate distances between values of frac-tions on the form 1/k. Most people given this task intuitively base their estimates on the distances between the denominators (i.e., the reciprocals of the fractions), which may yield very poor estimations of the true distances between the fractions. As expected, the tendency to fall for this illusion is related to cognitive style (Study 1). In order to apply procedural priming we constructed versions of the task in which the illusion is weak, in the sense that most people do not fall for it anymore. We then gave participants both “strong illusion” and “weak illusion” versions of the task (Studies 2 and 3). Participants who first did the task in the weak illusion version would often persist with the correct strategy even in the strong illusion version, thus breaking the otherwise strong illusion in the latter task. Conversely, participants who took the strong illusion version first would then often fall for the illusion even in the weak illusion version, thus strengthening the otherwise weak illusion in the latter task.
Keywords: fractions, procedural priming, cognitive illusion, Einstellung, estimation.
1
Introduction
Cognitive illusions are false beliefs intuitively accepted as true. A number of cognitive illusions have been studied by researchers of judgment and decision making (see Kahne-man, 2011). One direction of research on cognitive illusions is what might weaken the illusion. For instance, cognitive il-lusions on some tasks dealing with probabilities become less prevalent when the tasks are phrased in terms of frequencies instead of probabilities (Kahneman & Tversky, 1996). The aim of the present paper is twofold. First, we will argue that an estimation bias that was found by researchers in the de-velopment of numerical cognition (Opfer & De Vries, 2008) should be regarded as a cognitive illusion. Second, we aim to examine the power of procedural priming to weaken, or strengthen, this cognitive illusion.
Procedural priming refers to the carry-over effect that
per-We are grateful to Jonathan Baron for pointing out that the 1/k illusion is related to the MPG illusion and the time-saving bias. This research was funded by the Swedish Research Council [grant number 2009-2390], the Knut and Alice Wallenberg Foundation [grant number 2015.0005], and the European Research Council under the European Union’s Seventh Frame-work Programme (FP7/2007–2013)/ERC Grant agreement no. 324233.
Copyright: © 2016. The authors license this article under the terms of the Creative Commons Attribution 3.0 License.
∗School of Education, Culture and Communication, Mälardalen
Uni-versity, Västerås, Sweden. Email: kimmo.eriksson@mdh.se.
†Centre for the Study of Cultural Evolution, Stockholm University,
Stockholm, Sweden.
‡Institute for Analytical Sociology, Linköping University, Norrköping,
Sweden.
forming an action may have on subsequent actions (Förster, Liberman & Friedman, 2007). The proposed mechanism is that a cognitive procedure activated by one task will re-main active and thereby easily be transferred to subsequent tasks (Schooler, 2002). A classic example of procedural priming is the Einstellung (mindset) studies, in which par-ticipants who had successfully used a certain problem solv-ing strategy in a task subsequently used the same strategy on problems where it was unnecessarily complicated or did not work at all (Luchins, 1942; Luchins & Luchins, 1950). Recent research has demonstrated similar effects on chess problems (Bilali´c, McLeod & Gobet, 2010) and numerosity judgment (Schillemans et al., 2012).
We are not aware of any research applying procedural priming to cognitive illusions. However, the application seems straightforward. Consider a question that strongly invites a cognitive illusion in one version of the question (“Strong”) but only weakly in another version (“Weak”). By this we mean that the same respondent should often give the wrong answer to the Strong version of the tion but the right answer to the Weak version of the ques-tion (e.g., following Kahneman & Tversky, 1996, it could be that the Weak version is phrased in terms of frequencies instead of probabilities). Now assume that when the two versions of the question are asked in sequence, the cogni-tive procedure that is activated by the first question tends to be transferred to the second question. Asking the Weak question first should then tend to weaken the illusion in the subsequent Strong question, in the sense of making it less prevalent than in a condition where Strong is asked
Figure 1: The number line used in the1/k estimation task.
1/40 1/1
out a preceding Weak. In contrast, asking the Sstrong ques-tion first should strengthen the illusion in a subsequent Weak question. This is our hypothesis.
1.1
The 1/k estimation task
We will test our hypothesis about procedural priming on a powerful cognitive illusion from the field of numerical cog-nition (Opfer & De Vries, 2008). The task is to estimate where fractions of the form1/k should go on a number line with endpoints of the same form, say, 1/1 and 1/40. See Figure 1.
Consider where 1/20 should be placed on the number line in Figure 1. The decimal value of 1/20 is 0.05. This value is numerically close to the value of the left endpoint, 1/40 = 0.025, and numerically distant from the value of the right endpoint,1/1 = 1.0. Thus, a correct linear estimate of the magnitude of 1/20 should place it close to the endpoint of 1/40. However, Opfer and De Vries (2008) demonstrated that most adults use a denominator-linear estimation strat-egy. For instance, most adults would place 1/20 roughly in the middle between 1/1 and 1/40, corresponding to where the number 20 should go on a number line between 1 and 40. Opfer and De Vries concluded that adults, having au-tomatized the distances between the familiar numbers that appear in the denominators, are subject to a powerful cogni-tive illusion on this task. Instead of evaluating the magnitude of fractions, they just relied on the denominators. This find-ing is in line with other research showfind-ing that people tend to avoid the cognitively effortful task of evaluating the magni-tude of fractions and instead over-rely on separate process-ing of numerators and denominators (Ischebeck, Schocke & Delazer, 2009; Meert, Gregoire & Noël, 2010).
The 1/k illusion has not previously been incorporated in the judgment and decision literature. However, it is re-lated to other tasks studied in this literature. For instance, the miles-per-gallon (MPG) illusion (Larrick & Soll, 2008) is the phenomenon that people misjudge the difference in fuel consumption among vehicles with different MPG val-ues. People tend to make judgments as if differences in fuel consumption were proportional to differences in MPG val-ues. But differences in fuel consumption are in fact propor-tional to differences in gallons-per-mile values, which is the reciprocal of the MPG value. The error is mathematically equivalent to estimating the distance between two fractions as proportional to the distance between their reciprocals — which is another way to phrase the1/k illusion. Thus, even
though the tasks are different, the underlying unwarranted mathematical shortcut is the same.
The same mathematical shortcut is the basis for the related cognitive illusion known as the time-saving bias, which is the tendency to misestimate the time one can save by increasing one’s speed of driving (Svenson, 2008). To avoid the MPG illusion and the time-saving bias, it is suffi-cient to present data on the reciprocal format instead, such that fuel consumption is presented in terms of gallon-per-miles instead of gallon-per-miles-per-gallon and speed is presented in terms of minutes-per-mile instead of miles per hour (Peer & Gamliel, 2013). This presentation relieves people of the effortful task of calculating the reciprocals themselves. In the1/k estimation task, this presentation would correspond to asking people to estimate the place on the number line of the fraction’s numerical value (e.g., estimating the place of 0.05 instead of 1/20). Indeed, the original study of the1/k estimation task found that adults showed no bias when per-forming this version of the task (Opfer & De Vries, 2008).
The MPG illusion and the time-saving bias give objec-tively wrong answers. For the1/k illusion the wrongness of estimations on a number line is subject to interpretation. To place 1/20 in the middle between 1/1 and 1/40 could be an error but it could also reflect a deliberate use of a non-linear “hyperbolic” scaling of the number-line on which the distance of1/k to 1 is indeed proportional to k − 1. Nei-ther the original study, nor we, have attempted to make the instructions unambiguous. To write unambiguous instruc-tions, it seems inevitable that one must either presume fa-miliarity with the sophisticated mathematical concepts of linear and non-linear scaling of number lines, or present concrete examples that would in themselves counter the illu-sion. Nonetheless, we claim that the1/k illusion represents a genuine cognitive illusion and not an odd interpretation of the task. Various kinds of evidence for this claim are pro-vided by the studies we present.
1.2
Outline of studies
Three studies are reported in this paper. Studies 1 and 2, as well as the pilot to Study 2 (mentioned below), were all conducted online with users of Amazon Mechanical Turk. Study 3 and the (below-mentioned) pilot to Study 3 were both conducted with pen and paper in a laboratory.
Study 1 The aim of Study 1 was to test that the 1/k il-lusion is related to poor cognitive reflection. This is one piece of evidence that 1/k illusion is a genuine cognitive illusion. The study included established measures of cogni-tive reflection as well as a single1/k estimation task (asking participants to estimate the place of 1/20 on the number line in Figure 1).
Study 2 The aim of Studies 2 and 3 was to test the hypoth-esis that procedural priming can both weaken and strengthen the1/k illusion. Recall that this requires different versions of the task. Specifically, we need one version of the task for which the illusion tends to be strong and another version for which the illusion tends to be weak. This was achieved in different ways. In Study 2 we created different versions of the task by manipulating which fraction was to be estimated. From Study 1 we know that the illusion is strong for estima-tion of 1/20. Now consider the case of estimating where 1/2 should go on the number line in Figure 1. In a pilot study of the1/k estimation task we found that participants estimat-ing 1/2 tended to be roughly correct much more often than participants estimating 1/20. In terms of the framework we used earlier, estimation of 1/20 is an Strong version of the task (i.e., the illusion is strong) whereas estimation of 1/2 is a Weak version (i.e., the illusion is weak). This is further ev-idence that the1/k illusion is not just an odd interpretation of the scaling of the number line.
We believe the reason for the prevalence of correct esti-mations of 1/2 is that this particular fraction has an over-learned geometric meaning. Already among four-year-olds it is common to associate one half of an object with its ge-ometric midpoint (Hunting & Sharpley, 1988). Given end-points at 1/1 and 1/40, the answer given by the midpoint intuition to the task of estimating 1/2 is very close to the correct answer.
The procedural priming hypothesis predicts that the ten-dency to follow a correct intuition for estimation of 1/2 should transfer to a reduction of the cognitive illusion for subsequent estimation of 1/20. And conversely, the ten-dency to follow an incorrect intuition for estimation of 1/20 should transfer to an increase of the cognitive illusion for subsequent estimation of 1/2. These predictions are tested in Study 2.
Study 3 In Study 3 we changed the number line by in-cluding a zero point, see Figure 2b. Note that this renders the interpretation of the scaling of the number line as hy-perbolic not just odd but logically impossible, as the hyper-bolic scaling would place the zero point at infinity. In a pilot study we found that the majority of participants suc-cumbed to the cognitive illusion even when marking this number line. However, the majority did the estimations cor-rectly when, instead of marking the line, they were asked to draw a new linefrom 0 to1/k under pre-drawn lines from 0 to 1/1 and from 0 to 1/40. See Figure 2a. In terms of our framework, the marking version of the estimation task is an Strong version whereas the drawing version of the task is a Weak version. We believe the reason for the weakening of the illusion in the drawing task is that drawing the length of a line cues thinking about the magnitude of the fraction.
The procedural priming hypothesis predicts that the ten-dency to make correct estimations when drawing lines
Figure 2: Two novel versions of the1/k estimation task: (a) Draw a new line from 0 to1/k under the pre-drawn lines from 0 to 1/1 and from 0 to 1/40; (b) Mark1/k on a line from 0 to 1/1 with 1/40 pre-marked.
1 kr 1 s 0 (a) (b) 0 1 kr 40 s 1 kr 1 s 0 1 kr 40 s
should transfer to a reduction of the cognitive illusion for subsequent estimations in the marking version of the task. And conversely, the tendency to make incorrect estimations when marking the line should transfer to an increase of the cognitive illusion for subsequent estimations in the drawing version of the task. These predictions are tested in Study 3.
2
Study 1
The aim of the first study was to test the prediction that those who do not fall for the illusion in the 1/k estimation task also tend to give correct answers to other problems requir-ing cognitive reflection. Specifically, we used the Cognitive Reflection Task (CRT) and the Syllogistic Reasoning Task (SRT). The CRT (Frederick, 2005) consists of three numer-ical problems that invite incorrect answers, for instance: “A bat and a ball cost $1.10 in total. The bat costs $1.00 more than the ball. How much does the ball cost?” The SRT (De Neys & Franssens, 2009, based on earlier work by Stanovich & West, 1998) is a verbal measure of cognitive style. It con-sists of eight syllogisms such as “All flowers need water. Roses need water. Therefore, roses are flowers.” In this ex-ample the conclusion is believable but not logically valid. The syllogisms in the SRT vary in believability of the con-clusion and logical validity. Participants are asked for each syllogism whether it is logically valid. Recent research by Baron et al. (2015) indicates that the CRT and the SRT tap into the same dimension of cognitive style.
2.1
Method
Participants Participants were 180 adults (52% male, age ranging from 18 to 70 years with mean 34 years) recruited among American users of Amazon Mechanical Turk at a fee of 1 US dollar.
Materials and procedure Participants filled in an online form in several parts, not all of which were relevant to this study.1 After the CRT (yielding a score between 0 and 3
cor-rect answers) and the SRT (yielding a score between 0 and 8 correct answers) followed the1/k estimation task. The lat-ter task asked the respondent to place a fraction on a num-ber line, the endpoints of which represent the fractions 1/40 and 1/1. Underneath the line were 39 equidistant circles. (This makes the metric positions of 2/40, 3/40, etc., go in the gaps between the circles, thus allowing high resolution in answers without any given circle standing out as the per-fect solution.) Respondents were asked to “click the circle closest to where the fraction 1/20 should be placed.”
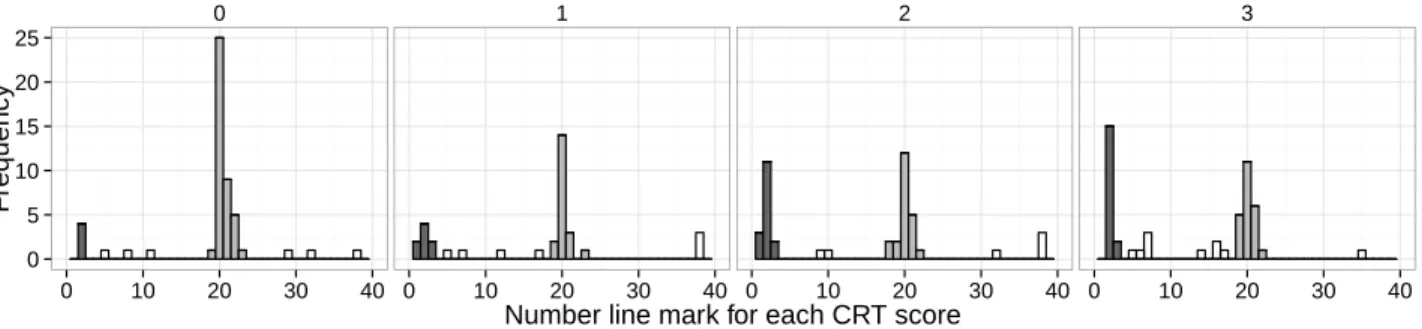
Analysis and results To analyze the estimation task, let the circles be numbered 1 to 39 from left to right. Going by the circles’ metric positions on the screen, the exact lo-cation of 1/20 on the number line is between circles 1 and 2, whereas the exact denominator-linear location is between circles 20 and 21. Figure 3 shows that among low CRT scor-ers there were almost no correct answscor-ers to the 1/20 esti-mation task; by contrast, high CRT scorers displayed a bi-modal distribution of clicks, with one mode at the left end (i.e., around the correct answer) and one mode around the midpoint (i.e., around the illusion answer). In order to cat-egorize answers we need to define a tolerance for when a slightly off estimate is still considered a hit. Figure 3 sug-gests one cluster of marks between 1 and 3 to be counted as “correct” and one cluster of marks between 18 and 23 to be counted as “illusion”. This yielded 45 responses categorized as correct and 106 responses categorized as illusion. The remaining 29 responses were excluded from the following analysis.
Consistent with previous research (Baron et al., 2015), scores on the CRT (µ = 1.52, σ = 1.17) and the SRT (µ = 5.83, σ = 2.11) were positively correlated, r = .42, p < .001 (corrected for reliability, the correlation was .60), and they combined to an adequately reliable measure of cog-nitive style (µ = 7.35, σ = 2.81, Cronbach’s α = .76). Consistent with the pattern seen in Figure 3, the cogni-tive style score was higher among those who made a cor-rect estimation (µ = 8.67, σ = 2.40) than among those who made the illusion estimation (µ = 6.75, σ = 2.79), t(95.82) = 4.28, p < .001, d = 0.68, t-test corrected for unequal variances.
1In the first part of the study, not analyzed here, participants indicated
their agreement with various quotes from relativist or anti-relativist schol-ars.
2.2
Discussion
In this study we replicated the original finding of a preva-lence of a cognitive illusion in the 1/k estimation task (Opfer & De Vries, 2008). The original study used pen and paper and all fractions had a unit (dollars per minute). By conducting the study online, using a number line on the screen with a limited set of locations to choose from, and with fractions presented without units, we showed that the cognitive illusion is robust to such details.
Results indicated that using the denominator-linear strat-egy in the1/k estimation task is related to making errors on the Cognitive Reflection Test and the Syllogistic Rea-soning Task. This finding supports our claim that use of the denominator-linear strategy reflects a cognitive illusion rather than a deliberate use of a hyperbolic scaling of the number line.
3
Study 2
Study 1 established that the cognitive illusion is prevalent for estimations of 1/20. In a pilot study to Study 2 (details available on request) we established that the cognitive illu-sion is much less prevalent for estimations of 1/2. As dis-cussed in the introduction, this difference may be caused by the fraction one half eliciting a strong intuition about mid-points. The aim of Study 2 was to test the prediction that procedural priming using one version of the task can weaken or strengthen the cognitive illusion in a subsequent task us-ing the other version.
3.1
Method
Participants Participants were 120 adults (50% male, age ranging from 18 to 70 years with mean 33 years) recruited among American users of Amazon Mechanical Turk at a fee of 40 US cents. They were randomly assigned to one of two different conditions described below, with 60 participants in each condition. Education levels were almost identically distributed in the two conditions (e.g., the proportion of par-ticipants with at least some college experience was 65% in one condition, 62% in the other).
Materials and procedure Participants filled in an online form where they were asked to make a series of estimations of fractions, using the number line in Figure 1 and the same 39 clicking positions as in Study 1. The fractions to be esti-mated were 1/20, 1/15, 1/8, 1/5, and 1/2. Depending on the condition to which the participant was assigned, these frac-tions were presented either in ascending order or descend-ing order, that is, either startdescend-ing with 1/20 and enddescend-ing with 1/2, or vice versa. We included three intermediate fractions to see if intuitions would persevere even through a long se-quence of tasks.
Figure 3: Distribution of estimations of 1/20 depending on CRT. Dark (light) gray bars indicate answers categorized as correct (illusion). 0 1 2 3 0 5 10 15 20 25 0 10 20 30 40 0 10 20 30 40 0 10 20 30 40 0 10 20 30 40
Number line mark for each CRT score
Frequency
3.2
Results
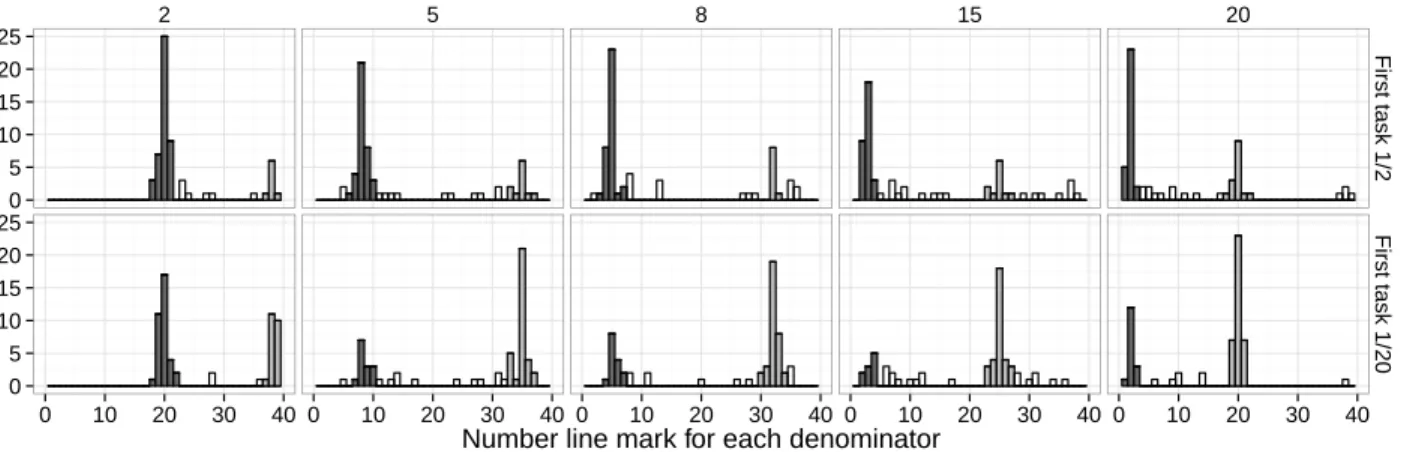
Figure 4 shows the distributions of all estimations in each condition. To simplify the analysis we focus on the first and last estimation in each condition, which always involved the fractions 1/2 and 1/20. As in Study 1, estimations of 1/20 were categorized as “correct” for number line marks between 1 and 3, and categorized as “illusion” for marks between 18 and 23. Estimations of 1/2 were similarly cate-gorized as “correct” for number line marks between 18 and 22, and as “illusion” for marks between 37 and 39.
We begin by analyzing the first estimation in each con-dition. In the condition where 1/20 was estimated first, the first estimation was often illusion (62%) and seldom correct (27%), replicating the pattern in Study 1. In the condition where 1/2 was estimated first the opposite pattern emerged, with first estimations seldom illusion (13%) and often cor-rect (73%), replicating the results from the pilot.
As predicted, results were considerably different when the same fractions were estimated as the last estimation of a series that started with the other fraction. Estimating 1/20 last instead of first yielded a much lower ratio of illusion to correct estimates (25:50 percent, compared to the previous ratio of 62:27 percent),χ2(1, N = 98) = 13.00, p < .001,
odds ratio = 4.62. Estimating 1/2 last instead of first instead yielded a much higher ratio of illusion to correct estimates (37:58 percent, compared to the previous ratio of 13:73 per-cent),χ2(1, N = 109) = 7.34, p = .007, odds ratio = 3.46.
3.3
Discussion
As in the pilot study to Study 2 we found that the cognitive illusion (that is, use of denominator-linear estimations) was much less prevalent for estimations of 1/2 than for estima-tions of 1/20. This adds further support to our claim that denominator-linear estimations do not reflect deliberate use of a hyperbolic scaling of the number line. Our interpreta-tion is instead that it is a genuine cognitive illusion that, in
the case of estimation of the fraction 1/2, may give way to another strong intuition that one half should be placed at the midpoint.
Thus, the1/k illusion was strong for 1/20 and weak for 1/2. Our main finding was the power of procedural prim-ing to weaken the illusion for 1/20 and to strengthen the illusion for 1/2. Indeed, the frequency of the illusion for 1/20 dropped by more than a half when 1/2 had been es-timated first. Conversely, the frequency of the illusion for 1/2 almost tripled when 1/20 had been estimated first. Thus, whatever intuitions were elicited in a first estimation task seemed to influence subsequent estimations even four esti-mations down the line.
4
Study 3
The first two studies provided various kinds of evidence for our claim that denominator-linear estimations reflect a cog-nitive illusion and not a deliberate choice of hyperbolic scal-ing of the number line. In a pilot study (details available on request) we made hyperbolic scaling logically impossible by extending the number line to a zero point (Figure 2b). Im-portantly, participants estimating the place of 1/20 on this number line still tended to place it in the middle of the line, rather than close to 1/40. This is our strongest piece of ev-idence for our claim that the cognitive illusion cannot be attributed to an odd scaling of the number line.
In the pilot study we also had a condition in which par-ticipants were asked to make their estimations by drawing a new linefrom 0 to1/k under pre-drawn lines from 0 to 1/1 and from 0 to 1/40 (Figure 2a). In this condition, most participants did not fall for the cognitive illusion but made correct estimations instead. Thus, the illusion seemed to be strong in the marking version of the task but weak in the drawing version. This is the setup we need for a conceptual replication of Study 2.
Figure 4: Distribution of estimations of the fractions 1/2, 1/5, 1/8, 1/15, and 1/20, depending on their order of presentation. Dark (light) gray bars indicate answers categorized as correct (illusion).
2 5 8 15 20 0 5 10 15 20 25 0 5 10 15 20 25 First task 1/2 First task 1/20 0 10 20 30 40 0 10 20 30 40 0 10 20 30 40 0 10 20 30 40 0 10 20 30 40
Number line mark for each denominator
Frequency
4.1
Method
Participants Participants were 65 students (48% male; age not recorded, but typically in their 20s) recruited from a pool of student volunteers for behavioural experiments at Stockholm University. They were randomly assigned to one of two different conditions described below.
Materials The material consisted of two piles with seven sheets of paper in each pile. In one pile (the marking task), each sheet showed the line in Figure 2b. The very brief in-structions, adapted from Opfer and De Vries (2008), read in translation: “Below is a money line for salaries for very brief jobs. For someone who earns 1/10 kr/s, estimate the value of this salary by making a pen mark on the money line.” Each sheet presented a new fraction to estimate, in a fixed pre-randomized order (1/10, 1/2, 1/3, 1/8, 1/5,1/15, 1/20). In the other pile (the drawing task), each sheet showed the two lines in Figure 2a. Here participants were instructed to estimate the value of the salary by “drawing a line of the corresponding length”. The same seven fractions as in the marking task were presented in the same fixed order. The order between the marking task and the drawing task varied between the two conditions.
Procedure Upon entry to the laboratory, participants were randomly assigned to start with either the marking task or the drawing task. Participants sat at desks, separated by screens. After completing a consent form they were given the pile of sheets for the first task, with the instruction not to go back to previous sheets. When they had completed the first task they were given the pile of sheets for the second task, with the same instruction not to go back. They then continued with unrelated experiments before being paid a fee, debriefed and dismissed.
Coding We converted participants’ estimations to num-bers between 0 and 200 by measuring, in millimeters, the horizontal distance between marks and the zero point in the marking task and the horizontal length of drawn lines in the drawing task. In the latter task most participants’ lines were aligned with the pre-drawn lines, but if they were not aligned it was always the length of the line they had drawn (rather than the position of the endpoint) that was measured. Analysis Consistent with the categorization scheme used in Studies 1 and 2, estimates were counted as “cor-rect” if within 15 millimeters of the correct value, and counted as “illusion” if within 15 millimeters of the perfect denominator-linear value.
4.2
Results
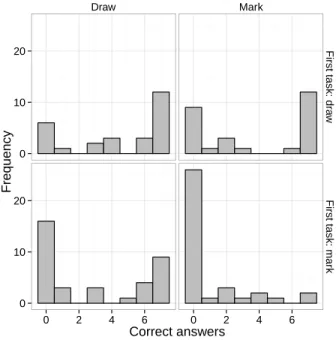
Two participants did not attempt the drawing task and were excluded. For each of the remaining participants (N = 63), the numbers of “correct” and “illusion” answers were com-puted separately for each task. In the drawing task, the av-erage across conditions was 3.57 correct answers, 1.86 illu-sion answers, and 1.57 other answers. In the marking task, the average was 2.17 correct answers, 3.08 illusion answers, and 1.75 other answers. Thus, the great majority of answers were either correct or illusion. Our analysis of the effect of conditions focuses on the number of correct answers; the number of illusion answers just shows the opposite patterns. Figure 5 shows how the number of correct answers were distributed for the marking task and the drawing task, de-pending on which task came first. The distributions tend to be bimodal, that is, each participant tended to be fairly consistent in making either correct or incorrect estimations of the seven fractions estimated in each task. We analyze the effect of condition using the Mann-Whitney U test. The
Figure 5: Distribution of the number of correct estimations when seven fractions (1/10, 1/2, 1/3, 1/8, 1/5, 1/15, 1/20) were estimated by marking (left) or drawing (right), depend-ing on which task came first.
Draw Mark 0 10 20 0 10 20 First task: dr a w
First task: mar
k
0 2 4 6 0 2 4 6
Correct answers
Frequency
marking task tended to yield a larger number of correct esti-mates when presented after the drawing task (median score 3, mean rank 37.17) than when presented first (median score 0, mean rank 28.12),U = 346.5, p = .043. In contrast, the drawing task yielded fewer correct estimates when pre-sented after the marking task (median score 1, mean rank 25.68) than when presented first (median score 6, mean rank 40.43),U = 258.5, p < .001.
4.3
Discussion
Replicating the pilot study, we found the cognitive illusion to be much less prevalent when estimations of fractions were made by drawing a new line of the appropriate length instead of by marking a pre-drawn line at the appropriate location; the median number of correct answers were 6 vs. 0 (out of 7). We emphasize again that, as the number line included a zero point, poor performance on the marking task does not seem to be attributable to hyperbolic scaling.
When the drawing task came after the marking task, the number of correct answers dwindled, with median scores decreasing from 6 to 1. Conversely, when the marking task came after the drawing task, the number of correct answers soared, with median scores increasing from 0 to 3. Thus, Study 3 provided a conceptual replication of the power of procedural priming to weaken, or strengthen, the1/k illu-sion.
5
General discussion
The power of procedural priming to influence problem solv-ing has been known since the classic mindset study of Luchins (1942). That study, and modern work in the same tradition, has focused on problems where a given strategy can be good for some instances of the problem but bad for other instances. The typical finding is that people tend to stick with the solution strategies they have started using, even when these strategies are no longer efficient. This could be due to the activation of one strategy inhibiting the activation of other strategies (Bilali´c, McLeod & Go-bet, 2010). An alternative explanation is that people are in fact aware of several strategies to reach a solution, but de-liberately stick to one of them to avoid the cost of switching (Schillemans et al., 2012).
In the present paper we applied procedural priming to the 1/k estimation task, which is a different kind of problem. It invites the use of an intuitively appealing but incorrect strategy, namely, to estimate the size of the fraction1/k as a linear function of the size of the denominatork. In con-trast to the problems studied in the literature cited above, this strategy is always incorrect (and always efficient in terms of cognitive effort, compared to the strategy of actually cal-culating the magnitude of the fractions in the task). Thus, the switching cost explanation for the effect of procedural priming should not apply here. For this reason, cognitive illusions such as the1/k illusion may provide a particularly clean application of procedural priming.
The application required different versions of the task such that the cognitive illusion is strong in one version and weak in the other. We used two different ways of obtaining task versions where the illusion was weak: by asking for es-timation of the particularly familiar fraction one half (Study 2), and by asking for estimations being done by drawing a line of the appropriate length rather than marking a pre-drawn line (Study 3). In both cases, procedural priming had substantial effects on the cognitive illusion. When the weak version preceded the strong version, the illusion was weak-ened in the latter. Conversely, the illusion was strengthweak-ened in the weak version when it was preceded by the strong ver-sion. These findings are consistent with the theory that once one strategy is activated, its use in subsequent tasks is facil-itated, and the activation of other strategies is inhibited.
In Study 1 we found performance on the1/k estimation task to be related to performance on other problems where an intuitive answer is incorrect (the Cognitive Reflection Test and the Syllogistic Reasoning Task). It is therefore nat-ural to ask whether the effect of procednat-ural priming on the 1/k illusion generalizes to other illusions. We believe the difficulty lies in finding suitable “weak” versions of other cognitive illusions.
References
Baron, J., Scott, S., Fincher, K., & Metz, S. E. (2015). Why does the Cognitive Reflection Test (sometimes) predict utilitarian moral judgment (and other things)? Journal of Applied Research in Memory and Cognition, 4, 265–284. Bilali´c, M., McLeod, P., & Gobet, F. (2010). The mecha-nism of the Einstellung (set) effect: A pervasive source of cognitive bias. Current Directions in Psychological Sci-ence, 19, 111–115.
De Neys, W., & Franssens, S. (2009). Belief inhibition during thinking: Not always winning but at least taking part. Cognition, 113, 45–61.
Frederick, S. (2005). Cognitive reflection and decision mak-ing. The Journal of Economic Perspectives, 19, 25–42. Förster, J., Liberman, N., & Friedman, R. S. (2007). Seven
principles of goal activation: A systematic approach to distinguishing goal priming from priming of non-goal constructs. Personality and Social Psychology Review, 11, 211–233.
Hunting, R. P., & Sharpley, C. F. (1988). Preschoolers’ cog-nitions of fractional units. British Journal of Educational Psychology, 58, 172–183
Ischebeck, A. K., Schocke, M., & Delazer, M. (2009). The processing and representation of fractions within the brain. An fMRI investigation. NeuroImage, 47, S89. Kahneman, D. (2011). Thinking, fast and slow. Macmillan,
New York.
Kahneman, D., & Tversky, A. (1996). On the reality of cog-nitive illusions. Psychological Review, 103, 582–591. Larrick, R. P., & Soll, J. B. (2008). The MPG illusion.
Sci-ence, 320, 1593–1594.
Luchins, A. S. (1942). Mechanization in problem solving: The effect of Einstellung. Psychological Monographs, 54 (Whole No. 248).
Luchins, A. S., & Luchins, E. H. (1950). New experimental attempts at preventing mechanization in problem solving. The Journal of General Psychology, 42, 279–297. Meert, G., Gregoire, J., & Noël, M.-P. (2010). Comparing
5/7 and 2/9: Adults can do it by accessing the magnitude of the whole fractions. Acta Psychologica, 135, 284–292. Opfer, J. E., & DeVries, J. M. (2008). Representational change and magnitude estimation: Why young children can make more accurate salary comparisons than adults. Cognition, 108, 843–849.
Peer, E., & Gamliel, E. (2013). Pace yourself: Improving time-saving judgments when increasing activity speed. Judgment and Decision Making, 8, 106–115.
Schillemans, V., Luwel, K., Ceulemans, E., Onghena, P., & Verschaffel, L. (2012). The effect of single versus re-peated previous strategy use on individuals’ subsequent strategy choice. Psychologica Belgica, 52, 307-326. Schooler, J. W. (2002). Verbalization produces a transfer
in-appropriate processing shift. Applied Cognitive Psychol-ogy, 16, 989–997.
Svenson, O. (2008). Decisions among time saving options: When intuition is strong and wrong, Acta Psychologica, 127, 501–509.
Stanovich, K. E., & West, R. F. (1998). Individual differ-ences in rational thought. Journal of Experimental Psy-chology: General, 127, 161–188.