On Gas Contaminants,
and Bipolar Plates in
Proton Exchange
Membrane Fuel Cells
YASNA ACEVEDO GOMEZ
Doctoral Thesis, 2019
KTH Royal Institute of Technology
School of Engineering Science in Chemistry, Biotechnology and Health
Department of Chemical Engineering Applied Electrochemistry
© Yasna Acevedo Gomez 2019 TRITA-CBH-FOU-2019:6
ISBN 978-91-7873-092-6
Akademisk avhandling som med tillstånd av Kungliga Tekniska Högskolan i Stockholm framlägges till offentlig granskning för avläggande av teknologie doktorsexamen torsdagen den 28 februari kl 10.00 i sal F3, KTH,
To Cristian, Luna and Inti
“A mistake is to commit a misunderstanding” -Bob Dylan-
Abstract
The proton exchange membrane (PEM) fuel cell is an electrochemical device that converts chemical energy into electrical energy through two electrocatalytic reactions. The most common catalyst used is platinum on carbon (Pt/C), which has shown the best performance in the fuel cell until now. However, the drawback of this catalyst is that it does not tolerate impurities, and both hydrogen and oxygen may carry small amounts of impurities depending on the production sources. The purpose of this thesis is to understand the effect of two impurities that are less investigated, i.e., ammonia, which may accompany the hydrogen rich reformates from renewable sources, and nitrogen dioxide, which may come from air pollution. The mechanism of contamination and an adequate recovery method for the respective contaminant are studied. Additionally, electroplated bipolar plates with Ni-Mo and Ni-Mo-P coatings were tested as alternatives to stainless steel and carbon materials.The results show that ammonia not only provokes changes in the polymer membrane but also in the oxygen reduction reaction (ORR), hydrogen oxidation reaction (HOR) and catalyst ionomer in both electrodes. The extent of performance recovery after the contamination depends on the concentration used and the exposure time. In contrast, nitrogen dioxide affects the catalyst in the electrode directly; the contamination is related to side reactions that are produced on the catalyst’s surface. However, NO2 is not attached strongly to the catalyst and it is possible to restore the performance by using clean air. The time the recovery process takes depends on the potential applied and the air flow.
Finally, the evaluation of electroplated Ni-Mo and Ni-Mo-P on stainless steel by ex situ and in situ studies shows that these coatings reduce the internal contact resistance (ICR) and the corrosion rate of the stainless steel considerably. However, the in situ experiments show that phosphorus addition to the coating does not improve the fuel cell performance; thus, the Ni-Mo alloy is found to be a promising choice for electroplating stainless steel bipolar plates.
Keywords: PEM fuel cell, contaminants, ammonia, nitrogen dioxide,
degradation, recovery, bipolar plates, electroplating, Ni-Mo, Ni-Mo-P, internal contact resistance.
Sammanfattning
Polymerelektrolytbränslecellen är en elektrokemisk enhet som omvandlar den kemiskt bundna energin i ett bränsle till elektrisk energi genom två elektrokatalytiska reaktioner. Den vanligaste katalysatorn som används är Pt/C som hittills också har visat bäst prestanda i bränslecellen. Nackdelen med denna katalysator är dock att den inte tolererar föroreningar. Både vätgas och syrgas kan innehålla små mängder av föroreningar beroende på ursprung. Syftet med denna avhandling är att förstå effekten på cellens prestanda av två olika föroreningar som är mindre undersökta: Ammoniak som kan medfölja vid reformering av förnybara råvaror till vätgas, och kvävedioxid som kan komma från luftföroreningar. Mekanismer för förorening av cellen och en adekvat återhämtningsmetod för respektive förorening har studerats. Dessutom, bipolära plattor av rostfritt stål elektrokemiskt belagda med Ni-Mo eller Ni-Mo-P, undersökts som ett alternativ till rent rostfritt stål- och grafit.
Resultaten visar att ammoniak inte bara åstadkommer förändringar i polymermembranet utan också i syrereduktionsreaktionen (ORR), väteoxidationsreaktionen (HOR) och jonomeren i de båda elektroderna. Till vilken grad som försämrad prestanda efter förorening kan återhämtas, beror både på koncentrationen av ammoniak och exponeringstid. När det gäller kvävedioxid så påverkar en bara elektrodens katalysator där försämringen av elektroden är relaterad till sidoreaktioner som sker på katalysatorytan. NO2 är dock inte starkt bunden till katalysatorn och det är möjligt att återhämta prestandan med bara ren luft. Tiden som återhämtningsprocessen tar beror på cellpotentialen och luftflödet.
Utvärderingen av elektropläterade skikt av Ni-Mo och Ni-Mo-P på rostfritt stål, som gjorts genom mätningar ex-situ och in-situ, visar att dessa beläggningar avsevärt minskar det interna kontaktmotståndet (ICR) och korrosionen av rostfritt stål. In-situ-experimenten visar att tillsatsen av fosfor i beläggningen inte förbättrar bränslecellens prestanda, men att legering av Ni-Mo är ett lovande material att använda vid elektroplätering av skyddande skikt på bipolära plattor av rostfritt stål.
Nyckelord: PEM bränslecell, föroreningar, ammoniak, kvävedioxid,
degradering, återhämtning, bipolära plattor, elektroplätering, Ni-Mo, Ni-Mo-P, interna kontaktmotståndet.
List of appended papers
Paper I
Ammonia contamination of the proton exchange membrane fuel cell. Yasna Acevedo Gomez, Alejandro Oyarce, Göran Lindbergh, and Carina Lagergren.
Journal of the electrochemical society, 165 (2018) F189 – F197.
Paper II
Effect of nitrogen dioxide impurities on PEM fuel cell performance. Yasna Acevedo Gomez, Göran Lindbergh, and Carina Lagergren.
Manuscript submitted
Paper III
Performance recovery after contamination with nitrogen dioxide in a PEM fuel cell.
Yasna Acevedo Gomez, Göran Lindbergh, and Carina Lagergren.
Manuscript
Paper IV
Evaluation of Ni-Mo and Ni-Mo-P Electroplated coatings on stainless steel for PEM fuel cell bipolar plates.
Hamed Rashtchi, Keyvan Raeissi, Morteza Shamanian, Yasna Acevedo Gomez, Carina Lagergren, Rakel Wreland Lindström, and Vahid Rajaei.
Fuel cells, 16 (2016) 784 – 800.
Paper V
Performance of a PEM fuel cell using electroplated Ni-Mo and Ni-Mo-P stainless steel bipolar plates.
Hamed Rashtchi, Yasna Acevedo Gomez, Keyvan Raeissi, Morteza Shamanian, Björn Eriksson, Mohammad Zhiani, Carina Lagergren, and Rakel Wreland Lindström.
Journal of the electrochemical society, 164 (2017) F1427 – F1436.
Contribution to the appended papers
I performed all the experimental work in paper I. A. Oyarce and I, did most of the data analysis and writing.
In paper II and III, I, under supervision of the co-authors, performed all the experimental work, analyzed the data and wrote the papers.
In paper IV, I participated in the lab work by doing the internal contact resistance measurements, and I also helped in the analysis of data. The paper was mainly written by H. Rashtchi.
In paper V, the experiments were performed mainly by H. Rashtchi, while the data were analyzed by both of us. B. Eriksson performed the SEM and EDS analyses, and the ICP measurements were done by M. Alemrajabi at the division of transport phenomena, KTH. The paper was written mostly by me.
List of abbreviations
PEM proton exchange membranePt/C platinum on carbon
GHG greenhouse gases
ICE internal combustion engine BPP bipolar plate
ICR internal contact resistance SME small and medium enterprises RTD research and development CV cyclic voltammetry
EIS electrochemical impedance spectroscopy ORR oxygen reduction reaction
GDL gas diffusion layer
MEA membrane electrode assembly
MS mass spectrometry
PTFE polytetrafluoroethylene HOR hydrogen oxidation reaction
SR steam reforming
DOE Department of energy
WE working electrode
CE counter electrode
RE reference electrode
ECSA electrochemical active surface area RHE reversible hydrogen electrode HER hydrogen evolution reaction BOL beginning of life
PFSA perfluorinated sulfonic acid HFR high frequency resistance OCP open circuit potential
SEM scanning electron microscope
EDS energy-dispersive X-ray spectroscopy XRD x-ray diffraction
AFM atomic force microscope
Contents
1
Introduction ... 1
Research context ... 2
Aim and scope ... 2
2
Background ... 4
Principles of the PEM fuel cell ... 4
Fuel cell components ... 5
2.2.1.1 Membrane electrode assembly (MEA) ... 5
2.2.1.2 Polymer membrane ... 5
2.2.1.3 Catalyst layer ... 6
2.2.2
Gas diffusion layer (GDL) ... 7
2.2.3
Bipolar plates (BPPs) ... 7
2.2.4
Sealing gasket ... 8
Hydrogen sources for fuel cells ... 8
2.3.1
Nonrenewable... 9
2.3.2
Renewable ... 9
2.3.2.1 Biogas ... 10
2.3.3
Other sources ... 10
Contaminants overview in PEM fuel cells ... 11
2.4.1
Ammonia contaminant in fuel gas ... 12
2.4.2
Nitrogen dioxide in oxidant gas ... 12
Electroplated stainless steel bipolar plates ... 14
3
Experimental ... 15
Fuel cell materials ... 15
BPPs electroplating preparation ... 15
Experimental fuel cell setup ... 16
Fuel cell hardware ... 17
Electrochemical characterization methods... 17
3.5.1
Cyclic voltammetry (CV) and stripping ... 17
3.5.2
Galvanostatic and potentiostatic measurements ... 19
3.5.4.1 EIS in H2/O2 ... 19
3.5.4.2 EIS in N2 ... 20
3.5.5
Symmetrical H
2|H
2cell ... 20
3.5.6
Mass spectrometer (MS) ... 21
3.5.7
Ex situ and in situ contact resistance ... 21
4
Results and discussion ... 23
Effect of ammonia contamination ... 23
4.1.1
Effect in a fuel cell ... 23
4.1.2
Effect in hydrogen and neutral media ... 26
Effect of nitrogen dioxide contamination ... 31
4.2.1
Effect in a fuel cell ... 31
4.2.2
Effect in neutral media ... 33
4.2.3
Recovery strategies ... 36
Electroplated coating on stainless steel bipolar plates 41
4.3.1
Ex situ contact resistance ... 41
4.3.2
In situ contact resistance ... 43
5
Conclusions and outlook ... 48
Ammonia contamination in PEM fuel cells ... 48
Nitrogen dioxide contamination in PEM fuel cells ... 48
Electroplated Ni-Mo and Ni-Mo-P on stainless steel
bipolar plates ... 49
Outlook ... 50
6
Acknowledgements ... 52
1 Introduction
For many years, the world economy has been related directly to energy, and fossil fuels are the primary energy source. However, this energy source is finite and its use irreparably harms the environment. During the last decades, the growth in population has demanded an increase in energy use; consequently, the global temperature has risen, mainly due to the greenhouse gases (GHG) emissions. At the same time, a huge amount of wastes are produced and collected in dumps, creating additional environmental problems. These issues have been considered by different researchers. A breakthrough is needed regarding one of the possible ways to use and reduce the wastes while producing hydrogen.
Currently, the world is striving towards new and better solutions in which the energy sources do not involve social injustices, health hazards and environmental problems. In this context, more effective and sustainable systems are needed to reduce the use of fossil fuels as the energy source, and fuel cells are considered by many to be the most suitable renewable systems [1].
The proton exchange membrane (PEM) fuel cell is a good alternative clean power source that can replace the use of the internal combustion engine (ICE) in vehicles [2] and in stationary power units. However, the fuel (hydrogen) is not readily available in nature in elemental form; therefore, it has to be produced either from nonrenewable or renewable sources. Today, the most common way to produce hydrogen is by steam reforming; this means that the hydrogen also contains contaminants that damage the catalyst of the fuel cell. At the same time, while the commercialization of fuel cell vehicles increases, the roads will not be free from ICE vehicles, and the fuel cell vehicles will be threatened by the ambient pollution, thus dramatically affecting the performance of the fuel cell.
To increase the commercialization of the fuel cell, the bipolar plates (BPPs), which constitute over 80 % of the total stack weight, must be easy to manufacture at a low cost and have good mechanical strength and high
electrical conductivity. For these qualities, stainless steel BPPs are the most promising alternative; however, corrosion and internal contact resistance (ICR) are still issues that must be improved, and therefore, a surface modification must by applied on the stainless steel BPPs.
Research context
The first part of this thesis project was connected to the European project “Biogas reforming and valorisation through PEM fuel cells” (Biogas2PEM-FC), in which small and medium size enterprises (SME) worked together with research and development (RTD) institutions and universities. The aim of the project was to improve part of the agrarian sector, which involves olive oil production; however, olive oil production generates a huge amount of waste disposal and creates an environmental pollution problem. The solution to this problem was to produce biogas through anaerobic digestion and then use a PEM fuel cell stack for the generation of electricity. Our work was focused on investigating different contaminants that might be generated by the production of hydrogen and from air pollution and then affect the performance of the fuel cell.
The second part of the work was done in collaboration with Isfahan University of Technology with the intention to test the influence of electroplated Ni-Mo and Ni-Mo-P bipolar plates on a single PEM fuel cell.
Aim and scope
The aim of this thesis is to investigate the performance degradation in the PEM fuel cell caused by the contamination from nitrogen compounds and to analyze the difference between electroplated Ni-Mo and Ni-Mo-P coatings on stainless steel bipolar plates.
In the first part, two contaminants are investigated, i.e., ammonia in the anode and nitrogen dioxide in the cathode. In both cases, a possible mechanism of contamination is proposed, and a possible regeneration method is studied as well. The electrochemical performance of the cell is evaluated at lab-scale by using galvanostatic measurements, steady-state polarization curves, cyclic voltammetry (CV), and electrochemical impedance spectroscopy (EIS).
In the second part, Ni-Mo and Ni-Mo-P coatings are electroplated on stainless steel bipolar plates and investigated by electrochemical methods in
ex situ and in situ measurements in a PEM fuel cell set-up. The internal
contact resistance is measured during both types of measurements, and the fuel cell performance is evaluated.
2 Background
Principles of the PEM fuel cell
The PEM fuel cell is an electrochemical device that converts the chemical energy of hydrogen and oxygen into electrical energy in a very clean way, with heat and water as the only byproducts. To carry out this conversion, two electrodes are needed, i.e., an anode and a cathode, which are separated by an electrolyte; the electrolyte helps to transfer the protons from the anode to the cathode and, at the same time, separates the anode and cathode. At the anode, the fuel (H2) is oxidized into electrons and hydrogen ions (protons) (Eq. 1). The electrons flow around an external circuit towards the cathode, generating electricity, while the hydrogen ions travel through the electrolyte to the cathode and react with the oxidant (O2) together with the electrons to form water (Eq. 2).
𝐻2 → 2 𝐻++ 2 𝑒− (1)
1
2 𝑂2+ 2 𝐻
++ 2 𝑒− → 𝐻
2𝑂 (2)
The fuel cell performance, to a large extent, depends on the oxygen reduction reaction (ORR) at the cathode, due to the slow electrode kinetics. The cell performance is determined by different voltage loss regions, which can be identified in a polarization curve; the polarization curve is the most common method to interpret the performance of a fuel cell. Four areas of losses are known in the whole current density range, which are as follow:
i) the losses caused by hydrogen crossover and mixed potential, which is
related to the permeation of gases and electrons through the polymer membrane, ii) the activation losses caused by slow electrode kinetics, especially at the cathode, iii) the ohmic losses due to the ionic, electronic and contact resistance, and iv) the concentration losses owing to the mass transfer limitation, which is the result of the change in concentration of the reactant on the surface of the electrodes.
Fuel cell components
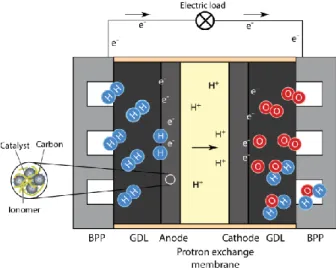
Figure 2.1 shows the schematic illustration of the PEM fuel cell with all its components. Typically, a fuel cell consists of a polymer membrane, two catalyst electrodes (anode and cathode), two gas diffusion layers (GDL), and bipolar plates, which are described below.
Figure 2.1 Schematic illustration of a PEM fuel cell.
2.2.1.1 Membrane electrode assembly (MEA)
The membrane electrode assembly (MEA) is the heart of the polymer electrolyte fuel cell and is composed of a polymer electrolyte membrane and two porous electrode layers. In the MEA, the oxidation of hydrogen and the reduction of oxygen, at the anode and cathode, respectively, occur. The MEA should provide a balance between the ionic charge through the polymer membrane and the electronic charge through the external circuit so that electrical power is produced.
2.2.1.2 Polymer membrane
The main role of the polymer membrane is to ensure proton conduction from anode to cathode, separate fuel and oxidant gases, and act as an electrical barrier. The most common membrane used in PEM fuel cell is perfluorinated sulfonic acid (PFSA) membrane, known as Nafion®. The thickness of the polymer membrane is a significant factor; however, it is
limited by its mechanical properties and its permeability to hydrogen and oxygen. Its purpose is to prevent the diffusion of the reacting gases. The conductivity is another important parameter, and it depends on the hydration of the membrane. The water produced at the cathode is not sufficient to hydrate the membrane; therefore the reactants need to be humidified before entering the fuel cell so that the membrane can swell up and improve its conductivity. The polymer membrane deteriorates during operation when it is not sufficiently humidified, when inadequate compression is applied, and when contaminants are present [3]. Additionally, the membrane degrades under open-circuit operation due to the lack of water production.
2.2.1.3 Catalyst layer
The catalyst layer is a three-dimensional porous structure, which provides a large electrochemically active surface area. The catalysts are supported on carbon particles, and an ionomer is used to hold all these particles together. The catalyst layer has the particularity of being both proton and electron conductive, unlike the polymer membrane. In the catalyst layer, the protons and electrons can be transported through the catalyst layer to the polymer membrane and to the external circuit, respectively. Additionally, the catalyst layer should provide the transport of gases and should be able to remove the water produced in the oxygen reduction reaction (ORR), Eq. 2. The porous electrodes must contain the necessary electrocatalyst to drive the electrochemical reactions in Eqs. 1 and 2. In the case of PEM fuel cell, platinum is the most convenient metal catalyst to be used at the anode and cathode due to its high electrochemical activity. However, platinum is an expensive catalyst; a good alternative to reduce the platinum content and, thus, the cost is to use platinum alloys. The Pt-Ru alloy has been shown to have better tolerance to contaminants while having a good electrocatalytic activity in the anode for hydrogen oxidation reaction (HOR) [4]. Research on new catalysts that can tolerate impurities, such as CO [5, 6] and H2S [7], has been developed, but there are still some open gaps that need to be investigated. The catalyst layer can also be the cause of degradation in the fuel cell performance due to Pt dissolution, contamination of the catalyst and carbon corrosion, which are discussed in part in this thesis.
2.2.2 Gas diffusion layer (GDL)
The gas diffusion layer (GDL) is the first layer reached by the reactants. The purpose of the GDL is to ensure a good distribution of the gases between the flow field channels in the bipolar plates and the catalyst layer and to provide good water management. The GDL is made of mesoporous graphite paper or cloth material, having in both cases a smooth surface on one side and an uneven surface on the other side. The smooth surface has contact with the catalyst layer, while the uneven surface has contact with the BPP. The fuel cell performance can also be affected by the GDL. In fact, this component is used to avoid mass transport limitations that lead to a decrease in the performance of the fuel cell.
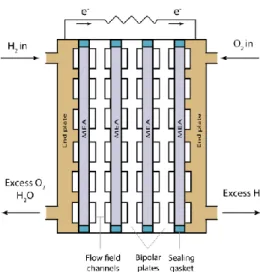
2.2.3 Bipolar plates (BPPs)
To achieve the desired output voltage from the fuel cell, several single cells need to be connected in a series. The series of single cells is called the fuel cell stack and it is shown in Figure 2.2. The BPPs are critical fuel cell components and play an important role in the stack since the overall performance of the fuel cell depends on the material properties of the BPPs. The BPPs convey the electric current to the external circuit, conduct the heat away, distribute the fuel and oxidant uniformly through the flow field channels, facilitate the water management, and separate the individual cells in the stack. For the BPPs to function properly, the material selected must have good electrical conductivity, high thermal conductivity, and high chemical and corrosion resistance. The most common materials used are graphite and stainless steel [8]. The metallic BPPs are the best option due to the low cost of mass production; however, this type of material suffers from corrosion and high contact resistance, and the solution to this problem is to coat the BPPs [9].
Figure 2.2 Illustration of the BPP in a fuel cell stack.
2.2.4 Sealing gasket
The sealing gasket is also part of the components of the fuel cell. It is placed around the MEA and between the bipolar plates as shown in Figure 2.2. The MEA and GDL are positioned in the middle of the seal, and the gasket must be equal to the thickness of the MEA plus the GDL. The purpose of the sealing gasket is to prevent the leakage of gases and insulate the fuel cell to avoid shorting; additionally, it should also keep the coolant in place. The most common material is silicon rubber, but there are also other materials, such as PTFE, fluoroelastomer and silicon elastomer. These materials are found to be the most stable after long-term use in PEM fuel cell operation [10].
Hydrogen sources for fuel cells
Hydrogen gas has been suggested as a clean and reliable alternative to traditional fossil fuels. Unfortunately, this gas is not readily available in nature, and it has to be produced from other compounds [11]. The hydrogen production has widely available feedstocks where various fossil fuels and renewable energy sources are included. In this section, the nonrenewable and renewable alternatives for hydrogen production are described with a focus on biogas, which is related to the thesis project.
2.3.1 Nonrenewable
Presently, the main world hydrogen supply comes from fossil resources, which are nonrenewable sources. Hydrogen may be produced from natural gas, oil and coal, which are currently the dominant sources in the world. Natural gas is the prevalent source for hydrogen production obtained by steam reforming, which is generated together with CO, CO2, and unreacted CH4 [12]. In oil refineries, hydrogen is produced and used on-site, for their processes. However, the liquid fuels from the refineries can be converted into hydrogen by reforming or partial oxidation for application in e.g., heavy duty vehicles and the chemical industry [13]. Coal is also an alternative for hydrogen production through gasification, in which the product is the same as in the reformation of natural gas, along with other constituents in minor concentrations [14].
2.3.2 Renewable
Hydrogen can also be produced from renewable sources, which is the best alternative to fight environmental problems and simultaneously take advantage using natural resources, such as sun, wind and water.
Renewable solar and wind energy can be used as energy inputs for hydrogen production through the electrolysis of water, which provides clean hydrogen with no contaminants. Even if the electricity generated from these renewable sources can be incorporated into the power system or stored in batteries, there are some drawbacks that make hydrogen storage a better option [15]. Additionally, the hydrogen can be used in a fuel cell to make electricity when the sun is not shining and the wind is not blowing.
Biomass is another good renewable alternative source to produce hydrogen and is the most likely source to replace fossil fuels [16]. There are many biomass sources that can be used, such as wastewater, municipal and agricultural wastes, manure, and wood industrial residues. To use biomass as a source of hydrogen to be used in fuel cell, the conversion can go through two different processes, i.e., gasification [17], and anaerobic digestion [18]. The results of these conversion processes are syngas and biogas, respectively. The choice of the process will depend on the biomass properties and the desired final product.
Because this study was part of the BIOGAS2PEM-FC project, as mentioned in the first chapter, biogas is described below.
2.3.2.1 Biogas
The average composition of biogas formed by anaerobic digestion from renewable sources is mainly 61 % CH4 and 36 % CO2, and the remaining 3 % consists of O2, N2, and small amounts of H2S, NH3, benzene and toluene [19-21].
The biogas can be reformed to obtain hydrogen via the steam reforming (SR) process and used in a fuel cell, but the trace compounds are not removed during the reformation process unless an extra clean-up step is added. There are different methods to remove H2S, such as activated carbon and metal oxides (Fe2O3) [22]; however, the ammonia removal research is not as advanced as the removal research for S-compounds. The amount of ammonia in the biogas will depend on the type of substrate, pH and temperature used in the digestion. These amounts may be from 0.01 ppb [19] up to 100 ppm [23]. Uribe et al. [24] showed a good alternative for NH3 removal, which involves passing the fuel stream through H+ exchange resin before entering the fuel cell. Activated carbon may also be used for NH3 removal, but it is an expensive alternative.
2.3.3 Other sources
As mentioned above, water electrolysis seems to be a good candidate for clean hydrogen production. However, this technology is still expensive, and hydrogen byproducts from industrial operations have instead been seen as a good potential hydrogen source alternatives, as it is produced at scale, low cost and at high purity (> 99 %) [25].
The chlor-alkali [25] and sodium chlorate [26] industry generates significant amounts of hydrogen as a byproduct. The processes are low cost hydrogen sources because hydrogen is not the main product and no additional investment is needed to purify it. Another alternative for hydrogen production is the electrolysis of alcohols [27, 28], which has the advantage of generating hydrogen at a lower cell potential than water electrolysis and the two industrial processes mentioned above. Therefore,
the hydrogen from these processes may be used as fuel for fuel cell applications directly.
Contaminants overview in PEM fuel cells
The contaminants that affect the PEM fuel cells have different sources as mentioned in section 2.3. Some of them accompany the hydrogen (fuel) after its production, some come with the oxygen (oxidant), which normally is ambient air, and others are originated from the fuel cell system materials, e.g., BPPs. All of these contaminants cause fuel cell performance loss and permanent damage to the membrane electrode assembly (MEA) [29, 30].
The hydrogen produced from different production processes, as mentioned in section 2.3, is accompanied by different species, such as CO2, CO, NH3 and H2S, present in the outflow together with hydrogen. The contamination mechanisms of CO, CO2 and H2S have already been studied and reviewed [30], while the contamination mechanism of ammonia is not yet clear.
Air has been the more practical and economical way to feed the cathode in the fuel cell. However, it is also accompanied by impurities, such as NOx, SOx, NH3 and O3. The concentration of these impurities varies from one place to another depending on the quality of the air. The contaminants come from vehicle exhaust, industrial emissions, and agricultural activities. Ozone also causes serious degradation in the performance; however, it was also investigated as a mitigation method for H2S contamination [31].
Other sources of contaminants are from the fuel cell system materials, such as the polymer membrane and bipolar plates. After the manufacturing of the polymer membrane, traces of cations (Ca2+ and Na+) may be present, which affect the proton conductivity in the membrane and the ionomer. From the bipolar plates, traces of metal ions, such as Fe2+, Ni2+, Cu2+, Al3+ and Cr3+, may be present and affect the membrane and the ionomer conductivity, thus causing performance degradation of the fuel cell.
Many research studies have been performed on the contaminants in fuel cells [29, 30]; however, ammonia and nitrogen dioxide are fuel cell contaminants that still need more research to understand their
contamination mechanisms. Ammonia is more likely to be present in the fuel after reformation of biogas from renewable sources, and nitrogen dioxide in the cathode air because of the coexistence of fuel cell and ICE vehicles.
2.4.1 Ammonia contaminant in fuel gas
The presence of ammonia after reformation will depend on the amount of nitrogen, before reformation, and the source of the reformate. Different research groups [24, 32-34] have studied this contaminant, and all of them have come to the conclusion that approximately 10 % of the total degradation is due to the membrane. From this conclusion, different mechanisms have been proposed, as follow: i) NH4+ decreasing the conductivity of the membrane and ionomer in the electrode, ii) NH3 adsorption onto the anode catalyst, inhibiting the hydrogen oxidation reaction (HOR), and iii) NH3 crossing over to the cathode, inhibiting the oxygen reduction reaction (ORR) [24]. By doing cyclic voltammetry measurements, Uribe et al. [24] and Soto et al. [32] stated that neither the anode nor the cathode catalyst layer were affected by ammonia. However, Halseid et al. [33], by using a symmetrical cell, suggested that HOR is affected by ammonia; they pointed out that this contribution to the degradation plus the membrane contribution did not account for the entire performance loss.
To further clarify the ammonia contamination on the fuel cell, Zhang et al. [34] compared the effect of relative humidity with and without ammonia and found that the ammonia decreased the electrochemical active surface area (ECSA) in the cathode catalyst.
So far, none of these authors have correlated all these changes to the actual loss of activity of the cathode for ORR. Thus, this correlation was intended to be done in this study.
2.4.2 Nitrogen dioxide in oxidant gas
Nitrogen dioxide is a common contaminant that comes from air pollution. This fuel cell contaminant has not been studied intensively; thus, there is no clear explanation of the contamination mechanism. NO2 was studied by
Jing et al. [35] and Mohtadi et al. [36] at low concentrations, and both studies proposed possible mechanisms. Jing et al. [35] suggested that the contamination is related to the adsorption of NO2 on the catalyst layer by the following reaction:
𝑁𝑂2+ 𝐻2𝑂 → 𝑁𝑂3−+ 2 𝐻++ 𝑒− (3)
However, Mohtadi et al. [36] proposed that the membrane and/or the catalyst ionomer are affected by NO2 due to the electrochemical reduction to NH4+ on the cathode.
𝑁𝑂2+ 8 𝐻++ 7 𝑒− → 𝑁𝐻4++ 2 𝐻2𝑂 (4)
Yang et al. [37] also reported that the contamination is due to the adsorption of NO2 on the catalyst surface that aimed to form of nitrous acid and then nitric acid by the following reactions:
2 𝑁𝑂2+ 𝐻2𝑂 → 𝐻𝑁𝑂3+ 𝐻𝑁𝑂2 (5)
𝐻𝑁𝑂2+ 2 𝑂2 → 4 𝐻𝑁𝑂3 (6)
These acids later lead to the formation of 𝑁𝑂2− and 𝑁𝑂3−.
Furthermore, Chen et al. [38] studied the effect of NO2 on a rotating disk electrode and revealed that the contamination on metallic Pt was more significant than on Pt oxides, and that the absorption was a chemical rather than an electrochemical process, which confirms the findings of Jing el al. [35] and Yang et al. [37]. Misz et al. [39] revealed that contamination with NO2 is not only dependent on the temperature but also on the cell potential. At higher operating potentials and low temperature, the cell performance degradation is more severe.
From the literature collected, the contamination of NO2 is most likely to be related to the degradation of the catalyst surface. However, to extend the investigation and facilitate the analysis of this contaminant, it might be studied at higher concentrations. In the presence of higher concentrations,
the phenomena that involves the contamination in the fuel cell may clearly be seen.
Electroplated stainless steel bipolar plates
The bipolar plates still have some issues regarding the durability of the fuel cell. The most researched material is stainless steel due to its high thermal conductivity, high strength, and the easy way to shape the flow field channels [40]. However, it has been recommended by several groups to coat this metal [41] because it corrodes in the long term and releases metal ions, thus affecting the ohmic losses. Moreover, reaching the DOE target (U.S. Department of Energy) is important to be qualified as a BPP in PEM fuel cells.
To decrease the corrosion in the stainless steel BPPs and the internal contact resistance (ICR) between the BPPs and the gas diffusion layer, different researchers have tested different types of coatings [42-47] and coating techniques [48-50]. Among the coating techniques, electroplating is a promising way to produce nanostructure and amorphous coatings, as the method has a low cost and low working temperature and no harmful byproducts are produced; additionally, the bath composition, pH and deposition current density can be controlled [51].
Nickel [52] and molybdenum [53] are known as high corrosion resistance elements. Electrodeposition coatings of these two elements (Ni-Mo) are usually used in aggressive acid media due to its high hardness and corrosion resistance [54]. Additionally, by changing the structure of Ni-Mo from crystalline to amorphous with the phosphorus, the corrosion properties of the coating may be improved [55]. Thanks to the properties described above, this electroplated stainless steel is promising in regard to reducing corrosion and meeting the DOE target.
3 Experimental
Fuel cell materials
The MEAs and GDLs used during this work were all commercially available, have good fuel cell performance and are reproducible. Two types of Gore PRIMEA MEAs were used. The MEA with catalyst loadings of 0.45 mg cm-2 PtRu/C on the anode and 0.4 mg cm-2 Pt/C on the cathode were used in papers I, II and III. In paper V, 0.1 mg cm-2 Pt/C on the anode and a 0.4 mg cm-2 Pt/C on the cathode were used. In all of the papers, a CarbelTM
type material was used as the GDL.
BPPs electroplating preparation
The AISI 316L stainless steel substrate was first prepared by polishing the surface and then ultrasonically cleaning it in ethanol and Milli-Q water. The Wood’s Nickel Strike method [56] was applied to remove the oxide film on SS316L, in a highly sulfuric acid solution. That procedure was followed by electroplating a thin layer of nickel on the SS316L, as an intermediate layer, in a solution containing nickel chloride and hydrochloric acid for 2 min, using a nickel anode.
The electroplating of Ni-Mo and Ni-Mo-P on 316L stainless steel was done in a two-electrode system with SS316L as the working electrode (WE) and a platinum wire as the counter electrode (CE). The bath composition and conditions are listed in Table 1.
Due to the different plating current densities of 30, 60 and 100 mA cm-2, the samples are named as Ni-Mo(30), Ni-Mo(60), Ni-Mo(100), Ni-Mo-P(30), Ni-Mo-P(60) and Ni-Mo-P(100) for the different combinations of electroplating metals and current densities.
Table 1: Composition and conditions of the plating bath used for Ni-Mo and Ni-Mo-P electroplating.
Bath composition Bath conditions
Salt Conc. (M) Temperature 30 °C
NiSO4·6H2O 0.2 Plating current density 30, 60, 100 mA cm-2
Na2MoO4·2H2O 0.02 pH 9
NaH2PO2·H2O 0.1 Bath stirring speed 300 rpm
C6H5Na3O7·2H2O 0.3 Time 30 – 90 min
Experimental fuel cell setup
Different configurations of the setup were used during this project, having in common the easy change of the inlet gas to the electrode from the clean to the contaminated one. The setup presented in Figure 3.1 was used in paper I, where the contaminant (NH3) is connected to the anode side. In a similar way, the experimental setup in paper II and III was done, but the contaminant (NO2) was combined with air to the cathode inlet. To obtain the desired contaminant concentration, the contaminated gas flow was diluted with the already humidified clean gas flow, thus avoiding contamination in the humidifiers.
The same setup was utilized for papers IV and V, in which only hydrogen, oxygen and nitrogen were used.
Two different potentiostats were used during the studies, namely, an IM6 unit together with an EL101 Booster (Zahner Elektrik) and a Solartron Interface SI1287 together with a 1255 frequency response analyzer. All of the experiments were run at 80 °C and 90 % relative humidity, unless specified differently.
Figure 3.1 Schematic view of the experimental setup used for the contamination and bipolar plates measurements.
Fuel cell hardware
Two different fuel cells hardware types were utilized during this work. A cell hardware from Fuel Cell Technologies, Inc. was used for the experiments with contaminants (Papers I, II and III), while a modified version of Ihonen’s fuel cell design [57] was used for the experimental work of bipolar plates (Papers IV and V). This in-house cell is able to separate the clamping pressure from the sealing pressure, thereby controlling the clamping pressure in a precise way. The in-house cell has two platinum probes that are isolated to avoid contact resistance between the probes and the current collectors. One probe is connected to the GDL and the other one to the BPP, thus allowing the measurement of the voltage drop at the BPP/GDL interface.
Electrochemical characterization methods
During the entire work of this thesis, different electrochemical methods were used. Below, a short description of the different methods is presented.
3.5.1 Cyclic voltammetry (CV) and stripping
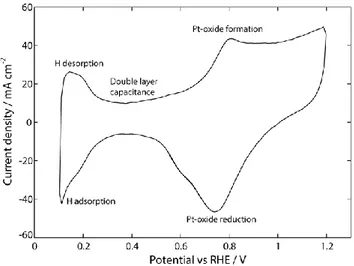
The CV is an electrochemical technique usually used for electrode surface characterization, which exhibits several peaks that correspond to the
oxidation and reduction processes of molecular species, as shown in Figure 3.2. At low potentials (0.1 – 0.35 V), adsorption/desorption of hydrogen is seen. From 0.35 to 0.45 V, the double layer capacitance is formed, and at the potential between 0.45 and 1.2 V, the Pt-oxide formation and Pt-oxide reduction are observed. A two electrode setup is used, i.e., a working electrode (WE), and a combined reference electrode (RE) and a counter electrode (CE). In this thesis, the WE was either the anode or the cathode, depending on the electrode that was studied. The potential is swept from 0.09 to 0.6 V when the WE was PtRu/C, and between 0.1 and 1.2 V when the WE was Pt/C.
Figure 3.2 Cyclic voltammetry of the Pt catalyst electrode of 3 cm2 recorded at a scan rate
of 100 mV s-1. Conditions: 80 °C, 90 % RH, 5 % H
2 in Ar at the CE/RE and N2 at the WE.
The CV technique was employed in papers I, II and V to determine the electrochemical active surface area (ECSA) of the electrodes (papers I and V) and to carry out the stripping of NO2 (paper II). For the ECSA, it was assumed that the coverage of one hydrogen monolayer on Pt is 210 µC cm-2. In the case of the PtRu/C electrode (paper I), the ECSA was calculated by CO stripping voltammetry, which gives a good approximation for the evaluation of ECSA. In all of the experiments, the CE was fed with 5 % H2 in Ar to reduce hydrogen crossover effects.
3.5.2 Galvanostatic and potentiostatic measurements
In all the experiments of this thesis, galvanostatic measurements were made at 0.5 A cm-2, while the potentiostatic tests were only performed in paper II when the adsorption of NO2 at different potentials was attempted. Both of these experiments were performed to quantify the degradation of the electrodes due to either the contamination (papers I, II and III) or the electroplated bipolar plates (paper V).
3.5.3 Steady-state polarization curves
Polarization curves were graphed in all of the papers, except in paper IV, from low to high current densities with 3, 5 or 9 min of current hold at each point, depending on the experiment that was carried out. Oxygen was supplied in papers I and V, while air was injected in papers II and III. The RE/CE was the H2 anode in all of the experiments.
3.5.4 Electrochemical impedance spectroscopy (EIS)
3.5.4.1 EIS in H2/O2
Electrochemical impedance spectroscopy (EIS) is a technique capable to revealing the physical properties of the fuel cell, where the behavior of the electrode-electrolyte interfaces can be analyzed. From the EIS spectra, the ohmic resistance (intercept of the semicircle at high frequencies) is related to the resistance of the membrane in papers I, II and III, assuming that there is no significant effect on the electrical bulk- and contact resistance, while in paper V the contact resistance is taken into account. The charge transfer resistance is associated with the kinetics of the ORR, assuming that the HOR does not have a major effect. The diffusion resistance known as mass transfer is visualized as a second arc at low frequencies.
In our experiments, the EIS spectra were recorded in two different ways, depending on the potentiostat used. In papers I and V, it was performed at the end of each current level during the polarization curve, and in papers II and III, it was done immediately following the completion of the whole polarization curve. The amplitude of the sinusoidal AC current used was between 5 and 8 % of the DC current. The system was perturbed over the frequency range between 10 kHz and 100 mHz.
3.5.4.2 EIS in N2
In a similar way as described above, EIS was done in inert media with N2 in the WE and 5 % H2 in Ar in the CE/RE. This is an attractive method to use because it is possible to obtain an estimation of the ionomer resistance in the porous electrode (RH+) and the electrode capacitance. The measurements were taken at 0.4 V vs. RHE (reversible hydrogen electrode), and the applied amplitude was 10 mV at the frequency range between 10 kHz and 1 Hz. The ionomer resistance was estimated from the 45° region at high frequencies and fitted with the model from Jaouen et al. [58], as shown in Figure 3.3. From the figure, a vertical line at low frequencies corresponds to a pure capacitance effect and was estimated by plotting 1 (−𝐼𝑚(𝑍) ∙ 𝜔)⁄ as a function of the frequency or Re(Z). This experiment was used in papers I and V.
Figure 3.3 EIS spectra, experimental and fitted, in N2 on the Pt/C electrode performed at
0.4 V vs. RHE.
3.5.5 Symmetrical H2|H2 cell
The symmetrical cell measurement was performed only in paper I, to study the HOR and its contribution to the performance loss while NH3 was introduced. In the fuel cell, hydrogen was entering from both sides. In the WE, where the HOR occurs, either pure H2 or H2 with 200 ppm NH3 was introduced, while in the CE/RE, where the hydrogen evolution reaction
(HER) takes place, only hydrogen was introduced. In this measurement, the current was defined as positive when the anode was connected as the WE [59].
3.5.6 Mass spectrometer (MS)
In paper II, a Hiden mass spectrometer (HPQR-20 QIC) was connected on-line with the outlet of the WE (cathode) to identify the possible chemical species formed due to contamination with NO2. The MS is a research grade Bench-top Gas Analysis System with dual pumping systems equipped with a triple filter with a 0 – 200 amu mass range and a heated capillary inlet (1 m). The signals monitored simultaneously to the CV were as follow: m/z = 30 for NO, m/z = 44 for N2O and m/z = 46 for NO2.
3.5.7 Ex situ and in situ contact resistance
The electroplated bipolar plates were evaluated by ex situ experiment in this thesis. Regarding the ex situ investigations in paper IV, my work only includes the measurements of the internal contact resistance (ICR) between the gas diffusion layer (GDL) and the coated stainless steel BPP in the in-house cell. From this evaluation, some electroplated BPPs were selected to be tested in situ in a single fuel cell (paper V). The ex situ measurements were made to simplify the analysis, leaving aside all the phenomena that involve the fuel cell, while in the in situ measurements, all the interactions can be studied, thus giving a more direct and effective way to evaluate the electroplated BPP. The schematic drawings of the in-house fuel cell used for the ex situ and in situ measurements are shown in Figure 3.4.
4 Results and discussion
Effect of ammonia contamination
4.1.1 Effect in a fuel cell
As described in section 2.4.1, ammonia might be present together with hydrogen after reformation, especially if hydrogen is produced from renewable sources. To further elucidate all the suggested causes for decreased performance proposed by different authors [24, 32-34], this contaminant is studied in paper I. Ammonia is exposed at the anode of the fuel cell at a high concentration (200 ppm of NH3) and at low current densities (0.1 A cm-2), with the intention to quantify the polarization losses of each part of the cell.
The performance was measured in galvanostatic mode by introducing 200 ppm NH3 together with H2 to the anode for 3 h, followed by a polarization curve. While these measurements were done, EIS was recorded at the same time. Figure 4.1a shows the detrimental effect that NH3 has on the performance of the fuel cell, in which a total voltage decay of 290 mV and an increase in membrane resistance of 83 mΩ cm2 are seen during a 100 min period. Although the increase in membrane resistance is significant, it only accounts for 8.3 mV of the total voltage decay at this particular applied current density.
Figure 4.1b shows the polarization curves of a fresh MEA and after introducing 200 ppm NH3 for 3 h at 0.1 A cm-2. At low current densities, the decrease in cell voltage is clear, while the performance at higher current densities appears not to be significantly affected, probably due to water production at the cathode through ORR. It is also seen along the current density range that the membrane resistance decreases from 214 mΩ cm2 (10 mA cm-2) to 107 mΩ cm2 (1 A cm-2). Apparently, the water seems to mitigate, at least in part, the increase in membrane resistance. From the figure, it is clearly perceived that either the increased ionomer resistances in the electrodes and/or a severe catalyst deactivation cause the main part of this degradation.
Apparently, the water plays an important role in the behavior of NH3 contamination in the fuel cell. Several authors [60-62] previously suggested that NH3/NH4+, in acidic media, is likely to dissolve in the ionic phase of the fuel cell, tying up the sulfonic acid sites (-SO3H), thus decreasing the water uptake and the ionic conductivity of the membrane.
Figure 4.1 Performance of the fuel cell using H2 + 200 ppm NH3 at the anode. (a)
Galvanostatic measurement at 0.1 A cm-2 and (b) the steady state polarization curves
To continue the investigation, experiments were also recorded at 0.5 A cm-2, and at different concentrations. These experiments were done at the same total dosage of 10 µmol NH3, e.g., 200 ppm in 4 h and 100 ppm in 8 h. After the initial drop in voltage for all different concentrations, a tendency for the cell voltage to reach a steady state is seen in Figure 4.2a, although the necessary time to reach that was shorter for higher concentrations than for lower concentrations. Reaching the steady state indicates that there is no further accumulation of ammonia in the membrane, catalyst and/or ionomer. The figure also depicts the increase in membrane resistance for all contamination levels, where the values reached are all between 107 and 117 mΩ cm2; these results agree fairly well with the membrane resistance in Figure 4.1b.
After the galvanostatic measurements at different concentrations are taken, the respective polarization curves were recorded and are depicted in Figure 4.2b. Performance degradation was expected in all of the curves; however, the performance after the addition of 5 and 12.5 ppm NH3 are somewhat more affected than the performance with 25 ppm NH3. This result means that the performance degradation not only depends on the concentration of ammonia but also on the ammonia exposure time.
The experiments done thus far cannot fully explain the ammonia contamination mechanism. Therefore, in the next section, every single part of the fuel cell is analyzed to answer the questions, and thus clarify the contamination due to NH3.
Figure 4.2 (a) Contamination measurements at different concentrations of NH3 at
0.5 A cm –2, followed by (b) the steady state polarization curves.
4.1.2 Effect in hydrogen and neutral media
One possibility suggested from other authors is the diffusion and/or migration of NH4+ from the anode to cathode, which is assumed to contribute to the cathode side degradation. To continue the investigation of ammonia contamination, the ionomer resistance on the anode and cathode was measured in nitrogen media. The estimation of the ionomer resistance
was obtained by use of the impedance model that is described in detail by Jaouen et al. [58].
In this set of experiments, 200 ppm NH3 together with nitrogen was introduced at the WE, and 5 % H2 in Ar to the CE/RE. Figure 4.3 shows the compilation of the results obtained from the degradation of the membrane- and ionomer resistance of the cathode and anode. The increase in membrane resistance correlates fairly well with the measurements in Figure 4.1a, which were done with oxygen and low water production. Furthermore, the figure shows that ammonia has more of an effect on the cathode ionomer resistance (RH+,C) (estimated from 45°, as shown in Figure 3.3) than on the membrane resistance (Rmem), since they increased by 434 % and 115 %, respectively.
To estimate the impact of ionomer resistance (RH+,C) and its further impact on fuel cell performance due to ammonia, the effective ionomer resistance (RH+,eff,C) was calculated according to [63] as follows:
𝑅𝐻+,𝑒𝑓𝑓,𝐶 = 𝑅𝐻+,𝐶
3 (7)
Additionally, the voltage drop (ΔERH+,eff,C) related to the cathode ionomer resistance may be calculated by Ohm’s law as follows:
∆𝐸𝑅𝐻+,𝑒𝑓𝑓,𝐶= 𝑖 ∙ 𝑅𝐻+,𝑒𝑓𝑓,𝐶 (8)
This relationship was applied at a very small current density, to avoid water production, which is produced at higher current densities; otherwise, Eq. (8) would be invalidated. Therefore, for this case, it is assumed that at 0.1 A cm-2 the water production is sufficiently small. For the calculation, the value of the cathode ionomer resistance recorded at 100 min (0.8 Ω cm2) was taken, and the resulting voltage drop, related to the cathode ionomer resistance, will be 27 mV when introducing 200 ppm NH3 into the fuel cell. This value is much higher than the voltage drop obtained due to the increase in membrane resistance. However, this value does not account for the entire voltage loss experienced by the cell (290 mV).
Figure 4.3 Data compiled from the fitted impedance model described in [58]. (a) Cathode and (b) anode, measured at 0.4 V vs. RHE, with 200 ppm NH3 added to the WE.
To clarify this behavior, it is necessary to consider the structure of the polymer membrane and the catalyst ionomer. The polymer membrane (Nafion) has water-filled nanochannels with sulfonic acid groups (-SO3H) lined up within the internal surface of the channels [64], while the catalyst ionomer has a nonpolar backbone as the bundle core and the sulfonic acid groups projected outward in parallel to the surface [65]. The differences in their structure suggest that the catalyst ionomer has lower water sorption and, thus, is more sensitive to NH3 contamination than the polymer membrane.
In the same way as observed in the cathode ionomer resistance, an increase in the anode ionomer resistance (RH+,A) is detected over time, as well. The voltage drop related to the increase in the anode ionomer resistance (ΔERH+,eff,A) was estimated from the value recorded at 100 min (0.68 Ω cm2), which is equal to 23 mV. It is seen that the anode ionomer resistance is not the main source of the voltage loss of the cell.
The same type of experiments was also done the other way around, i.e., 200 ppm NH3 together with hydrogen was introduced at the CE/RE, and N2 at the WE. The results presented similar values as in Figure 4.3 and show that the NH3/NH4+ diffuses and/or migrates from anode to the cathode, thus affecting in a negative way the cathode ionomer resistance.
So far, the contributions to total cell degradation (290 mV) caused by the membrane, cathode ionomer and anode ionomer are 8.3, 27 and 23 mV, respectively, which do not account for the total cell loss. Apparently, the losses related with the HOR and ORR must significantly contribute to the total voltage decay due to NH3. That is why a symmetrical cell with H2|H2 was used to estimate the degradation due to the HOR. This cell was operated at 0.1 A cm-2 with 200 ppm NH3 on the anode (WE) when carrying out the HOR. The results showed that the cell voltage increases by 330 mV in a period of 100 min, and the membrane resistance increased by 101 mΩ cm2 (10 mV). To better estimate the losses related to the HOR and HER, the voltage loss previously calculated for the ionomer resistance of the anode (23 mV) and cathode (27 mV) are used to correct the voltage of the symmetrical cell, resulting in a loss of at least 270 mV for the combined HOR/HER.
Additionally, the same measurement was also carried out at the HER, i.e., introducing NH3 at the cathode (CE/RE), in which the results are nearly in the same magnitude as in the HOR. Therefore, it is assumed that the HOR and HER are equally affected by NH3, and consequently, the loss related to the HOR is as high as 135 mV. Finally, the quantification of the losses caused by NH3 are shown in Table 4.1. The estimation for the ORR voltage loss was calculated by subtracting all the other losses from the total.
Table 4.1 Estimation of the losses for the respective part of the fuel cell while introducing 200 ppm NH3 in H2.
Voltage loss / mV Percentage / %
Anode HOR 135 47 Ionomer 23 8 Membrane 8 3 Cathode ORR 97 33 Ionomer 27 9 Total 290
From this table, it can be concluded that the catalyst deactivation of both electrodes is the major contributor to the degradation of the fuel cell performance as shown in Figure 4.1a.
To obtain a better understanding of the extent of catalyst deactivation, cyclic voltammetry measurements were performed. The measurements were done for the cathode and anode electrodes, and the decrease in the electrochemical active surface area (ECSA) of both electrodes, calculated from the hydrogen desorption peak charge, is shown in Figure 4.4. A similar decrease was seen in liquid acid media [66, 67] when the concentration of ammonia was increased up to 300 and 1700 ppm, respectively, and in a fuel cell when 25 ppm of NH3 was introduced for 12 h [34]. From the figure, it was observed that neither the Pt-Ru nor the Pt catalyst were able to minimize the ammonia effect, and none of the catalysts were restored from possible byproducts during the reductive scan. In Figure 4.4, the decrease in electrode capacitance is also shown for both the cathode and anode. These values are obtained from the EIS measurements in nitrogen media, as explained in section 3.5.4.2.
Figure 4.4 Estimated ECSA and capacitance at the (a) Pt cathode and (b) Pt-Ru anode. Assessing what is happening in the fuel cell due to ammonia contamination is challenging. In this study, it can be confirmed that all the mechanisms proposed before by other authors [24, 32-34, 68] contribute to the degradation by NH3. However, from the above results, it is proposed that the total degradation is mainly related to an altered interaction between the
shown by the decrease in capacitance (Figure 4.4). According to Table 4.1, the HOR is the most affected. Normally, the anode catalyst layer may be designed to have a higher ionomer content than the cathode. Furthermore, water drag from anode to the cathode tends to dry-up the anode side of the fuel cell. It is well established that NH4+ may reduce the water uptake of Nafion membranes and recast Nafion films [60-62, 69, 70]. To further complement this explanation, it has been shown that the hydrogen peroxide formation increased significantly in the presence of ammonium ions [71, 72]. Hydrogen peroxide may affect the perfluorinated sulfonic acid (PFSA) ionomer by attacking some of the unstable functional groups of the ionomer [71-74].
Effect of nitrogen dioxide contamination
4.2.1 Effect in a fuel cell
Air is the most economical way to feed the oxidant in a fuel cell. However, the air contains small amounts of contaminants that can severely affect the cell performance. As mentioned in section 2.4.2, nitrogen dioxide is one of the common pollutants and it needs to be deeply investigated in regard to the fuel cell to allow fuel cell cars to run together on the roads with the internal combustion engine (ICE) vehicles without problems. This contaminant is studied in papers II and III. First, the performances at different concentrations and the possible contamination mechanism are studied, and then different recovery processes are presented.
Figure 4.5a shows the cell performance degradation due to NO2 at different concentrations and the same dosage of 215 µmol NO2, at 0.5 A cm-2. In all of the cases, an abrupt drop is seen due the quick adsorption of NO2 on the catalyst surface, which suppresses the ORR. The degradation was faster and more severe at higher NO2 concentrations, while it was more relaxed at lower concentrations, although only the lowest concentration seems to reach a steady state. The other concentrations most likely needed more time to reach the steady state. The relationship between the concentration and degradation is not linear; even though the same dosage was used, the degradation increased as the concentration increased.
Figure 4.5 (a) Cell voltage degradation at different concentrations of NO2, but the same
dosage, (b) steady state polarization curves at the BOL and after the different concentrations were applied, (c) Nyquist plots at 0.5 A cm-2 for the different concentrations
The inset in Figure 4.5a clearly shows a small shoulder in each curve, seen at a potential between 0.57 and 0.65 V. This phenomenon, which has not been seen before, may be attributed to three different reasons, as follow: i) due to the slow adsorption of the species formed at approximately 0.6 V, where NO2 is reduced [75], ii) due to the different adsorption positions that NO2 may have around this potential [76-79], and iii) due to the porous structure of the electrode, in which NO2 contamination is not homogeneous [80].
Figure 4.5b depicts the respective steady state polarization curves that were recorded after the contamination was applied at different concentrations. It is seen that the cell performance was more affected in the activation region at low current densities, in all of the cases, which is most likely related to the degradation in the catalyst layer.
The EIS measurements in Figure 4.5c show that the contaminant increased the high frequency resistance (HFR) with in average of approximately 6.3 mΩ cm-2, which equals 3 mV at the current density of 0.5 A cm-2. This value is within the range of error; therefore, it can be said that the membrane is not much affected by NO2 as a contaminant. It is seen though that the semicircle diameter drastically increased upon the introduction of NO2, which indicates that NO2 is affecting the cell performance. From the figure, it is also seen that the EIS spectra have different patterns, especially for the concentrations of 100 and 200 ppm. In these spectra, an inductive feature is observed at low frequencies, which may be related to processes within the cell and seen by Pivac et al. [81]. For the present observation, the inductive feature is associated with intermediate species that may be formed on the Pt electrode surface, which may be part of the dramatic loss in the cell performance at higher concentrations. The possible intermediate species formed are discussed in the next section. In contrast to the other concentrations (12.5, 25 and 50 ppm), a second loop is depicted that may be assigned to intermediate species and to possible interactions between these species and the carbon surface. However, the loop decreases as the concentration decreases.
4.2.2 Effect in neutral media
From the above experiments with NO2 contamination in the fuel cell, the catalyst layer was indicated to be the reason for the degradation. Therefore,
the electrochemistry of NO2 contamination on the catalyst layer needs to be identified. Cyclic voltammetry (CV) was performed while introducing 100 ppm NO2 in nitrogen on the WE. Figure 4.6 shows a clear effect of the contamination of the catalyst layer due to NO2, where the CV characteristics are altered over time in the potential region between 0.1 and 0.8 V. In this potential range, the voltammograms move towards higher cathodic currents and then gradually return to a position close to the BOL. When NO2 was introduced, the same behavior was repeated two times. These changes in the voltammograms suggest the existence of intermediate species on the catalyst surface. Similar behavior was observed in acid media with platinum [75, 82, 83], iridium, ruthenium and rhodium [82], in which the alteration of the CV was attributed to the reduction of NO3- [82], reduction of NO2- [75] and/or formation of hydroxylamine [84]. Lin et al. [85] showed that reduction and oxidation of NO2 exist, which was later confirmed by Chen et al. [38]. They suggested that complex reaction pathways take place during the cyclic sweep and that these reactions compose the electrochemical nitrogen cycle pointed out by Rosca et al. [86].
Figure 4.6 Consecutive cyclic voltammetry performed at 20 mV s-1 while introducing
100 ppm NO2 in the WE.
The WE was studied when introducing NO2 at different constant potentials, i.e., 0.2, 0.3, 0.4 and 0.6 V, followed by a stripping voltammogram. Figure 4.7 shows the stripping voltammograms after contamination of the WE. While
the NO2 was introduced in the WE at the different potentials, the same effect was seen as in Figure 4.6 and repeated twice (Figure 9 in paper II). In Figure 4.7, a clear peak is seen, i.e., an oxidation peak at 0.65 V for the adsorption potentials of 0.2 and 0.3 V, while the oxidation peak at 1.05 V only appears at the adsorption potentials of 0.4 and 0.6 V. The reduction peaks at 0.17 and 0.68 V correspond to the adsorption potential of 0.6 V, and the reduction peak at 0.15 V corresponds to the adsorption potential of 0.4 V.
Figure 4.7 Stripping voltammograms at 50 mV s-1 after the introduction of 100 ppm NO 2 on
the Pt-catalyst.
From these observations, a possible mechanism related to NO2 contamination in a fuel cell can be suggested. Similar to the proposition of other authors [35, 38, 85], the oxidation peak at 1.05 V in Figure 4.7 may be related to the formation of nitrate ions according to Eq. 3. Then, nitrate ions may be reduced to nitrite ions at the potential of 0.68 V as follows [82, 87]:
𝑁𝑂3−+ 2 𝐻++ 2 𝑒− → 𝑁𝑂2−+ 𝐻2𝑂 (9)
The reduction peaks at potentials lower than 0.2 V may be referred to as the formation of N2O (Eq. 10) or NH2OH (Eq. 11) [75, 87-89] as follows:


![Figure 3.4 Schematic drawing of the (a) ex situ and (b) in situ PEM fuel cell from [57]](https://thumb-eu.123doks.com/thumbv2/5dokorg/4293814.95954/34.718.84.561.136.355/figure-schematic-drawing-situ-situ-pem-fuel-cell.webp)


![Figure 4.3 Data compiled from the fitted impedance model described in [58]. (a) Cathode and (b) anode, measured at 0.4 V vs](https://thumb-eu.123doks.com/thumbv2/5dokorg/4293814.95954/40.718.78.562.137.337/figure-data-compiled-fitted-impedance-described-cathode-measured.webp)
