Keywords: engineering education, performance assessment, written exam, dynamic rater effect, rater fatigue
In this paper the possibility of an existing bias, due to the order (here by the initial letters of the family names) in which the results of the students are judged, was studied. This would constitute of a dynamic rater effect of harshness, or leniency, toward the performance of these students due to rater fatigue. A substantial dataset, consisting of 12 years of written exams, for a course, for 2512 examinees, was mined and the results analyzed. The evidence point to the fact that the assessment procedure does not favor, or disfavor, students with family names having initial letters placed late in the alphabet.
Department of Electromagnetic Engineering, School of Electrical Engineering, KTH Roy-al Institute of Technology
On the Assessment of Written Exams and Possible Bias
due to Dynamic Rater Effects Emerging from Student
Initials and Rater Fatigue
Artiklar är kollegialt granskade. Övriga bidrags-typer granskas av redaktionen.
Se www.hogreutbildning.se ISSN 2000-7558
* Författarkontakt: daniel.mansson@ee.kth.se Förutsatt korrekt källhänvisning får texten användas och spridas icke-kommersiellt. Daniel Månsson* and Martin Norgren
introduction
A key part in learning and teaching activities at universities is the evaluation of the performance of students. For many courses in engineering programs the traditional method to assess students level of understanding is through written exams. Traditional written exams, taking place in large halls where individuals are separated, have the advantage of being, if properly designed and constructively aligned to the course content (Biggs & Tang, 2007), fair to the absolute majority of the students (not including, e.g., dyslectic students without proper care). It is considered fair on the basis that:
(1) Students are effectively hindered from cheating or plagiarizing each other.
(2) Questions can be designed to reflect different levels of understanding as, e.g., described by BLOOMS (Bloom, Engelhart, Furst, Hill & Krathwohl, 1956), or the SOLO, taxonomy (Biggs & Tang, 2007).
(3) The understanding of an individual student is easily discernible as opposed to in group projects.
This is, however, of course made on the assumption that the persons assessing the students written exams are impartial, i.e., judges subsequent exams equally (constant with respect to time and, thus, student). If this is not the case, so called rater effects (i.e., how the rater, being a person of limited capacity, affects the rating) can be seen (Wolf, 2004; Israelski & Lenoble, 1982; Ling, Molluan & Xi, 2014). While investigating how the object of measure (e.g., an exam) is
evalua-ted rater effects are often seen in three categories; accuracy/inaccuracy, harshness/leniency and centrality/extremism (how raters apply the extremes of the rating scale). Furthermore the rater effects can be static or dynamic over time.
The focus of the investigation presented here is a course in electromagnetic field theory at the Royal Institute of Technology (KTH) in Sweden that is mandatory for some bachelor programs in engineering. The course is divided into two parts, Electrostatics and Electrodynamics, and both parts are assessed by a written exam at the end of each part. After the examination event, the exams are grouped into their individual questions and sorted in ascending order based upon the family names of the students (i.e., students with initial letter “A” in the family names are on the top of the pile and family names with initial letter “Ö” (last letter in the Swedish alphabet) are at the bottom, see Figure 1). Observe, that in the not so unusual case of two students having family names that both start with the same letter, subsequent letters are also used for the sorting (e.g., “Anderssen” would be placed above “Andersson” in the piles).
This ordering is at the heart of the eventual bias investigated here, and if a bias exists and if the ordering was made differently the outcome could be different. Also, note that, even though the course has many participants, not all of them take the written exam at the same time. Thus, the number of examinees varies but is the largest at the regular examination event. (In the material studied here the average number of examinees was approximately 63, the maximum and minimum were 135 and 7, respectively).
Q. 1 Name: Andersson Q. 2 Name: Andersson Q. 5 Name: Andersson
…
In ascending order by the family names.One instance of a written exam.
Figure 1. Shown is what the students hand in for one examination with five individual questions (Q1, …, Q5). These questions are separated and sorted in ascending order by initial letters of the family names. To limit students being assessed differently on the same question each question is as-sessed by a single teacher only.
The procedure for assessing the individual questions is performed such as:
(1) Each individual question is handled by an individual teacher to assure that the complete assessment of a student’s exam is approximately evaluated in the same way for all students. This is to avoid the problem of different teachers having subtle, but different, attitudes toward different mistakes, which could create problems if teachers where assigned to assess a share of the exams (and not individual questions).
(2) The actual assessment is often made at the approximate same time and often in one sitting. Importantly however, the individual teachers might back-track and revise the assessment during the sitting to ensure fairness or correctness. The extent of this isn’t known but it is known to exist.
Discussions with teachers in the academic environment of the authors reveal that the general feeling is that the assessment method of written exams is a fair method to assess student per-formance, administratively and finically wise but that the assessment procedure is, in itself, fatiguing. The above described procedure is also utilized for other courses at KTH and is not uncommon at other universities that also handle courses with many participants and that uses a written exam at the end to assess student understanding. However, the rater effect could be a cause of biased assessment of the students.
The nature of the different questions/problems given in the exams is such that the solutions given by the students (correct in full, in part or erroneous) generate many pages in total. This, in combination with a, usually, large number of participants in the course, creates a substantial material to cover, even for assessing a single question in the exam. Combine this with the fact that all this material is often assessed in one singular sitting, it is not unrealistic to fear that after a while the assessing teachers becomes tired (rater fatigue (Grote, 1996) and the “internal assessing templates” within each rater starts to shift. An effect on the assessment due to rater fatigue has indeed been reported, e.g., in (McLaughlin, Ainslie, Coderre, Wright & Violato, 2009) (though with a small number of samples studied and the particular outcome is, thus, not statistically valid). It is important to note that the average time it takes a rater to assess a single sample of a question, in combination with the total number of exams to assess, will affect the rate fatigue. A question that takes a, relatively, long time to assess could lead to severe rater fatigue even if the total number of exams is not so large. Of course, this “time to assess” is highly dependent upon the competence of the rater and will not be constant over time (as rater fatigue in itself is a non-linear phenomenon with regards to time).
First, for ease, let us define X, which is an index number for all the family names of students taking part in an instance of a written exam. Thus, a low value on X means that the particular student has a family name with an initial letter from the beginning of the alphabet (most probably an “A”). The family name of the student who is on top of the pile (when it is sorted in ascending order with respect to the initial letter of the family name) is equivalent to X = 1.
The hypothesis that is investigated here in this paper is:
“The examination results of students with family names that have an initial let-ter from the lalet-ter part of the alphabet are biased in the assessment of the written exams, i.e., in general, given a lower or higher score than the average.”
(It is important to note that the study and method conducted below, and the results drawn thereof, could also be done if X would represent some other form of student identification and underlying ordering, e.g., an anonymous number or other identifier connected to a particular student.)
The possible underlying causes are twofold; 1) that a teacher becomes fatigued by the extensive material to evaluate and gloomy with the students’ performance and assess the results more harshly for high values of X or 2) that the teacher becomes fatigued and disregards to comment
on erroneous solutions given by students corresponding to high values of X. If we assume that the competences of the raters are static, the accuracy/inaccuracy is not affected with time. This assumption is based upon the experience of the teachers assessing the written exams but also that the timespan in which the assessments takes place is too short to affect this (i.e., teachers are not likely to learn or forget knowledge during the rating). Consequently, the hypothesis shows examples of dynamic rater effects with regard to harshness and leniency, respectively. The essential reason for the analysis is to see if the assessment procedure described above is applied equally to all students, regardless of X.
Finally, we make the important, but elementary, assumption that the understanding and performance of students are not measurably affected by their family names. However, this is barring phenomena such as stereotype vulnerability (Bain, 2004) that potentially causes the student to become explicitly aware of his/her stereotypical traits such as gender or ethnicity. This could affect student performance, both negatively and positively (Shih, Pittinsky & Ambady, 1999), however, it should not be a significant problem here as the test does not directly ask for identification of, e.g., gender or ethnicity. In the following sections the analysis method used to attempt to confirm, or disprove, the above stated hypothesis is described.
Nature of database and method of analysis
The basis for our investigation is data, on the above mentioned course, which was available in the form of student results on written exams given in the period between 2001 and 2012. This dataset consists of records for the results of exams given at 51 different dates (during 2001 - 2012). Out of these 51 collections, 40 also had specific data on the results for the individual questions that constitutes their respective exams. This subset of the data (i.e., the 40 exams) was used and comprised of 210 individual questions/problems (the exams had either five or six questions) and 2512 non-unique examinees took theses 40 exams. (“Non-unique” as students would be evaluated on both parts of the course but could also, in the case of a failing grade, retake the test a later time). Thus, this is a substantial dataset and the results, and conclusions, should be considered statistically valid. Naturally, for the time span of the database (2001 – 2012), several teachers have been involved in the assessment of the written exams but the assessment procedure mentioned above has remained fixed.
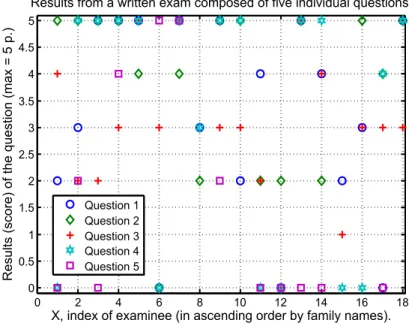
The method of analysis was as follows. In the Excel database the results of the exams (scores for each student for the individual questions) were in ascending order with respect to X. Then, for each exam, the results (score) of the questions are extracted with the help of Matlab (Matlab 2012) and plotted with respect to X. Figure 2 shows how the results from an exam might look. This particular exam had 5 questions and 18 students took the test. It is hard to see any particular trend in the distribution of the points with respect to X. Each question has been assessed by a single teacher. As stated above, the individual questions are sorted with respect to X (i.e., in ascending order of the initial letters of the family name).
Figure 2. The results from an actual exam with 5 questions and 18 examinees.
Seemingly random distributions of score, with respect to X, appear for each question and written exam. With the help of Matlab a linear fit, i.e., y = k∙X+m, is made of this data (see Figure 3 for an example) where y is the score given to the student for that particular question, k is the slope of the linear fit, X is the independent variable and m is the zero crossing of the y-axis (at X = 0).
0 2 4 6 8 10 12 14 16 18 0 0.5 1 1.5 2 2.5 3 3.5 4 4.5 5
X, index of examinee (in ascending order by family names).
Results (score) of the question (max = 5 p.)
Results from a written exam composed of five individual questions.
Question 1 Question 2 Question 3 Question 4 Question 5
Figure 3. To illustrate the different linear behaviors that can be seen, three questions (out of five), from an exam with 21 examinees, are extracted. The slope of the linear fit is an indicator of how
the examinees are assed as a function of X.
0 5 10 15 20 0 0.5 1 1.5 2 2.5 3 3.5 4 4.5 5
X, index of examinee (in ascending order by family names).
Results (score) of the question (max = 5 p.)
Three examples of linear fits.
Q 1 Q 2 Q 3 Linear 1 (k > 0) Linear 2 (k = 0) Linear 3 (k < 0)
Only a linear fit is made as we are only interested in the general behavior of the score as a function of X. (In addition, it is believed that a higher ordered function would only produce incorrect interpretations of the data as it is believed that no decisive relationship exist between the results and the particular family name of a student.) The slope, k, of each linear fit is an indicator of how the students are assessed with respect to X (i.e., the ordering). A negative slope indicates that students corresponding to a high value of X are disfavored in the assessment (lower score on the respective problem) and a positive slope indicates the opposite which is also unwanted. For a fair assessment and, thus, valid rejection of our above stated hypothesis, the slope should be close to zero (i.e., a horizontal line). This rejects the hypothesis of a dynamic rater effect of harshness/leniency and therefor the value and sign of k is an indicator of how the students are assessed (see “Discussion” for an elaboration on the subject).
results
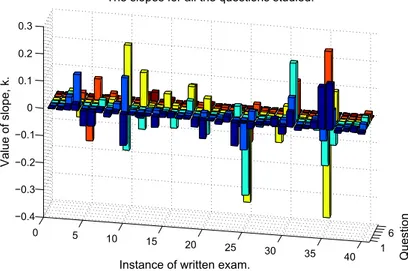
Figure 4 shows the values and sign of k for all the linear fits for the different questions and exams (i.e., 2512 non-unique examinees answering 210 questions distributed over the 40 instances of written exams). 1 6 0 5 10 15 20 25 30 35 40 −0.4 −0.3 −0.2 −0.1 0 0.1 0.2 0.3 Question
Instance of written exam.
The slopes for all the questions studied.
Value of slope, k.
Figure 4. Shown are all the slopes for all the linear fits. (Observe that, as some exams only had five questions, there are only 210 data entries (slopes) even though it seems that 240 (6*40) bars are plotted. These non-existent entries are not taken into account in the analysis, but are illusions and
a consequence of the plotting routine of Matlab.)
At a first visual inspection it seems that the amount of positive and negative slopes, in general, cancel each other. Nevertheless, if summing all the 210 values we find that the “total slope” has a fairly negative value, ktot ≈ -0.24, which would indicate that students with a high value X is, in general and over this timespan (2001 – 2012), disfavored in the assessment procedure!
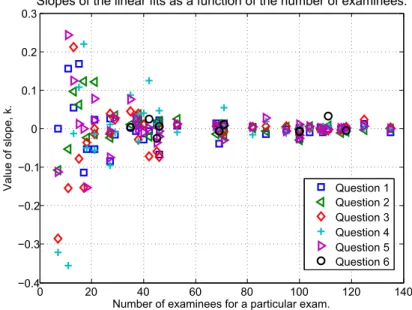
However, the original line of reasoning was that teachers developed rater fatigue when the material to assess was large, i.e., written exams with many students. If the slopes from Figure 4 are shown (ordered) as a function of the number of examinees for each exam it is clear that the value and sign of k fluctuates wildly for exams with a small number of examinees but approaches zero for those exams with many examinee’s (see Figure 5).
Figure 5. When the number of examinees increases, the slopes of the linear fits goes towards zero. Each data point corresponds to the slope of a linear fit of a question. I.e., each position on the x-axis, with entries along a vertical line, corresponds to an instance of a written exam (in total 40), having
five or six questions, with a certain number of examinees.
This result is encouraging as this is what would be expected if the evaluation of the students’ performance was, with respect to X, random! For an exam, with only a small number of exa-minees and, thus, data entries, the linear fits, are likely to have non-zero slopes. However, as the number of examinees increases, the amount of entries also increase and as the score is, as a function of X, random, the slopes approach zero.
This explanation was tested with the help of Matlab by artificially creating exams with dif-ferent number of “examinees” and, in which, the scores were drawn from a uniform distribu-tion, thus, giving random scores to each “student”. The results (see Figure 6) manage relatively accurately to reproduce the shape and behavior displayed in Figure 5, which, e.g., a Gaussian distribution of the scores (as a function of X and, thus, representing some form of skew in the assessment), could not.
0 20 40 60 80 100 120 140 −0.4 −0.3 −0.2 −0.1 0 0.1 0.2 0.3
Number of examinees for a particular exam.
Value of slope, k.
Slopes of the linear fits as a function of the number of examinees.
Question 1 Question 2 Question 3 Question 4 Question 5 Question 6
Figure 6. Shown are simulated instances of written exams all with six questions and a different number of “students” in each. The scores were drawn from a uniform distribution giving random results for each question and particular hypothetical student.
The randomness of the data (scores) was also verified with the help of the “runstest” routine in the statistics toolbox in Matlab (Mathworks 2012). It determines if data in a sequence come in a random order (i.e., if the items of the data are mutually independent) and is based on the Wald–Wolfowitz runs test (Wald & Wolfowitz, 1948).
discussion
In the available literature, biases, when assessing student performance, are predominantly studied in the context of gender, age, ethnicity or socioeconomic status. All of these are very important topics and it cannot be discarded that they could be confounding factors for our results here. For example, it has to be kept in mind that there could exist biases toward students with names that are traditionally tied to gender, age, ethnicity or socioeconomic status which could affect the teachers’ assessment of the written exams and, thus, the results of the analysis presented here, such that the investigated hypothesis is found to be true or false. Unfortunately this can-not be tested with the database available here as, even if we link the student names to gender, age, ethnicity and socioeconomic status this can only be compared to a score on the different questions. To confirm or discard any eventual bias we need to examine if equal response from different students leads to different assessments (scores). This is however not possible here as the original documents (i.e. the written exams) are not available to us.
Also, note that as the available database used here only contains, for each instance of a written exam, the scores that the students acquired for each question, it is impossible to investigate rater effects with more statistical models (e.g., (Wolf, 2004)). This, as such models, often assume the existence of the original data (i.e., the written exams themselves) from which an “accurate” or “correct” rating can be drawn. This is then compared against the performed assessment and this could be analyzed by investigating the error (residual) and the standard deviation (i.e., by
0 20 40 60 80 100 120 140 −0.4 −0.3 −0.2 −0.1 0 0.1 0.2 0.3
Number of "examinees" for a particular exam.
Value of slope, k.
using the original data). As this is not possible in our case we cannot completely rule out the case, however unlikely it is, of existing rater harshness/leniency, alone or in combination with, rater accuracy/inaccuracy that interact in such a way that the effect on the overall rating, and thus, k, is nullified, leading to a false rejection of our stated hypothesis. However, this is an interesting topic and could form the basis for future studies.
conclusion
In the material available here, there is no evidence of a consistent bias toward students with family names whose initial letter is placed late in the alphabet (high value on X) and, thus, the initially stated hypotheses is proven false. This means that a dynamic rater effect of harshness/ leniency is not measurably present in the procedure used here to assess the written exams (i.e., rater fatigue is not a problem in the assessment of the students’ performance). Importantly, it can also be explained in the light that the raters must significantly back-track in their original assessment to counter the here discussed rater effect.
In addition, as can clearly be seen from Figure 5 (and Figure 6), it is important to have a large sample size when performing the analysis. If exams with a low number of examinees are investigated, the stochastic properties of the score (as a function of X) will most probably express an erroneous positive or negative bias. (For example, the possible cause for the dynamic rater effect reported in (McLaughlin, Ainslie, Coderre, Wright & Violato, 2009) could be due to the fact that the sample size was only 14 students!)
All in all, it is here shown that the assessment procedure, described in the introduction, does not suffer from measurable (according to this method) rater affects due to rater fatigue (which might be due to the back-tracking of the raters). Thus, a straightforward method to investigate the existence of rater fatigue is shown.
författarpresentation
Dr. Daniel Månsson (MSc 2003, PhD 2008) is an associate professor, in Smart Electricity Grids - Power System Components with the school of Electrical Engineering at the Royal In-stitute of Technology (KTH). Current research interest includes optimization of energy storage systems as well as Electromagnetic Compatibility. He teaches courses in circuit analysis and electromagnetic compatibility.
Dr Martin Norgren (MSc-EE 1992, PhD 1997) is a professor in electromagnetic theory at the Royal Institute of Technology (KTH). His research interests are electromagnetic theory in ge-neral, with particular interest in guidance and scattering of electromagnetic waves. Dr Norgren has for more than 15 years been responsible teacher of several courses in electromagnetic theory, for bachelor-, master- and PhD-students.
references
Bain, K. (2004). What the Best College Teachers Do”, Cambridge, Harvard University Press.
Biggs, J. & Tang, C. (2007). Teaching for quality learning at university, New York, Open University Press. Bloom, B.S., Engelhart, M.D., Furst, E.J., Hill, W.H. & Krathwohl, D.R., 1956. Taxonomy of educational
objectives: the classification of educational goals; Handbook I: Cognitive Domain, New York, Longmans. Grote, D. (1996). The complete guide to performance appraisal, New York, AMACOM.
Israelski, E. W & Lenoble, J.S. (1982), Rater fatigue in job analysis surveys, Proceedings of the Human Factors Society – 26th Annual meeting.
Ling, G., Mollaun, P. & Xi, X., A study on the impact of fatigue on human raters when scoring speaking responses, Language Testing, 31(4), 479 –499.
Mathworks (2012). Retrieved from: http://www.mathworks.se/help/stats/runstest.html. Matlab (R2012b). Natick, Massachusetts, United States: The MathWorks, Inc.
McLaughlin, K., Ainslie, M., Coderre, S., Wright, B. & Violato, C. (2009). The effect of differential rater function over time (DRIFT) on objective structured clinical examination ratings, Medical Education, 43 (10), 989-992.
Shih, M., Pittinsky, T.L. & Ambady, N. (1999). Stereotype susceptibility: Identity salience and shifts in quantitative performance, Psychological Science, 10 (1), 80-83.
Wald, A. & Wolfowitz, J. (1948). Optimum Character of the Sequential Probability Ratio Test, Annals of Mathematical Statistics, 19 (3), 326-339.