Hydrology Days 2005
B宜。dification of Anaerobic Digestion Model No.
1
forAccumulation and Biomass Recycling Durmus Cesur
San Antonio River Authority, 100 East Guenther, San Antonio TX 78229 Maurice
L.
Albertson 1Civil Engineering Dep訂值1ent,Colorado State University, Fort Collins, CO 80523
Abstract. In this paper, modification of Anaerobic Digestion Model No. 1 (ADMl), developed by the International Water Association (IW A) Task Group, to accommodate effects of accumulation of waste in the digester is explained. The modification includes incorporation of a physically-based methodology to ADMl to account for an unsteady state. The methodology is used to estimate the decrease 扭 the operating volume and the increase in retention time consecutively due to biomass recycling in the reactor caused by the accumulation of particulate matter and operational variations. The methodology considers both the reduction in the operating volume, and the increase in retention time due to the accumulation, and accompanied biomass recycling. By the evaluation of The Modified Model outputs and comparison with the Original Model outputs, the methodology, developed in the research, is found to be necessa可 and suitable for simulation of the anaerobic digestion in a Colorado Pork anaerobic digester.
1. Introduction
The anaerobic digestion (AD) process includes series and parallel interrelated reactions. The organic waste goes through different biochemical processes as depolymerization, acidogenesis, acetogenesis, and methanogenesis and other than these, physico-chemical, thermal processes as well take place during the digestion. Many approaches have been developed for AD process modeling such as mass罔balance and knowledge models. Each of these models has their advantages and disadvantages. Their applicability is limited by time, expertise (i.e., knowledge of the process structure), and available data. Generic dynamic model development based on the process dynamics, application and extension of the models for different cases, such as different reactor types, environmental conditions, orga世c waste types, operating conditions for the AD process 缸eneeded (Chynoweth et al., 1998
;
Batstone et al., 2002b ).Anaerobic Digestion Model No. 1 (AD Ml) was developed by Batstone et al. (2002b )., is a generic dynamic model, which is based on the works of Siegrist et al. and other researchers The model includes the main relevant processes of AD to make it simple and widely applicable. The model is suitable for extension to specific C卸的 through its open structure and common nomenclature.
Cesur and Albertson
In this paper, the modification of ADMl by incorporating a physically-based methodology to account for accumulation in the reactor and accompanying biomass recycling has been explained. The modification allows estimation of both decrease in the reactor volume due to the solids accumulation and increase in retention time due to biomass recycling. The Modified Model successfully characterized the performance of a full-scale anaerobic reactor validating the necessity and applicability of the methodology developed.
2. The Anaerobic Digestion Model No. 1
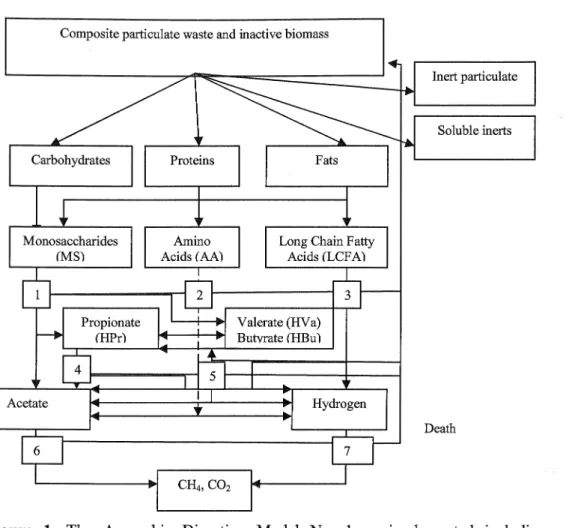
In ADMl, biochemical reactions, and physico-chemical reactions are modeled as number of sequential and parallel steps (Batstone et 泣, 2002b). The process and component inclusion in the model is determined considering the maximization of the applicability while maintaining a simple model structure. The model includes the three overall biological ( cellul缸) steps, (i.e. acidogenesis, acetogenesis and methanogenesis) as well as an extracellular disintegration (partly non-biological) and depolyrnerization step (Figure 1 ).
In the biochemical processes, available degradable (subs仕ate) and total input COD 缸eseparated, since a considerable 企actionof the input COD may not be anaerobically biodegradable (Masse and Droste 2000
;
Batstone et al. 2002b ). Physico-chemical conversions aside 企om the biochemical equations 前e included in the model to describe the physico-chemical state effects, such as effects of pH and gas concentration, on biochemical reactions. The overall process reactions including acid開base equilibriums 缸C given in Appendix A and nomenclature is given in Appendix B.In the Original Model, disintegration of homogeneous complex particulate waste first to carbohydrate, protein and lipid particulate substrate, as well as particulate and soluble inert material, is assumed. The disintegration occurs before the depolyrnerization, since the prim缸ysubstrate is represented by lumped kinetic and biodegradability p前ameters (Siegrist et al., 1993
;
Masse and Dros峙, 2000﹔ Batstone et al., 2002b;
Varon-Pena, 2002). The complex particulate waste pool is also used as a pre-lysis repository of decayed biomass. All biochemical extracellular steps are assumed to be first order, which is a simplification based on empiricism, reflecting the cumulative effect of a multi-step process 。在asse and Dros徊, 2000;
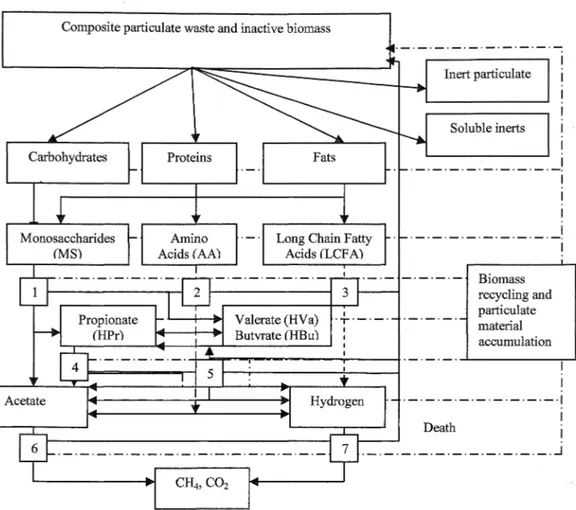
Batstone et al., 2002b ). Substrate uptake is chosen as a key rate equation to decouple the growth from uptake and to allow variable yields. The uptake is based on Monod-type kinetics. First order biomass decay was assumed.In the Modified Model, a methodology to account for solids accumulation and biomass recycling due to the accumulation is inco中orated into the Original Model. The schema of the Modified Model is given Figure
2.
The Original Model processes and relevant equations 前c briefly reviewed in the following paragraphs. Further details regarding the Original Model could be found in Batstone et al. (2002b ).
Modification of Anaerobic Diges玩onModel No. I for Accumulation and Biomass Recycling
Composite particulate waste and inactive biomass
In前t p訂ticulate Soluble in仗的 Monosaccharides (孔1S) Death CH4, CO2
Figure 1. The Anaerobic Digestion Model No. 1 as implemented including bioche血ical processes: 1. acidogenesis from sugars (MS); 2. acidogenesis 企om amino acids (AA); 3. acetogenesis 企om long chain fatty acids (LCF A); 4. acetogenesis from propionate; 5. acetogenesis from butyrate and valerate; 6. aceticlastic methanogenesis; and 7. hydrogenotrophic methanogenesis (Batstone, Torrijos, Ru妞, and Schmi祉, 2004).
Note: In the Original Model:
Digester volume changes (i.e., decrease) and biomass recycling are not considered in mass balance equations.
Cesur and Albertson
Composite particulate waste and inactive biomass
Carbohydrates Monosaccharides (MS) CH4, CO2 Valerate (HV a) Butvrate (HB的 Ine均articulate
I
j Soluble inerts D問th Biomass recycling and particulate material acα1mulation 7 l. 一。一-一-一一-一一----一一.」Figure 2. The Modified Model for Anaerobic Digestion as implemented, including biochemical processes: 1. acidogenesis 企om sugars (MS); 2. acidogenesis from amino acids (AA); 3. acetogenesis 企om long chain fatty acids (LCFA); 4. acetogenesis 企om propionate; 5. acetogenesis from butyrate and valerate; 6. aceticlastic methanogenesis; and 7. hydrogenotrophic methanogenesis.
Notes: In the Modified Model:
a. Digester volume changes (i.e., decrease in oper剖ing vol回ne) for each simulation period due to the accumulation of solids in the reactor. The decrease is calculated using the mass balance for fixed solids by the method proposed in the research based on settling theory.
b. Biomass is recycled due to the accumulation in the reactor. The effect of the biomass recycling has been included in the Modified Model using the increase in retention time, tr as a variable, calculated by a method proposed for the Modified Model. The mass balance for particulate components include this term in the Modified Model.
Modification of Anaerobic Dig,臼tionModel No. I for Accumulation and Biomass Recycling
The general mass balance equation neglecting the diffusional terms and interface 仕ansfer for completely stirred tank reactor (CSTR) is given below for liquid phase (Chynoweth and Pullammanappallil, 1996):
[
Accumulation of mass﹞=﹝Input﹞一﹝Output﹞+﹝Production﹞ (1)For each state component this equation can be written as (Batstone et al. 2002b):
dVS" J 一
一」己=qin sin,i - q outs Ii削 + V Li ρ川,j
dt j:,j (2)
Where:》凡,J is 伽 summation of 伽珈山 kinetic rates for
process j multiplied by rate coefficient, Vij- Assuming constant volume, q=qm=qout’,equation further be refined as:
dSu ; q;S;n ; q Su{/ ; γ
一一一一=一一一一一一一一一-一十
}
ρ ,v,'dt Vziq Vziq j立士1; j i,j (3)
, and forva叮ringretention time:
“女u; q;X;n; q Xu{/; 干 一一一-=一一一一一一一一一廿一+ pρ ,v, I dt V,, f Tin ;~一10 j j "'l tr,臼 X 十__'..'.'.!_ J ' " (4) q
Where: t何附= Retention time of solids components above hydraulic retention time used to simulate the separate solids retention.
Assuming constant reactor volume, and integrating the gas state variables into the system of dynamic state variables, the gas phase differential equations can be stated as follows:
dS E閣,i q莒血, SE由」‘ Vzi.
一一一=一 也寸巧,i...!!2._ t兮
dt E由
where Sg筒,I is the gas volume specific concentration variable, qgas is the overall dry gas flow (water co叮ected),V gasis the headspace volume, V liqis the bulk reactor volume, and ρTi= Liquid volume specific gas transfer rate, and i stands for one of the three gas components (i.e., carbon dioxide, hydrogen and methane).
The liquid”gas 仕ansferrate equation is given below:
ρT,i =kLα(Suq,; - Kn,;P一直由J (6)
where 肘, i is the specific mass transfer rate of gas i, kLa is the overall mass transfer coefficient, S Iiq,i is the concentration of gas component i in the bulk, KH, i is the Henry
’
s law coefficient for gas i, p 阱, i is the partial pressure of gas i in the headspace. To account for the COD basis of Siiq,i as compared to molar basis of KH is corrected by a factor of 16 and 64. Partial gas pressure, Pgas for each gas component is calculated using ideal gas law and corrected for water vapor.Cesur and Albertson
Six more state variables 缸erequired for DE solution to represent the acid-base equilibria (Rosen and Jeppson, 2002). Acid-base equilibrium equ剖ionis given below:
PA! B,i
=
kAI Bi(Sliq,i-<Ka,i+
SHJ-Ka,isliq,J (7)where p NB,i is the production rate of acid 企om the base, kNBi is the acid-base kinetic constant, Sliq, i is the to叫 concen個tion of 企ee form of an organic acid, dissolved carbon dioxide or 位nmo世.um, Sliq,卜, concen仕ation of ionic form, 81祠,H+ is the concen仕ationof hydrogen ions in 也ebulk, Ka,i 扭曲e
acid-base equilibrium coefficient. Free ammonia and hydrogen inhibition, pH inhibition and Ni仕ogen limitation 缸eassumed in the model.
3. Modifica組on Methodology for Accumulation in the Reactor and Biomass Recycling
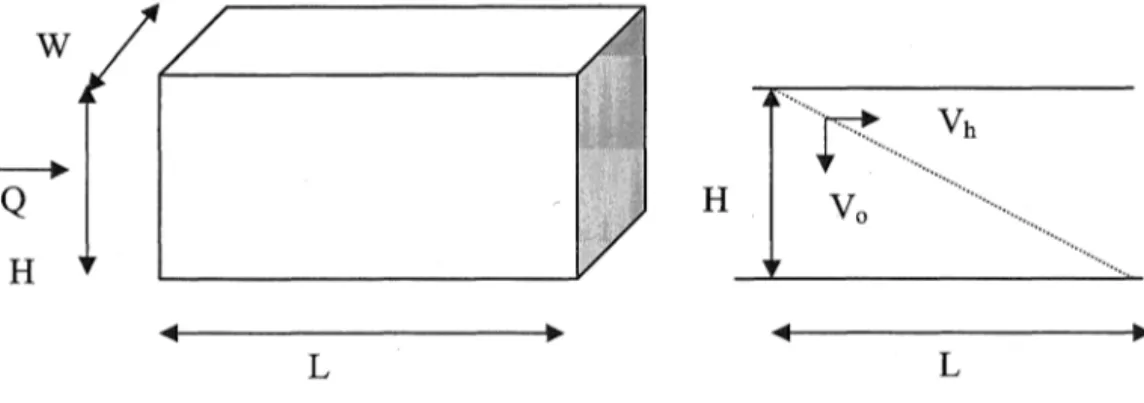
Increase in the solids retention time (SRT), and decrease in reactor volume due to accumulation and accompanying biomass recycling in the reactor could be estimated by determining vertical and horizontal components of the settling velocity. Procedure for the determination of velocity components and volume of the waste se叫“扭曲e tank is explained below. 百1e relevant settling schema is given in Figure 3. In 也e d前ivation of the settling methodology in the reactor, discrete p訂tides, equal dis甘ibution of flow in horizontal and v位tical directions, no turbulence in the reactor, movement of the particles horizontally at 也e s缸ne velocity as the organic waste 缸eassumed.
H
﹔尸!:凡
L L
Figure 3. Schematic of settling in the reactor
Assuming a particle whose terminal velocity, VO enters at the upper left comer of the tank. This particle is defined as a ’,critical particle" as any
other faster particle will be removed 企om 也e t位ikregardless of 也epoint of 凹的r:
HRT 一主 _ HLW一-
Q Q (8)
where HRT is the hydraulic retention time, H is the height of the reactor, L is 也e leng也 ofthe reactor, and W is the width of reactor
Modification of Anaerobic Dig臼tionModel No. I for Accumulation and Biomass Recycling
H L
HRT = 一一=一句
九九 (9)
where Vh is the horizontal component of velocity, V0 is the critical particle settling velocity.
, and solving V。:
Q
Y :一( 10)
。 As
where As is the surface area of the reactor.
The particle settling velocity may be computed 企om fluid mechanics equations. The downward mass flux due to sedimentation depended on the downward velocity of waste particles. The downward velocity resulted 企om
the net value of the buoyancy force ( assuming the density of the particle was different 企om that of water), the drag force (acting upward) and the weight ( acting downward).
Assuming steady state, drag, buoyancy and weight are related as:
dV
F﹔一凡一兀 = m 一一= 0 (11)
且 LJ " dt
where Fg is the weight of particle, F0 is the drag force, and Fn is the buoyancy force.
Considering a particle of waste material as a sphere, the drag force is a function of the particle Reynolds number, Rep , which is defined as:
_ dVsp1
q 一一一一 (12)
μ
where dp is the particle diameter, Vs is the fall velocity of the particle, p f is the fluid density, and µ is the fluid viscosity.
The drag force can be computed as:
九= ±C以2A
(13)where A is the projected 企ontal area of p訂ticle, Co is the drag coefficient that can be calculated 企omexperimental correlations.
The weight and buoyancy forces 缸e function of the size of the p缸ticle, the particle density, and the fluid density. Combining these into the force balance equation and solving for Vs:
V, -
g(ρp
- P1)d;
-
18µ (14)This equation can be generalized for the whole process by estimating
也e average settling velocity for the settling particles. The average settling velocity and sedimentation rate can be determined from the settling velocity by analyzing a control volume, CV, with the bottom surface in contact with the sludge layer. If the concentration of particles, C, is assumed to be
Cesur and Albertson
spatially uniform and the top boundary moved downward at Stokes velocity, the rate of particle accumulation could be found as (Fleming 2002):
SR = 主 11
ICdV=
I ICn.
V dA (15)δt
~tJ
ii
swhere SR is the sedimentation rate, dV = Change in the volume of the CV, n
the area of sludge under the CV.
Assuming the concentration within the CV is steady (C is a constant), the accumulation rate is:
dV
-SR=-C一:--
=
CAV. (I 的dt
A starting point for the average settling velocity (representative value for the settling particles),凡, can be taken 企om the literature values
(Knowl的, 1999). Particle settling velocities ranging between 0.02 mm/sand 0.5 mm/s for 5 µ m diameter quartz silt and for 200 口 m aggregates of the silt particles respectively are given in the literature (Knowles, 1999
;
Fleming, 2002). These values can be considered as an upper and lower bounds of 几. Change in volume of the reactor due to settling can be calculated as:昕一
一一一-= AV,
dt s ' (17)
The increase in retention time for each quarterly period,址, may be estimated as (Cesur 2004):
』一”一_ HRTt:./(]d'V;n,i _ HRTM (i)AV.
4切, λ 一- \JO)
q叫 (i+ l)liq q叫i(i+ 1)
Wh位e: HRT 庄t(i) = hydraulic retention time (i.e., number of days waste stays in the reactor with no recycling, this is equal to solid retention time, SRT) for a quarterly period over which AD process is steady. The initial estimate of settling and associated increase in retention time and decrease in rector operating volume can be calculated using mass balance of suspended solids, fixed solids, total phosphorous, copper and zinc for Colorado Pork reactor (Martin, 2003).
4. The Original Model Implementation and Parameter Estimation
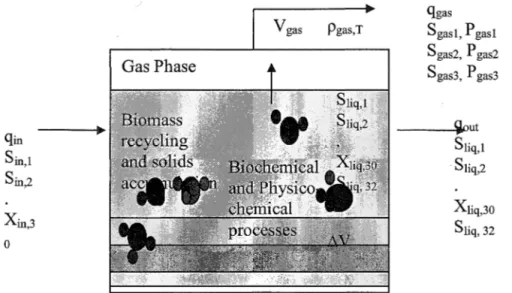
In the implementation of the ADMl, MATLAB and Simulink are used together with a package for optimization. In the first phase, the Original Model is implemented and the model parameters are estimated using the experimental data. In the second phase, the Original Model is modified for accumulation. The Modified Model is implemented as Dynamic Equation (DE) system since this implementation in MATLAB is less sensitive than the Dynamic and Algebraic Equation (DAE) system implementation. Single stage DE implementation schema is shown in Figure 4. There are 32 dynamic state variables, 19 biochemical process rates and 3 liquid-gas transfer
Modification of Anaerobic Digestion Model No. I for Accumulation and Biomass Recycling
processes in DE system. The DE system contains 6 more dynamic state variables due to the acid-base dissociation in the system. The Modified Model is applied for simulation of the anaerobic digestion process taking place at Colorado Pork, LLC, reactor.
q姐一一一一→ S血,I S血,2 X血,3 。 Vgas p阱,T Gas Phase qgas Sgasl, P gasl Sgas2, P gas2 Sgas3, P gas3 一一~ρut S1i也I Sliq,2 Xliq,30 S1i呵, 32
Figure 4. Schematic of a typical single tank reactor with solids accumulation and biomass recycling ( gin = flow into the reactor, m3 /day
;
qout=flow out of reactor, m3 /day;
qgas = gas flow, m3jday;
Pgas, T = Liquid-gas transfer rate, M/day;
V = volume (variable), m九 /J.V= change in volume;
sini = Concentration of liquid components, kgCOD/m3﹔ X垣 i = Concentration of particulate components, kgCOD/m3) (Modified from Batstone et al., 2002a)In the first phase, most of the kinetic parameters are assumed to be fixed due to their low variability (Batstone et al., 2002b ). Parameters with low sensitivity and variability were taken 企omthe literature (Batstone et al., 2002b ). Parameters with high variability and limited sensitivity were taken
企omthe research on similar processes (Masse et al., 1996
;
Masse et al. 1997;
Chynoweth et al., 1998a
;
Masse and Droste 1997;
Masse and Droste 2002). Physical parameters such as overall mass transfer coefficient, kLa or total gas pressure, PT in the headspace are set to a fixed value, since they are dependent on the reactor configuration used (Pauss et al., 1990). Stochiometric coefficients were also taken 企om the IW A task group report. Carbon and ni仕ogen contents were recalculated by implementing the balance terms in the rate equation matrix. Physicochemical parameters were taken from the report and other resources (Stumm and Morgan, 1996;
Batstone et泣, 2002b). The mass balance has been checked for COD, carbon and nitrogen contents using the Excel spreadsheet developed by Batstone et al. (2002b).
Parameters with high sensitivity and high variability 缸e estimated using experimental data of researchers and the nonlinear constrained optimization method was impl臼nented using MATLAB 6.5 optimization toolbox and the two-parameter optimizations around optimum using secant
Cesur αnd Albertson
method was implemented using Aquasim 2.ld version. (Masse et al., 1996
;
Masse et al., 1997;
Masse and Droste, 1997﹔孔fasse and Droste, 2002;
Siegrist et al. 2002). The initial values of the parameters to be estimated weretaken 企omthe scientific and the report of IW A task gro坤, researchof Masse and Dros妞, and Chynoweth et al. (Chynoweth et al., 1998a
;
Batstone et al., 2002b;
Masse et al. 1996;
Masse et al. 1997 a;
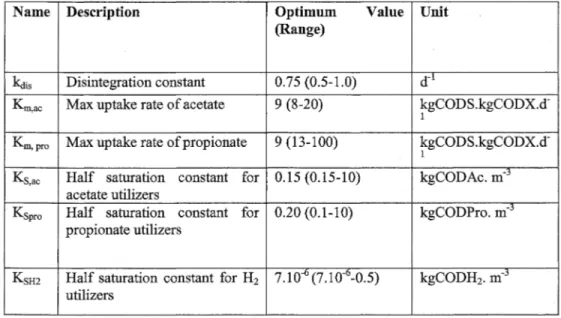
Masse and Dros峙, 1997b﹔ Masse and Dros妞, 2000). Estimation methods were applied for the disintegration constant, kdis,maximum uptake rates for acetate and propionate utilizers, km,a的 km,pro, half saturation constants for acetate, propion前e and hydrogen utilizers, Ks,ac, Ks,pro, Ks,由-In the estimation procedure, the disintegration constant was first estimated by matching the model output with measured outputs for biogas flow. Then the outputs for acetate and propion前e concentrations were changed by changing the half saturation constants and maximum uptake rates for the acetate and propionate degrading processes respectively. The Km, Ks p訂ameters for acetate and propionate utilizers were optimized together since they have the lowest correlation and the highest relevance (Batstone et 泣,
2003). The value ranges and optimum values for the p缸ameters 缸egiven in Table 2.
Table 2. Paτameter estimation results
Name Description Optimum Value Unit 恨ange)
kctis Disintegration constant 0.75 (0.5-1.0) 在1
Kmac Max uptake rate of acetate 9 (8-20) kgCODS.kgCODX.d-Km,pro Max uptake rate of propionate 9 (13-100) kgCODS.kgCODX.d-Ksac Half saturation constant for 0.15 (0.15-10) kgCODAc. m-j
acetate utilizers
Kspro Half saturation constant for 0.20 (0.1-10) kgCODPro. m-5
propionate utilizers
K呂H2 Half saturation constant for H2 7.10 6(7.10弋0.5) kgCODH2. m-3 utilizers
5. The Modified Model Implementation
Colorado Pork, LLC (CP), AD reactor data set was used to verify the Modified Model. The Modified Model output was compared with the measured data.
Colorado Pork, LLC, Anaerobic Digester is a mesophilic, intermittently mixed anaerobic digester used for swine manure stabilization and biogas production at Lamar, Colorado. The facility houses 5000 sow breed saws to weaner pigs. Manure 企om the facility has low ( deviation < 5
Modificαlion of Anaerobic Digestion Model No. I for Accumul,α:tion and Biomass Recycli,時
percent as percentage of averages) pH, CO2, and CH4 variability. The anaerobic digester is an in-ground concrete tank, 19.81 meters in width, 24.38 m~ters in length, and 4.27 meters in depth, and has a total volume of 2061.的
mj CVtotaI) operating volurp.e of 1892.59 m3 (Vliquid). This gives the volume of
headspace as 168.88 mj (Vgas). The digester is heated to maintain a
t自nperature of approximately 39 °C. The digester is operated as a fill and draw reactor on a 24-hour cycle with two 30 to 45 minute mixing episodes in one day. Influent flow throu的 the digester decreased over the 12 months of data collection 企om 64.35 m3 per day to 41.64 m3 per day and averaged 52.41 m3 per day (i.e., 6.07.10-4 m3/sec). Design hydraulic retention time was estimated to be 40 days (Mart妞, 2003). The AD system achieved 65.00 percent volatile solid (VS) reduction, 89.00 percent VFA reduction, 71.00 percent chemical oxygen demand (COD), 82.00 percent biochemical oxygen demand (BOD) reduction and 99.90 percent fecal coliform reduction.
Swine waste is characterized by little above the neutral pH,趾gh and sometimes toxic levels of ammonia, sigr吐血cant levels of volatile solids, COD, phosphorus, ortho-phosphorus, pathogens and coliform bacteria indicative of the fecal pollution (Chynoweth et al., 1998a
;
Chynoweth et al., 1998b).Sampling data collected for each of the reporting quarters approximately two-week time intervals at 26 sampling points during 364 days period between April 2000 and April 200l(Mattocks et 泣, 2002﹔
Martin, 2003). Gas samples were collected 企om gas line in the pipe chase and were sent for analysis. Standard analytical procedures were used for sample testing.
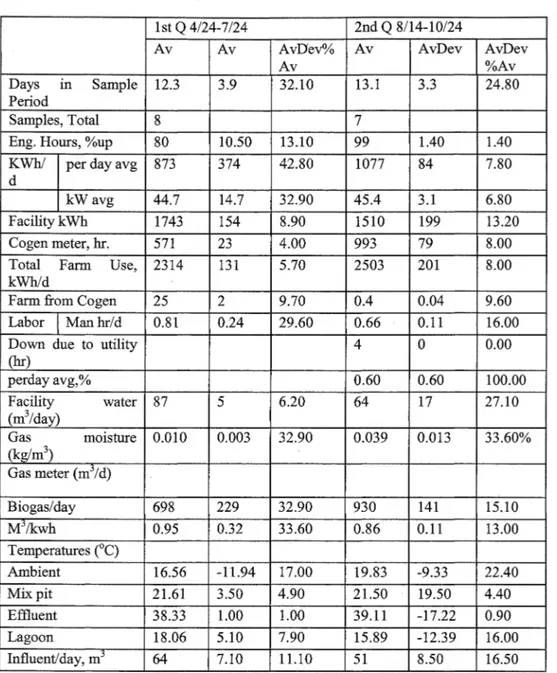
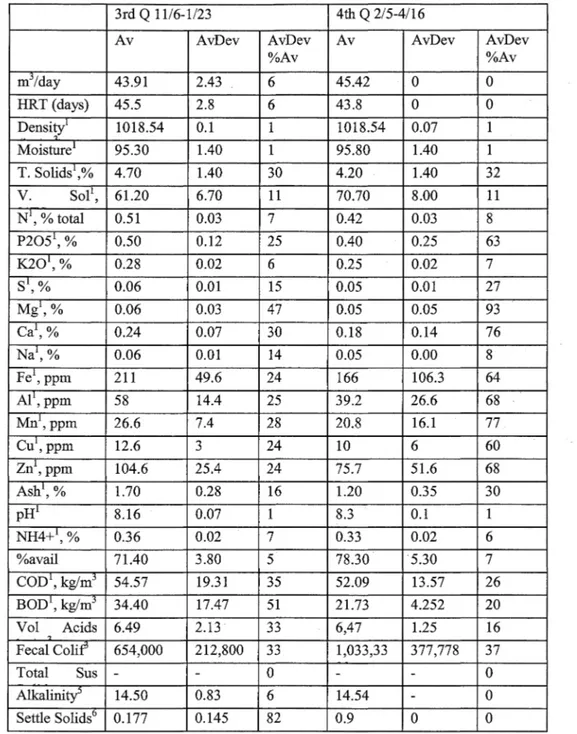
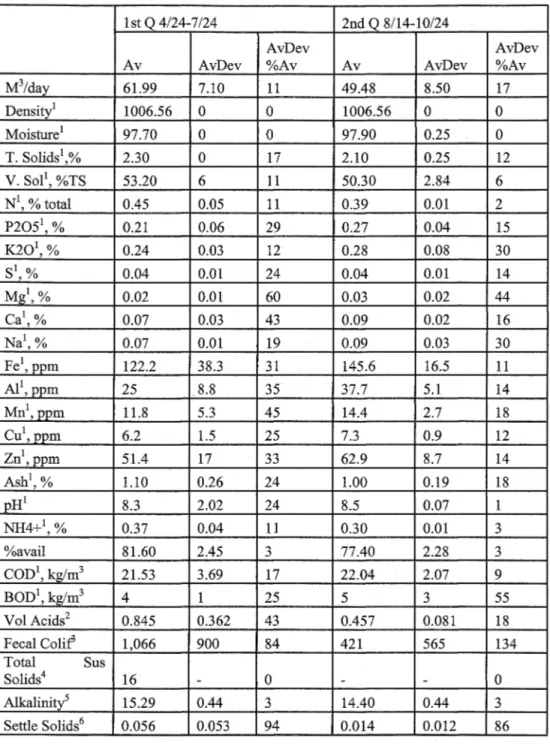
Daily manure and cogeneration system parameters were recorded. The daily data included gas metering, energy generation, temperature, flare activity and other operational measurements. Manure samples were collected at the influent collection and mixing tank ( digester influent),前 the effluent collection chamber ( digester effluent), and at the effluent storage struct叮C sequentially on the same day. The digestion system operation data is given in Table 3, influent constituent averages by quarter is given in Table 4, and effluent constituent averages 缸cgiven Table 5.
Cesur αnd Albertson
Table 3. Digestion system operation information (M前tocks et al. 2002). 1st Q 4/24-7 /24 2nd Q 8/14”10/24
Av Av AvDev% Av AvDev AvDev
Av %Av
Days 1ll Sample 12.3 3.9 32.10 13.1 3.3 24.80
Period
Samples, Total 8 7
Eng. Hours, %up 80 10.50 13.10 99 1.40 1.40
KWh/ per day avg 873 374 42.80 1077 84 7.80
d
kW avg 44.7 14.7 32.90 45.4 3.1 6.80
Facility kWh 1743 154 8.90 1510 199 13.20
Cogen meter, hr. 571 23 4.00 993 79 8.00
Total Farm Use, 2314 131 5.70 2503 201 8.00 kWh/d
Farm 企omCogen 25 2 9.70 0.4 0.04 9.60 Labor Manhr/d 0.81 0.24 29.60 0.66 0.11 16.00
Down due to utility 4
。
0.00(hr) perday avg,% 0.60 0.60 100.00
r~~~~:)
water 87 5 6.20 64 17 27.10 Gas moisture 0.010 0.003 32.90 0.039 0.013 33.60% (kg/m3) Gas meter (mj/d) Biogas/day 698 229 32.90 930 141 15.10 M,/kwh 0.95 0.32 33.60 0.86 0.11 13.00 Temperatures (0C) Ambient 16.56 ”11.94 17.00 19.83 -9.33 22.40 已1.ixpit 21.61 3.50 4.90 21.50 19.50 4.40 Effluent 38.33 1.00 1.00 39.11 -17.22 0.90 Lagoon 18.06 5.10 7.90 15.89 -12.39 16.00 Influent/d呵, m3 64 7.10 11.10 51 8.50 16.50 Notes: All on m ”的 delivered” basis: 1- on 啪”的 delivered"basis;
2 kglm3, 3-MPN悟, 4-kg/m3,5-kg CaC03/m3, 6-m3 /m3品r,Av= Average, AvDev: Average deviation, AvDev%Av: Average deviation percentage of Average
Modification of Anaerobic Digestion Model No. I for Accumulation and Biomass Re句1cling
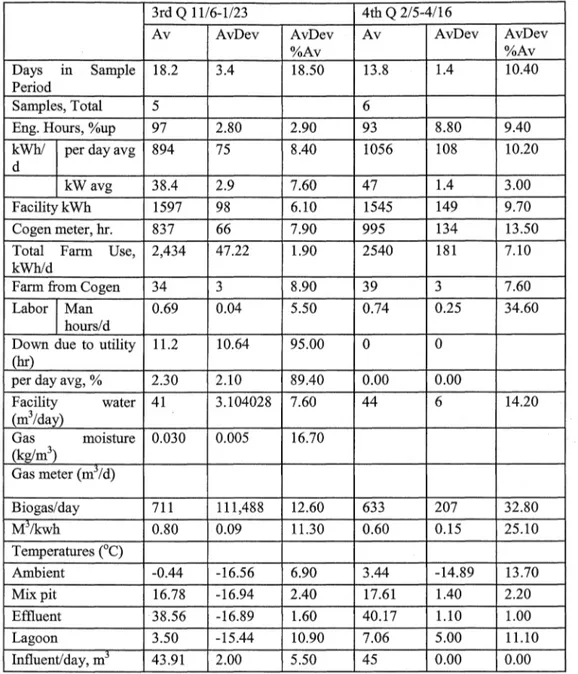
Table 3. Digestion system operation information (Continue句(Mattocks et al. 2002).
3rd Q 11/6-1/23 4位1Q 2/5-4/16
Av AvDev AvDev Av AvDev AvDev
%Av %Av
Days Ill Sample 18.2 3.4 18.50 13.8 1.4 10.40
Period
Samples, Total 5 6
Eng. Hours, %up 97 2.80 2.90 93 8.80 9.40
k"他l per day avg 894 75 8.40 1056 108 10.20
d
kW avg 38.4 2.9 7.60 47 1.4 3.00
Facility kWh 1597 98 6.10 1545 149 9.70
Cogen meter, hr. 837 66 7.90 995 134 13.50
Total Farm Use, 2,434 47.22 1.90 2540 181 7.10
kVi祖/d
Farm 企omCogen 34 3 8.90 39 3 7.60
Labor Man 0.69 0.04 5.50 0.74 0.25 34.60
hours/d
Down due to u世lity 11.2 10.64 95.00
。
。
曲。
per day avg, % 2.30 2.10 89.40 0.00 0.00
r~~~~:)
water 41 3.104028 7.60 44 6 14.20 Gas moisture 0.030 0.005 16.70 (kg/m3) Gas meter (mj/d) Biogas/day 711 111,488 12.60 633 207 32.80 Mj/kwh 0.80 0.09 11.30 0.60 0.15 25.10 Temperatures (。C) Ambient -0.44 -16.56 6.90 3.44 -14.89 13.70 Mix pit 16.78 -16.94 2.40 17.61 1.40 2.20 Effluent 38.56 ”16.89 1.60 40.17 1.10 1.00 Lagoon 3.50 ”15.44 10.90 7.06 5.00 11.10 Influent/cl呵, m3 43.91 2.00 5.50 45 0.00 0.00 Notes: All on 妞”as delivered" basis: 1-on 妞”as delivered" basis;
2 kg/m3,3-MPN悟, 4-kg/m3,5-kg CaC03/m3, 6-m3 /m3 /hr
Av
=
Average, A vDev: Average deviation, A vDev%A v: Average deviationpercentage of Av叮咚e
Cesur and Albertson
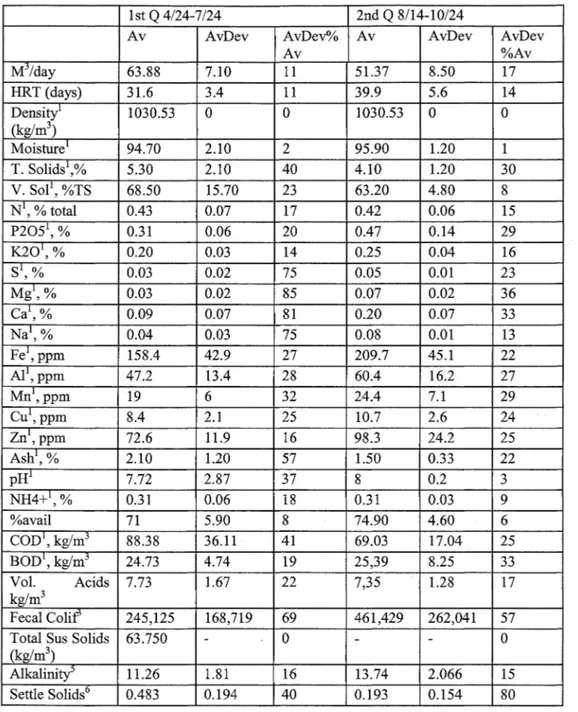
Table 4. Influent constituent averages by quarter (Mattocks et al. 2002).
1st Q 4/24刀/24 2nd Q 8/14-10/24
Av AvDev AvD巴v°/o Av AvDev AvDev
Av %Av 扎15/day 63.88 7.10 11 51.37 8.50 17 HRT (days) 31.6 3.4 11 39.9 5.6 14
~;:
~ l 1030.53。
。
1030.53。
。
Moisture1 94.70 2.10 2 95.90 1.20 T. Solids\% 5.30 2.10 40 4.10 1.20 30 V. Sol1, %TS 68.50 15.70 23 63.20 4.80 8 N1, % total 0.43 0.07 17 0.42 0.06 15 P20針,% 0.31 0.06 20 0.47 0.14 29 K201, % 0.20 0.03 14 0.25 0.04 16 S1, % 0.03 0.02 75 0.05 0.01 23 Mg1, % 0.03 0.02 85 0.07 0.02 36 Ca1, % 0.09 0.07 81 0.20 0.07 33 Na1, % 0.04 0.03 75 0.08 O.Ql 13 Fe1, ppm 158.4 42.9 27 209.7 45.1 22 AI1, ppm 47.2 13.4 28 60.4 16.2 27 Mn',ppm 19 6 32 24.4 7.1 29 Cu',ppm 8.4 2.1 25 10.7 2.6 24 Zn1,ppm 72.6 11.9 16 98.3 24.2 25 Ash',% 2.10 1.20 57 1.50 0.33 22 pH' 7.72 2.87 37 8 0.2 3 NH4抖,% 0.31 0.06 18 0.31 0.03 9 %avail 71 5.90 8 74.90 4.60 6 COD', kg/mj 88.38 36.11 41 69.03 17.04 25 BOD1, kg/m3 24.73 4.74 19 25,39 8.25 33 Vol. Acids 7.73 1.67 22 7,35 1.28 17 kg/m3 Fecal Colif3 245,125 168,719 69 461,429 262,041 57Total Sus Solids 63.750
。
。
(kg/m3)
Alkalinity" 11.26 1.81 16 13.74 2.066 15
Settle Solids6 0.483 0.194 40 0.193 0.154 80
Notes: All on 妞”的 delivered" basis: 1- on an ”的 delivered" basis
;
2 k!!i'm3,3-MPN/g. 4回kg/m3, 5-kg CaC03/m3, 6-m3/m3品r
Av
=
Average, A vDev: Average deviation, A vDev%A v: Average deviation percentage of AverageModification of Anαerobic Digestion Model No. 1 for Accumulation αnd Biomass Recycling
Table 4. Influent constituent averages by quarter (Continued) (Mattocks et al. 2002).
3rd Q 11/6-1/23 4位1Q 2/5-4/16
Av AvDev AvDev Av AvDev AvDev
%Av %Av mj/day 43.91 2.43 6 45.42
。
。
HRT (days) 45.5 2.8 6 43.8。
。
Density' 1018.54 0.1 1018.54 0.07 1 扎foisture1 95.30 1.40 95.80 1.40 T. Solids1 4.70 1.40 30 4.20 1.40 32 V. Sol 1, 61.20 6.70 11 70.70 8.00 11 N1, % total 0.51 0.03 7 0.42 0.03 8 P2051, % 0.50 0.12 25 0.40 0.25 63 K201, % 0.28 0.02 6 0.25 0.02 7 S1, % 0.06 0.01 15 0.05 0.01 27 Mg',% 0.06 0.03 47 0.05 0.05 93 Ca1, % 0.24 0.07 30 0.18 0.14 76 Na1, % 0.06 0.01 14 0.05 0.00 8 Fe', ppm 211 49.6 24 166 106.3 64 Al',ppm 58 14.4 25 39.2 26.6 68 Mn1,ppm 26.6 7.4 28 20.8 16.1 77 Cu1,ppm 12.6 3 24 10 6 60 Zn1,ppm 104.6 25.4 24 75.7 51.6 68 Ash1, % 1.70 0.28 16 1.20 0.35 30 pH1 8.16 0.07 8.3 0.1 1 NH4抖,% 0.36 0.02 7 0.33 0.02 6 %avail 71.40 3.80 5 78.30 5.30 7 COD1, kg/mj 54.57 19.31 35 52.09 13.57 26 BOD1, kg/m3 34.40 17.47 51 21.73 4.252 20 Vol Acids 6.49 2.13 33 6,47 1.25 16 ’, Fecal Colif 654,000 212,800 33 1,033,33 377,778 37 Total Sus。
。
Alkah也ty5 14.50 0.83 6 14.54。
Settle SolidsD 0.177 0.145 82 0.9。
。
Notes: All on 妞”的 delivered" basis: 1- on an ”as delivered" basis
;
2 k!l/m3 3-MPN/g. 4-kg/m3, 5-kg CaC03/m3爪,m3/m3品rAv = Average, A vDev: Average deviation, A vDev%A v: Average deviation percentage of Average
Cesur and Albertson
Table 5. Effluent constituent averages by quarter (Mattocks et al. 2002). 1st Q 4/24-7 /24 2nd Q 8/14-10/24
AvDev AvDev
Av AvDev %Av Av AvDev %Av
M3/day 61.99 7.10 11 49.48 8.50 17 Density1 1006.56
。
。
1006.56。
。
Moisture1 97.70。
。
97.90 0.25。
T. Solids1 2.30。
17 2.10 0.25 12 V. Sol1, %TS 53.20 6 11 50.30 2.84 6 N1, % total 0.45 0.05 11 0.39 0.01 2 P2051, % 0.21 0.06 29 0.27 0.04 15 K201,% 0.24 0.03 12 0.28 0.08 30 si, % 0.04 0.01 24 0.04 0.01 14 M又1,% 0.02 0.01 60 0.03 0.02 44 Ca1, % 0.07 0.03 43 0.09 0.02 16 Na1, % 0.07 0.01 19 0.09 0.03 30 Fe1, ppm 122.2 38.3 31 145.6 16.5 11 A11, ppm 25 8.8 35 37.7 5.1 14 Mn1,ppm 11.8 5.3 45 14.4 2.7 18 Cu1,PPm 6.2 1.5 25 7.3 0.9 12 Zn1, ppm 51.4 17 33 62.9 8.7 14 Ash1, % 1.10 0.26 24 1.00 0.19 18 pH1 8.3 2.02 24 8.5 0.07 NH4+1, % 0.37 0.04 11 0.30 0.01 3 %avail 81.60 2.45 3 77.40 2.28 3 COD1, kg/m3 21.53 3.69 17 22.04 2.07 9 BOD1, kg/m3 4 25 5 3 55 Vol Acids2 0.845 0.362 43 0.457 0.081 18 Fecal Coli:f 1,066 900 84 421 565 134 Total Sus Solids4 16。
。
Alkalinity5 15.29 0.44 3 14.40 0.44 3 Settle Solids6 0.056 0.053 94 0.014 0.012 86Notes: All on 妞”的 delivered"basis: 1- on an ”的 delivered" basis
;
2- kg/m3, 3-MPN悟, 4-kg/m3,5”kg CaC03/m3, 6- m3 /m3品rAv= Average, AvDev: Average deviation, AvDev%Av: Average deviation percentage of Average
Mod;伊cationof Anaerobic Digestion Model No. 1 for Accumulation and Biomass Recycling
Table 5. Effluent constituent av前ages by quarter (Continued)加1attocks et
al. 2002)
3rd Q 11/6-1/23 4th Q 2/5-4/16
AvDev AvDev
Av AvDev %Avg Av AvDev %Av
h在3/day 42.02 2.42 6 43.53
。
。
Density 1006.56 1.19。
1006.56 8.38 1 Moisture1 97.90% 0.08。
98.00% 0.28。
T. Solids1,% 2.10 0.08 4 2.00 0.28 14 V. So11, %TS 52.90 3.13 6 55.90 2.18 4 N1, % total 0.42 0.02 4 0.44 0.02 3 P2051, % 0.21 0.05 25 0.23 0.06 26 K201, % 0.24 0.02 7 0.27 0.00 1 si, % 0.03 O.Ql 14 0.04 0.00。
Mg1,% 0.01 0.01 63 0.02 0.02 109 Ca1,% 0.07 0.02 28 0.08 0.02 31 Na1, % 0.07 O.Ql 7 0.06 0.00。
Fe1, ppm 117.2 25.8 22 124.7 26.2 21 A11, ppm 27 7.6 28 25.5 7 27 Mn1, Porn 9.8 3 30 10.7 3.9 36 Cu1, oom 7.2 1.8 26 7.3 1.8 24 Zn1’。,om 52.2 11.4 22 55.3 9.8 18 Ash1,% 1.00 0.10 10 0.90 0.16 18 pH1 8.5 0.14 2 8.5 0.16 2 NH4抖,% 0.34 0.02 6 0.37 0.02 5 %avail 80.50 1.20 84.50 5.02 6 COD1,kg/m3 17.59 1.91 11 18.87 2.55 14 BOD1, kg/m3 7 2 24 4 0.535 14 Vo1Acids2 0.461 0.116 25 1 100 Fecal Colif' 71 83 118 407 664 163 Total Sus. Solids4 .。
.。
Alkali凶d 14.92 0.691 5 ”。
Settle Solids6 0.056 0.051 91 .。
Notes: All on 妞”的 delivered"basis: 1-on 妞”as delivered" basis﹔ 2團 kglm3, 3-MPN/g. 4咽kg!m3,5-kg CaC03/m3, 6-m3 /m3 /hr
Av = Average, A vDev: Average deviation, A vDev%A v: Average deviation p位·centageof Average
Cesur and Albertson
6. Results and Discussion
The Modified Model validation is conducted by considering four separate periods due to the distinct variation in the process in these periods (indicated by variation in HRT, influent flow rates). The characterization of model input is based on feed analysis which was performed during the sampling period. The characteristic percentages for the in宜uent constituents were given in Table 6. Constituent percentages were determined using the feed sludge characteristics given in Mattocks et al. (2002), and representative values given in Masse et al. (1996), Masse et al. (1997b), Chynoweth et al. (1998b), and Batstone et al. (2003). Volatile fatty acids 缸e split into acetate, propionate, butyrate and valerate components. Simulations were carried out using the original model as well to compare the original model outputs with the Modified Model outputs (Table 7, Figure 5).
Table 6. Characteristic influent constituents
M建jorConstituents Percentage(%)
Inert p紅ticulate 54.00
Particulate carbohydrate 28.00
Volatile Acids 16.00
Acetic Acid (% of Volatile Acid) 50.00 Butyric Acid(% of Volatile Acid) 20.00 Propionic Acid(% ofVolatile Acid) 23.00 Valeric Acid(% of Volatile Acid) 7.00
Ammonia 0.30
Others 1.70
The comparison of the measured, the Modified Model and the Original Model simulated biogas production data shows that the model represents the digestion process quite weH (Table 7, Figure 5). The absolute
C叮or of the Modified Model was 83 m-' /day, the relative e虹or was 10.34 percent, the RMSE was 29.77 m3/day, coefficient of variation was 0.040, and the correlation coefficient was 0.66. The original model absolute e訂or was 109.49 m3/day, relative e訂or was 15.60 percent, RMSE was 41.23 m3/day, and the coefficient of variation was 0.055. This clearly indicates the simulations with the Modified Model yield better estimates of biogas production than the original model (Table 7, Figure 5). The discrepancies observed could be attributed to the changes in waste characteristics between periods, characterization e叮ors (i.e., eηors in proportioning the waste
Modlficαtion of Anαerobic Digestion Model No. I for Acα{mulation and Biomαss Recycling
constituents) due to the lack of data on waste stream before the sampling period, changes in operating conditions, and model representation limitations.
Additional旬, at the beginning of the sampling period digester operation appears to be less stable than the later periods.
The variation in biogas is due to the vaηring influent waste characteristics and operating conditions. Biogas generated by the digester had a stable gas composition of 66 percent methane, 32 percent carbon dioxide, 0.6 percent oxygen and 1.5 percent nitrogen. However, the model predictions of biogas composition are found not to be very accurate because of the limitations of defining the alkalinity levels in particular.
In the research, the modeling of the farm (agricultural) anaerobic covered t位1k type anaerobic reactor using the Modified Model is accomplished successfully. The modification offers a unique approach for the further generalization of the anaerobic digestion model for unsteady-state operation of the reactor.
The Modified Model simulated the biogas production at Colorado Pork reactor with very small e叮or which clearly indicates good simulation considering the complexity of the modeling of the 臼11-scale anaerobic digestion process. The model is found to be limited in prediction of pH (i.e., model predictions of pH were lower than the observed values), VF A and biogas composition. Model predictions of pH are found to be lower than 也e measured values, possibly due to the difficulty in representing the alkalinity of the waste stream and the limitation of the model in predicting the volatile fatty acids degradation.
Table 7. Comparison of the measured, Original and Modified Model simulated biogas production
Biogas measured Biogas simulated the Original IBiogas simulated the Months (m3/day) Model (m3/day) !Modified Model (m3/day)
608.72 f499.22 524.22 2 706.12 633.20 663.10 3 779.16 640.35 675.48 4 936.56 640.28 675.84 5 942.19 831.92 867.13 6 911.25 895.16 930.54 7 787.08 895.16 912.64 8 708.38 561.79 835.36 9 637.54 389.55 672.09 10 651.90 538.81 630.78 11 623.55 607.47 637.34 12 623.55 607.47 637.12
Cesur and Albertson 1050.00 950.00 言「 850.00 ’苟 ,..
~
750.00茍a~
650.00。閻呵。
IXI 550.00 E 重 450.00 350.00 。 磁 5 10 15Months since April 2000
十
EG
副mMW
門uoa恥M
as呵。
sua惜叫u
oeJyh 一母費也一 Biagas simulated (m3/day) • V 會 V• Biagas simulated l\tbdified l\tbdel (m3/day)
Figure 5. Comparison of measured and the original model simulated biogas produc世on
7. Conclusions
The AD process modeling using ADMl is successfully modified and implemented to account for unsteady state operation which is generally the case for full-scale reactors by the developed methodology. The model implementation is the first modification and implementation of the ADMl model for agricultural waste (i.e., piggery waste), and for the anaerobic covered tank type reactor with an unsteady state operation.
A physically-based methodology was developed (i.e., derived using settling theory) and inc。中orated into the model to account for the effects of accumulation on the anaerobic digestion process with solids accumulation. The developed methodology computes both the increase in retention time due to the recycling of the biomass and the loss of operating volume simultaneously. The comp訂ative results of the Original Model and the Modified Model given in Table 7, and Figure 5, prove the suitability and the necessity of the modification of the model for simulation of the Colorado Pork anaerobic digester.
Acknowledgments
The authors would like to express their appreciation to Dr. Damien J. Batstone of The Technical University of Denmark, Department of Environment and Resources and Dr. Ulf J eppsson and Dr. Christian Rosen of Department of Industrial Engineering and Automation of Lund University for their support of the research and provision of the original model code.
Modification of Anαerobic Digestion Model No. I for Accumulation αndBiomαss Recycling
References
Batstone, D.J., Keller, J., Angelida姐, I., Kalyuzhn抖, S.V., Pavlostathis, S.G., Rozzi, A., Sanders,引人T.1伍, Siegri哎, H., Vavilin, V.A. , 2002a.
“
The IW A Anaerobic Digestion Model No 1 (ADMl)”,Water Science & Technology v. 45 n. 10 p. 65-73.Batstone, D. J., Keller, J., Angelidaki, I., Kalyu油n抖, S. V., Pavlosta也函, S. 丘, Rozzi, A., Sanders, W. T. M叮 Siegrist,H., and Vavilin, V. A., 2002b. Anaerobic Digestion Model No. 1 (ADMI), IWA Task Group for Mathematical Modelling of Anaerobic Digestion Processes. IW A Publishing, London.
Batstone D. J., To訂討os, M., Ruiz C., Schmidt, J. 且, 2004. Use of Anaerobic Sequencing Batch Reactor for Parameter Optimization in Anaerobic Digestion. In Hall, S.J., Fux, C., and Keller, J. (Ed) 3時 IWA Specialized Conference on Sequencing Batch Reactor Technology: SBR3, 2乞26February 2004, Noosa, Queensland, Australia, 293-300. Cesur,且, 2004. “Extension of Anaerobic Digestion Model No. 1 and Its Implementation”,
Ph. D. Dissertation, Department of Civil Engineering, Colorado State Universi句, Fort
Collins, CO.
Chynoweth, D. P., Pullammanappallil, P., 1996. Anaerobic digestion of municipal solid waste. In Microbiology of solid waste (ed. A. Palmisano and M. A. Barlaz), p. 71-113. CRC Press, Boca Raton, Florida.
Chynoweth, D.P., Wilke, A.C., Owens, J.M., 1998a.
“
Anaerobic processing of piggery wastes: A review”, ASAE Paper 984101, paper presented at the 1998 ASAE Meeting, Orlando, FL.Chynoweth, D.P., Wilke, A.C., Owens, J.M可 1998b. “Anaerobic treatment of piggery slurries”, paper presented at the special symposium
”
Management of Feed Resources and Animal Waste for Sustainable Animal Production in the Asia干acific Region Beyond 2000, Seoul, Korea. June/July 1998.Fleming, J. G., 2002. Novel Simulation of Anaerobic Digestion Using Computational Fluid Dynamics. Doctoral dissertation, University of North Carolina at Chapel Hill, Chapel Hill, NC.
Knowles, S. J., 1999. Aggregation and settling of fine-grained ans suspended sediment. Ph. D. Dissertation, University of North Carolina at Chapel Hill, Chapel Hill, NC.
Masse,旦, Patni N. 足, Droste R, L., Kennedy K. J., 1996. Operation strategies for psychrophilic anaerobic digestion of swine manure slurry in sequencing batch reactors. Canadian Journal of Civil Engineering, 23, 1285-1294.
Masse,缸, Patni N. 瓦, DrosteR, L., Kennedy K. J., Mu虹oe,J. A., 1997a. Potential for the psychrophilic anaerobic treatment of swine manure using a sequencing batch reactor. Canadian Journal of Agricultural Engineering, 39(1), 25-33.
Masse D., Drost巴, R.I., 1997b. Microbial interaction during the anaerobic 仕eatmentof swine manure slurry in a sequencing batch reactor. Canadian Journal of Agricultural
E時inee血g,39(1), 35-41.
Masse, D. I., Dros侃, R.L., 2000.
“
Comprehensive Model of Anaerobic Digestion of Swine Manure Slurry in a Sequencing Batch Reactor”,Water Research, v. 34, n. 12, p. 3087-3106.Mattocks,氏, G. Swanson, Torres, M., 2002. Monitoring the Performance of a Commercial Housed Swine Operation Biogas System. Final report sub虹rittedto the Sate of Colorado Governor's Office of Energy Management and Conservation, Denver, Colorado.
M訂tin 1 日可 2003.An Assessment of the performance of the Colorado Pork, LLC. anaerobic digestion and biogas utilization system (Report submitted to Ed Lewis, State of Colorado Governor's Office of Energy Management and Conservation), Denver, Colorado.
Noyko珊, N., Muller, T. 丘, Gyllenberg, M叮 T卸rmer, J., 2002.
“
Quantitative Analyses of Anaerobic Wastewater Treatment Processes: Identifiability and Parameter Estimation”, Biotechnology and Bioengineering v. 78, n. 1 p. 89-103.Pauss, A., Andre G., Peηier, M., Guiot, S. R., 1990. Liquid-to-gas mass transfer 也 anaerobic
processes: inevitable transfer limitations of methane and hydrogen in the biomethanation process. Applied and Environmental Microbiology, 56(6), 1636司 1644.
Cesur αnd Albertson
Sebastian, Spain.
Siegrist, H叮 Renggli,D., G吋er,\\人, 1993.”MathematicalModeling of Anaerobic Mesophilic Sewage Sludge Treatn凹的”, WaterScience Technology, v. 27, n. 2, p. 25”36.
Simeonov, I., Momchev,以, Grancharov, D., 1996.
“
Dynamic Modeling of Mesophilic Anaerobic Digestion of Animal Waste”,Water Research, v. 30, n. 5, p. 1087司 1094.Stumm,引人, Morgan, J. J., 1996.Anaerobic Chemistry: Chemical equilibria and rates in Natural Water (3'd Edition), John Wiley and Sons, New York, N. Y.
Varon-Pena, M., 2002. Advanced Prima可 Treatment of Domestic Wastewater in Tropical
Coun甘ies: Development of High-Rate Anaerobic Ponds”,Ph.D. Thesis, The University of Leeds, School of Civil Engineering, Leeds, U.K.
Mod.研cationof Anaerobic Digestion Model No. I for Accumulation and Biomass Recycling
Appendix A. The Modified Model Differential Equation System Process rates
Biochemical process rates P1
=
ka;s·Xc P2 =k帆,ch·xch p3=
khyd,pr·xpr P4=
khyd,li.xliρs
=
km.,,,. Ssu X,,,.I, , 叫叫 Kssu +S跡 。“ Jρ而=
km,11•S個
xnn.16
υ 山,, u Ks aa + Sa,α U“ V S,,_ P1=
km 仇﹒戶 X .17 , w , _ u K+
s
JU , S,fa fa S品 S Ps=
km 何4• 戶 xd. 間 I只J 山,叮 Ksc4 + Sva 叮 Shu+Sva + le 。
s
p9 =丸,c4' va xc4· n n 間, fι Ksc4 +Svas
ρ10=
km nr. pro X nrn .]1 n av 帥,1'' KS,pra+
Sp叩門 M P11 =kmnr· Sac Xnrn.11, 日圳,心 Ksac+
Sac y山 u P12=
km h2· Sh2 Xnro.112 間,叫 Ksh2 + Sh2 1' '"· p13=
kd,配,Xsu·xsu P14=
ka.缸,Xaa•X翩 ρ15=
kd,缸,研 .Xfa ρ16=
ka.缸,Xc4.Xc4 p17=
kd,配均ro·Xp,o Pis= ka,配,Xac·Xac ρ19=
kdec,Xh2.xh2 Acid-base rates 仇,4=
kA,Bva(Sva 一 (K仰α + SHJ 一 K仰ρA,5 =丸,B叭sva 一 (Ka,bu +SH+)-Ka,bu"sbu)
(1) (2) (3) (4) (5) (6) (7) (8) (9) (10) (11) (12) (13) (14) (15) (16) (17) (18) (19) (20) (21)
Cesur and Albertson
ρA’6
=
kA均,ro(S pro 一 (K吭pro +SH+) 一 Ka,pr, Spro ρA,7=
kA’BαSαC 一 (Kaca+ S H+)-Ka,ac'SaJρA,10 =丸,BC02(SHC03 一 (Ka,C02 +SH+)-Ka,c02·S1c) ρA,11
=
kA,BIN(SNH3 一 (KaIN+ SH+)-Ka,IN'SIN)(22) (23) (24) (25)
Gas transfer rates (Note 也atSco2 is used in expression for Pr,io not Src)
Pr,s
=
kLα(Sh2 一 l6KH,h2Pg.帥,h2) (26)舟,9
=
kLa(Sch4 -64KH,ch4Pgas,,ch4) (27)舟,10 =丸α(Sco2- KH,co2Pgas’,co2) Process inhibition
Inhibition: 15,8 = IpH,aa﹒ I肘, lim I2= IpH,aa I肘, Jim I妞, fa Is, 9 = IpH, aa I肘, JimIh2, c4
110= IpH’的 I肘, lim I凹, pro I11= IpH, ac I肘, Jim I曲3 I12= IpH,也 I肘, lim
I即"---=一一」
叭,心 l +Ks IN/ SIN], 而 r=
l"~,,~
1+
sh2 I KI h2 fa I,~,=一_!
叫一 l+Sh2IKih2c4 (28) (29) (30) (31) (32) (33) (34) pH<pH• 此, α (35) pH>pH缸,aa pH< pHULac (36) pH> pHUL,ac pH <pHUL,h,-空 (37) pH>pH凹,h2 (38) (39) (40)Modi.fie.α:tion of Anaerobic Digestion 班ode!No. I for Acα'.lmulation αnd Biomass Recycling .一 句2,pro一立志﹔/KI,h2,pro
I□啥=
1…
1 + snh3 I KI nh3 , and pH= -log1。 (SHJWater phase equations
Dif:D位entialequations 44-4 7, soluble matter:
dS q1
..:..:.:::.E!..=一旦(兒叫一丸)+Pi+ (l-f1a,li)p4 - Ps
dt Vziq
dS q1
~--1!...(S帥,in - Saa)+ P3 -
A
dt Vziq
dS n
-....:!!:!..= 且(Sfa,in -Sfa) +此,uP4 - P1 dt 向'iq
dS q.
--=..!'!!..= 21!!.. (丸,in -Sva)+(l 一九)J,,a,aaP6- Ps
dt Vziq
Differential equations 48-51, soluble matter dSz q.
一且也」ι(Sbu,in - Sva)
+
(l-Ysu)hu,suPs+
(l 一九 )fz切,aaP6- P9dt p
;
'iqdS___ n
t」~(S叫一 spro)+ (1 一丸)恥,凹的+(1- Yaa )恥,aaP6 一
(1-Yc4 )0.54pg - Pio (41) (42) (43) (44) (45) (46) (47) (48) (49) d只 q.
一之一c:::::--1!!...(Sac,in -Sac)+ (1- Ysu)fac,suPs + (1-Y詞)丸,aaP6 一(1-YrJ0.7p7 dt vliq
+ (1-Yc4)0.31內刊1-Yc4 )0.8p9 + (1- Ypro )0.57 Pio - Pu
(50)
dS1< q.
~一且(Sh2,姐一 Sh2)+ (1-Ysu)fh2,闊的+(1-Y鴿)fh2,線內一(1- Yra )。.3p7 + dt vliq
(1-Yra )0.3 lp7 + (1- Yc4 )0.15內+(1- Yc4)0.2p9 + (1- Ysu)0.43P10 -p12 -PT,8 (51)
Differential equations 詔”衍, soluble matt位: dS h4 q
--.:.E!!.」一些!....(Sch4,in - Sch4)
+
(1 一 ζJP11+
(1 一瓦a)P12 - Pr’9 (52)Cesur and Albertson Ft fr 、 1Illi -- J / 們 vti
c
-4寸勾引
/ Ill --lt \ 的寸中州 + 惘, L eu - c cuj /’‘、、也一九
九一-
d
(53) d只曰· q.一一=一且(SIN.in 一句)+ Ys)'九的+(Ndt V1旬, ac aa -Y Nbc)P6-YfaNbacP1-aa Yc4NbacPs -Yc4NbacP9 -YproNbacP10 -Yc4NbacP11-Yh2NbacP12 +
19
(Nbac -Nxc) LPi +(Nxc-fxI,xcNI 一屯,那NI -fpr,xcN aa )ρl
i=13 dSI q. 一一~2.E!....(Sr in - Sr)+
J
;
I n,n dt 向iq , •"' ,」,叩 (54) (55)The sum of equation 53 is computed as:
tC
_fu~
;
V11P1)
三
ts,P,
+心叫叫咱7 叫叫+月9
(56) Where: S1=一CXC + h1,xccsI + j﹔仰ccch+ JP巾ccpr +兀i, S2=一Cch +C且, (58) S3 =一Cpr+Cαα (59)S4
=
-cli +(1- f1a,li)Csu + f1a,licfa (60) 再 =-CSU+ (1 一九 )(hu,suc加+ fpro,sucpro + fac,sucac) +九Cb.αc(61) 先= -Caa + (1 一九 )(J丸,叫cva+ hu,aac的 + j戶,aacpro + lac,aacac) +九Chae (62)
S7 =-C《+ (1 一九 )0.7Cac + YfaCbac (63)
先 =-CVα +(1-r;,4 )。.54Cpra + (1-r';,4)0.3 lCac + r';,4Cbac (64)
內 =-Chu+(l-r';,4)0.8Cac + r';,4Cbac (65) S10
=
-Cpro + (l 一九 )0.57Cac+ yprocbαc (66)811
=
-Cac + (1-r:ic)Cch4 + ζccb缸(67)812
=
(1 一瓦JCch4+ Y,,2Cbac (68)Modificαtion of Anaerobic Digestion Model No. 1 for Accumulation αndBiomαss Recycling
Differential equations 70刁3particulate matter:
dX0 (Xc,in -XJ ι 一」-
=
-p1 + J ,P; dt v;;n I'7:t
」:三 + t附 1-, qin dXch 一 (Xch,in -Xch) ./' +J hρ1-P2 dt v;in J cn,xc l 」:三 + t附 qin dX pr (X pr,in - X p,) ' L' + f pr,xcPl 一 ρ3 dt v;in J J之+tres qindXu 一 (Xli,in - Xu) , r
一一一一 + fu,xcPi - p4
dt v;in J lz
」二:,_+ tres qin
Differential equations 7 4-77, particulate matter:
dX (X"' in - X.J 一」主=帥,,n OU + y Ps - p13 dt v;in SU ) 」二:,_
+
t,es q的 dX翩 (Xr,r,jn -XnJ 一一一= 圳 S uu +Y cA-P14 dtY
• J立 + t附 qin笠主=(丸,in-X戶)
+
Yraρ7
-pl5 dt v;in Ja J二三+ tres qin dX 1 (Xc4 in - X fa) __:_.£:!._ =凹,山 川+ ~4Ps + ~4p9 一月6 dt v;in J之 + t附 qinDifferential equations 78-81, particulate matter:
dX vro (X nro in - X vro)
____£立= 叭,師 們+丸叩門。 - pl7 dt v;in J之 + t附 qin dXaa (X配 in -XaJ 一一一= uc,m uc + ζcP11 - Pis dt v;in 」:三+tres qin 汀,內 (Xh空的 - Xh2) 一」l:....
=
'"'··"'
""'
+ YuP12 - P19 dt v;in 」之+tres qin (70) (71) (72) (73) (74) (75) (76) (77) (78) (79) (80)Cesur αnd Albertson
dXr 一 (XI,in -XI) , .r _
dt - VNn ' J xl,xcf/1
」2-
+
tresqin
Difu位entialequations 82 -豹, cationsand anions:
dS 斗 n _____sg£_ =主主'-(S + -S +) dt R勾訓,m dS _ a. ______!!!!:__ =之丘。- - s ) dt
Vziq
Differential equations m 圓鉤, ionstates:
dS _
f=-PA,4
dS bu - 一月 dt - f-/A,5 dS pro 一月 dt - f-/A,6 dS _ ac _ /、 dt ’ A, dShco3 一月 dt - f-/A,10 dSnh3 _ 月 dt - f-/A,11 Algebraic equation:同
1 -2 + θ - 2 H CU Sac Spr Shu Svα θ =s-_,'
+ S..u' - s 一, 一一一一一一一一一一一一一一一一- s□ ,uiT "''"'T n w r 64 112 160 208 un-snh4=
SIN -Snh3 snh4=
SIC - shco3Gas phase equations: For hydrogen: dS臨.h2 q /!ass帥,h2
v/ia
J于= - - T-::- ’斗 Pr,s -;-;ι 一 . Eαs 白 皂由 For methane: dS . _,_ .α.. S戶_,_, Vi_ 一弓千=一□:‘ J 斗 ρT,9~ι ar V __ V g血 巨由 (81) (82) (83) (84) (85) (86) (87) (88) (89) (90) (91) (92) (93) (94) (95)Modification of Anaerobic Digestion Model No. 1 for Accumulation and Biomass Recycling \-oat --/ AU T P +
-
n門-
M 何一耶- 院- yz +(叫他川
+句 2 -K O --- -c 一﹒ ψ 一﹒ ηEd -- o - REP - Tc -MT1 - ro 一月均
sz
-
yzu
。-
MNR -VR
-
1
可-
w
mb - M 叫叫的- y rd ←開 mv 伊一一 n = SESSE -伽 加 2 一=一一一一- P 缸叩門- UMd = zs - JII 《。 UY ‘, E - G 吭吭吭 m hmd 一扎扎丸。刊 (96) (97) (98) (99) (100)Cesur and Albertson
Appendix B. Nomenclature
Symbol Description
Ci Carbon content of component i, kmole C/kg COD Ni Ni仕ogencontent of component i, kmole N/kg COD
Vij Rate coefficients for component i on process j, kg C0D/m3
F仰du吼叫臨.te Yield (catabolism only) of product in substrate, kg COD/kg COD Ysubstrate Yield of biomass on substrate, kg COD/kg COD
Hgas Gas law constant (equal to KH-1), bar/M Ka,acl Acid-base equilibrium constant, M=kmole/ m3 Ktt He世y's law coefficient, M/b訂
R Gas law constant (8.314x10勻, bar.M-1K1 pH -loglO[H+],(2)
Pgas,i P訂tialpressure of gas i, bar KAfBi Acid-base 區netic cons個瓜, d-1
h郎,血id First order decay rate, d-1 I恤bitor.,側目S Inhibition function
k:i,roce由 First order constant, normally for hydrolysis, d-1 kLa Gas-liquid transfer coe伍cient,d-1
峙,姐姐bit,甜bs恤te 50% 旭hibitory concen仕ation, kgCOD/m3
km,process Monod maximum specific uptake rate, kgCOD S/kgCODX-1d-1
丸, proc間 Half saturation cons個品, kgCODS/mj 的 Generalized rate of process j
Symbol Description
pKa -loglO﹝凡﹞
KAfBi Acid-base kinetic constant, d-1
h缸,臨d First order decay rate, d-1 I岫b帥, process Inhibition 臼nction,
k:i,ro臨S First order constant, normally for d-1hydrolysis, kLa Gas-liquid transfer coefficient, d-1
K1, 恤ibit,凹h個扭 50% 訟趾bitory concen仕ation, kgCOD/mj km,process Maximum uptake rate, kgCOD S.kgCOD X-1.d-1 K色,F回臨 Half saturation constant, kgCOD S/mj
Pj Generalized rate of process j