Peak Streamflows of the Animas River at Durango, Colorado
Robert T Milhous1Hydrologist, Torries Peak Analysis Fort Collins, Colorado 80526
Abstract. The Animas River is a tributary of the San Juan River located in Southwestern
Colorado. The watershed is on the south-facing slopes of the San Juan Mountains. The annual peak streamflows analyzed in this paper are either the maximum annual instantaneous streamflows or the maximum annual daily streamflows. The annual instantaneous streamflows for the period of record (1908-2009) were analyzed using the log-Pearson Type III distribution. The maximum streamflow between 1908 and 2009 occurred in the fall (25,000 cfs on 5 October 1911) and was found to be 50% larger than the calculated one in two hundred year peak streamflow (16,700 cfs). The second highest peak streamflow in the 102-year series was 20,000 cfs and occurred on 29 June 1927. This snow-melt flood exceeded the 1 in 200 year annual peak streamflow by 20%. The daily streamflow data was used to determine the maximum daily steam flow in the snow-melt period (1 November - 15 July) and during the fall (16 July - 31 October). The median snow-melt maximum daily streamflows was 4350 cfs and was significantly larger than the median fall maximum daily streamflow of 1420 cfs. As with the peak streamflows, the largest fall annual maximum daily streamflows exceeded the maximum snow-melt streamflows. The probable cause of the larger fall streamflows is the atmospheric conditions associated with the North American Monsoon. The infrequent fall floods may be more important from a stream ecology and riparian vegetation viewpoint than the more frequent, but smaller, snow-melt floods.
1. Introduction
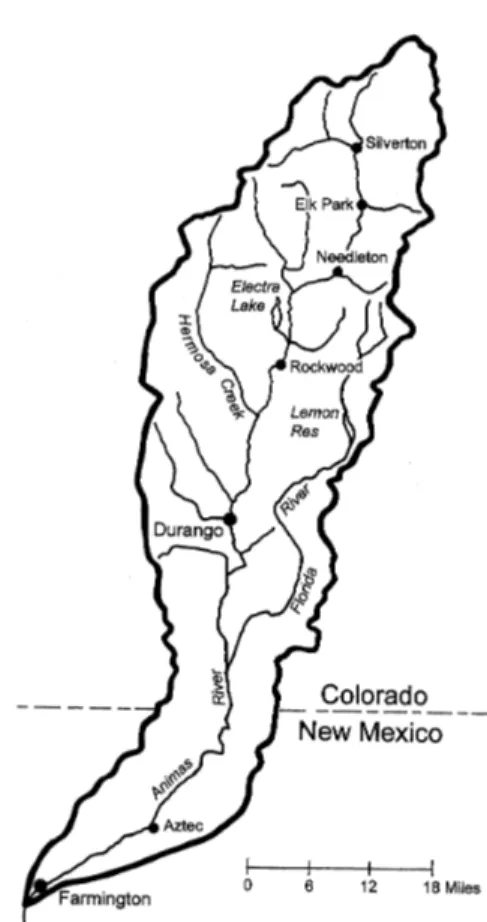
The Animas River is a tributary of the San Juan River in Southwestern Colorado. The watershed is on the south-facing slopes of the San Juan Mountains. A map of the
watershed is presented in Figure 1
An investigation of the environmental impacts of historical mining in the Silverton Caldera and adjacent volcanic areas has been accomplished by the U.S Geological Survey (Church et al, 2007). The Silverton Caldera is most of the upper part of the Animas River watershed. If sediment with metal contamination has been deposited in the stream
sediments a question is: How often are the sediments below the armored surface moved down the river to the plains and plateaus below? This paper does not answer the question about sediment - the paper does address the frequency of high flows in the Animas River by investigating the annual and seasonal peak flows measured at the USGS gage on the Animas River at Durango, Colorado. Seasonal peak flows are addressed because there may be differences in the environmental impact of peak flows during the snow-melt season and peak flows in the fall, and because looking at seasonal relations gives aditional insight into the geophysical processes in the watershed.
The annual peak discharge is the maximum instantaneous discharge in a year. In the USGS records the year is a water year from 1 October thru 30 September but in this paper
1 Hydrologist. Torries Peak Analysis. 1812 Marlborough Court
Fort Collins, Colorado USA
the year used is from 1 November thru 31 October (see a following section for the reason). Some of the peak annual discharges in the USGS annual peak discharge files are actually maximum daily discharges.
Figure 1. Map of the Animas River Watershed in Southwestern Colorado. The watershed area at Durango is 692 square miles and at Farmington, 1360 square miles. The USGS gage at Durango is located at latitude 37°17’, longitude 107°52’ in La Plata County, Colorado.
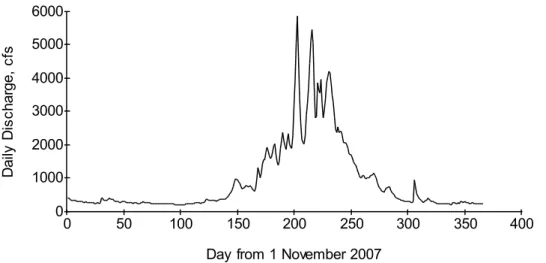
The daily discharges between 1 November 2007 and 31 October 2008 are presented in Figure 2. In general the maximum daily discharges are caused by spring snow-melt with multiple peaks (during spring runoff in 2008 the maximum daily discharge was 5950 cfs on 21 May). The minimum discharges occur during the winter (in 2008 this was 201 cfs on 7 February). A feature of streamflows in the Animas watershed is the potential for significant streamflows between 15 August and 15 October – the record maximum
discharge was 25,000 cfs on 5 October 1911. During 2008 there was a moderate high flow during late summer and fall period with a maximum daily discharge of 955 cfs on 01 September. The average discharge from 1 November 2007 thru 31 October 2008 was 929 cfs compared to a period of record average of 817 cfs.
As described above, there are two seasons of peak streamflows in the Animas River - the snow-melt season and the fall season. The actual measured snow-melt peak flows have all been between 10 May and 29 June. In this paper the snow-melt season is from 1
November thru 15 July and the fall season from 16 July thru 31 October. The maximum daily discharge will be the seasonal peak discharge analyzed. The time series of annual maximum (peak) discharges at Durango, Colorado will also be analysed.
0 1000 2000 3000 4000 5000 6000 0 50 100 150 200 250 300 350 400 Da ily Di sc ha rg e, c fs
Day from 1 November 2007
Figure 2. Daily discharge in the Animas River at Durango, Colorado between 1 November 2007 and 31 October 2008. The average discharge for the period was 929 cfs compared to a record average of 817 cfs.
The time series of annual peak discharges of the Animas River at Durango is presented in Figure 3. These data were downloaded from the USGS National Water Information System (NWIS). The annual peak discharges are the maximum discharge during a year on 1 November and ending on 31 October. The maximum discharge for the period of record was 25,000 cfs on 5 October 1911 with a second highest annual peak of 20,000 cfs on 29 June 1927. The period of record is water years 1898, 1900, 1909, 1911, and 1913-2009. According to the La Plata County Building Department (2011) the first recorded flood occurred in 1874, a year after first settlement, and a September flood occurred in 1896.
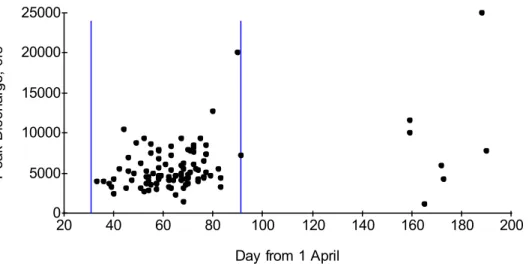
A diagram showing the day of the peak discharge in a year beginning on 1 April is presented as Figure 4 as a relation between the annual peak discharge and the day of the peak. There are two populations on the diagram. The first is the snow-melt peaks between 1 May and 30 June and the second is the fall peaks with the earliest on 6 September and the latest on 7 October. The October peaks are related to the hydrological and
atmospherics conditions the previous summer. Because of the October peaks, the year used in the analysis presented herein is from 1 November to 31 October. The summer
hydrological and atmospherics conditions of importance in the fall are related to the North American Monsoon, the topic of the next section.
0 5000 10000 15000 20000 25000 1898 1908 1918 1928 1938 1948 1958 1968 1978 1988 1998 2008 Pe ak D is ch ar ge , cf s
Year starting 1 November
Figure 3. Annual series of maximum annual (peak) discharge in a year beginning with 1 November. Data for 1899, 1901-1908, 1910 and 1912 are missing.
0 5000 10000 15000 20000 25000 20 40 60 80 100 120 140 160 180 200 Pe ak D is ch ar ge , cf s
Day from 1 April
Figure 4. Annual peak discharge versus the day of the peak discharge in the year beginning on 1 April (day 1). The period of record is water years 1898, 1900, 1909, 1911, and 1913-2009. The left vertical line is for 1 May (day 31) and the right line, 30 June (day 91).
2. The North American Monsoon
The North American Monsoon is also known as the Southwest Monsoon, the Mexican Monsoon, and the Arizona Monsoon. The monsoon is a significant increase in rainfall from a dry June to a rainy July over large areas of the southwestern United States and northwestern Mexico centered over the Sierra Madre Occidental in the Mexican states of Sinaloa, Durango, Sonora and Chihuahua, and extending northward into Arizona, New Mexico and Colorado (Adams, 2004). Winter precipitation is produced by large-scale surface low pressure systems that move across the Southwest, drawing in moisture from the Pacific Ocean and producing widespread rain and snow. The mid-latitude jet stream retreats to the north during the summer and the subtropical jet stream is replaced by a large high pressure system anchored over the eastern Pacific Ocean. The mechanism that
produces summer precipitation is not associated with large-scale jet streams or strong low pressure systems, but from convective thunderstorms that arise through the combination of solar heating and moisture. Sunshine and solar heating are plentiful during the spring and summer, but moisture levels adequate for thunderstorm development are not always present. A subtle change in circulation patterns during the summer opens up a flow of moisture from the south that dramatically increases convective thunderstorm activity. That subtle change in circulation patterns is the North American Monsoon (from Crimmins, 2006). These summer rains typically last until mid-September when a drier regime is reestablished over the region.
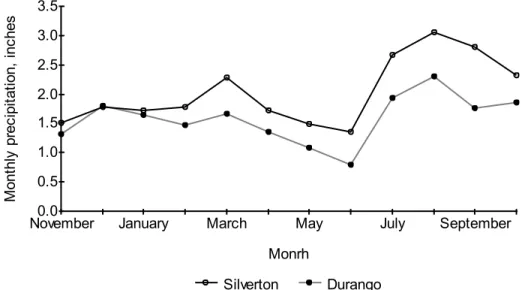
The monthly precipitation for Silverton in the upper Animas watershed and for Durango is presented in Figure 5 The figure shows the increase in the beginning in July and the lowest precipitation in June.
0.0 0.5 1.0 1.5 2.0 2.5 3.0 3.5
November January March May July September
Mo nt hl y pr ec ip ita tio n, in ch es Monrh Silverton Durango
Figure 5. Average monthly precipitation at two stations in the Animas River watershed. The period of record for the Silverton measurements is 3/1/1899 to 7/31/2010, and for Durango 10/1/1894 to 3/31/1991.
Two of the fall peak storms measured at Durango appear on a list of Arizona Hurricanes (NOAA, 2011); these two are the fall peaks in 1927 and 1970. The 1970 events was a major storm in Arizona. According to Corbisiero (2003) the most likely time for tropical cyclone rainfall in the southwest United States is during the month of
September with the large scale atmospheric flow pattern necessary to turn the storms northward is much more likely at the end of the tropical cyclone season in the eastern Pacific, as the atmosphere transitions to a fall pattern in the North Hemisphere.
3. Record extension
The record of peak flows and maximum daily streamflows was extended, and holes in the data filled, to give a complete record for 1908-2009 for the annual maximum, and 1908-2010 for the maximum daily discharges for the snow-melt and fall periods. The missing period in the daily data file downloaded from the NWIS (National Water
Information System) are shown below:
1 Nov 16 July 17 July – 31 October
Snow-melt Fall
1908 – 1912 1908 – 1912
1926 – 1927 1925 – 1927
Maximum peak discharges for snow-melt period of 1926 and 1927 and the fall of 1927 are available in Patterson, 1966. A relation between the ratio of the maximum daily discharge to the maximum annual (peak) discharge in the Animas River at Durango was determined. The average ratio for snow-melt peaks is 0.90 with a range of 0.96 to 0.82. The fall
rainfall peak tests to be much sharper which results in an average ration of 0.79 and a range of 0.91 thru 0.67. There is not a relation between peak discharges and the ratios. The average ratio was used to calculate the maximum daily discharge from the peak discharge for 1926 and a ratio of 0.95 for both the snow-melt and fall of 1927 because the available information suggests the period of the high flows was probably relatively long.
Information in USGS Water-Supply Paper 1313 indicates daily discharge values should be available for the Durango gage but none has been found in either the USGS Water-Supply Papers or in the USGS NWIS system. Monthly values are available in WSP 1313. The maximum discharge in the fall of 1926 is less than 4000 cfs. The ratio of the maximum fall discharge (227 cfs on 16 July) to the July monthly discharge (183 cfs) in Hermosa Creek (USGS 09361000) was used to calculate the maximum fall discharge at Durango from the monthly discharge of 1100 cfs. The result is a poor quality estimate of the 1926 maximum fall discharge of 1360 cfs.
The snow-melt maximum daily discharges for 1908 - 1912 were estimated using the measured discharges on the Animas River at Aztec, New Mexico as was the fall discharges for 1908 and 1912. The relation between the streamflows at Aztec and at Durango was determined. The average ratio is 0.87 with a range of 1.00 to 0.8. The average ratio was used in the transformation of the Aztec measurements to estimates of the streamflows at Durango. There are diversions between the two gages.
4. The Snow-melt and Fall Maximum Daily Streamflows
The snow-melt and fall maximum daily streamflows describe in the record extension section were added to the data obtained from the USGS daily values streamflow record. The annual time series of the snow-melt maximum daily streamflows is presented in Figure 6 and the fall maximum daily streamflows in Figure 7. It should be noted the largest of the snow-melt maximum daily streamflows was in 1926 and the second largest of the fall maximum daily streamflows also in 1926.
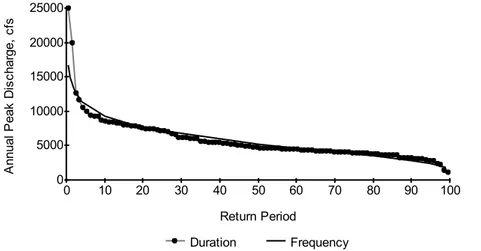
5. Duration and Frequency Analysis
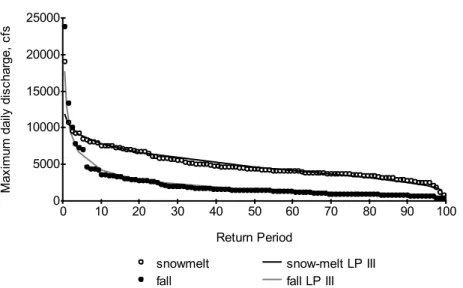
An analyses of all three time series was made using the log-Pearson Type III distribution. The results of the analysis of the annual peak discharge time series is in Figure 8 and of both maximum daily streamflows (snow-melt and fall) in Figure 9. The results are summarized in Table 1.
0 5000 10000 15000 20000 25000 1908 1918 1928 1938 1948 1958 1968 1978 1988 1998 2008 Ma xi mu m da ily d is ch ar ge , cf s
Year (1 November - 31 October)
Figure 6. Annual maximum daily streamflow during snow-melt (1 November - 16 July).
0 5000 10000 15000 20000 25000 1908 1918 1928 1938 1948 1958 1968 1978 1988 1998 2008 Ma xi mu m da ily d is ch ar ge , cf s
Year (1 November - 31 October)
Figure 7. Annual maximum daily streamflow during fall (16 July - 31 October).
0 5000 10000 15000 20000 25000 0 10 20 30 40 50 60 70 80 90 100 An nu al Pe ak D is ch ar ge , cf s Return Period Duration Frequency
Figure 8. Duration diagram and log-Pearson Type III analysis of annual peak streamflows in the Animas River at Durango, Colorado for 1908-2010 plus 1898 and 1900.
0 5000 10000 15000 20000 25000 0 10 20 30 40 50 60 70 80 90 100 Ma xi mu m da ily d is ch ar ge , cf s Return Period
snowmelt snow-melt LP III
fall fall LP III
Figure 9. Duration and log-Pearson Type III (LP III) analysis of maximum daily streamflows for the snow-melt period and for the fall on the Animas River at Durango Colorado. The period covered is from 1908-2010 for both plus, 1898 and 1900 for the snow-melt period.
Table 1. The peak discharge and maximum daily discharge for various return periods in terms of % of years the discharge is equaled or exceeded.
Peak Discharge,
cfs Maximum Daily Discharge, cfs
Return period, % Annual Snow-melt Fall
0.5 16,702 11,947 17,663 1 14,893 11,075 12,996 2 13,146 10,162 9,445 10 9,230 7,789 4,187 20 7,547 6,598 2,793 50 5,135 4,659 1,439 90 2,860 2,530 679 98 2,012 1,668 494 record 25,000 19,000 23,750 Ratio of record maximum to 0.5 % return period value 1.50 1.59 1.34
6. Discussion
Both the 1910 flood and 1927 floods were a result of locally intense rain (Waltemeyer and Gold, 1991 ) . The largest three discharges for each frequency analysis (annual maximum day snow-melt, and maximum day fall) are presented in Table 2.
Table 2. The three largest peak annual discharges and maximum daily discharges during the snow-melt period and the fall in the Animas River at Durango, Colorado.
Annual Fall Snow-melt
Rank Year Discharge, cfs Year Discharge, cfs Year Discharge, cfs 1 1911 25000 1911 23750 1927 19000 2 1927 20000 1927 13300 1949 10700 3 1949 12700 1909 10000 1941 9500
The monthly precipitation measured at Silverton is shown in Figure 10 for 1911. The data suggest the antecedent conditions were very wet for the period prior to the rainfall causing the flood in early October (peak discharge on the 5th of October).
0 1 2 3 4 5 6 7 8 9
November February May August
Mo nt hl y pr ec ip ita tio n, in ch es Month 1911 1927 mean
Figure 10. Monthly precipitation at Silverton during the period November 1910 - October 1911 and November 1926 - October 1927.
Webb, et al (2001) made the following statements about the 1911 flood near Bluff, Utah further downstream on the San Juan River:
The 1911 flood was considered as the largest between 1880 and 2001. Based on our analysis, the 1911 flood has an estimated recurrence interval of about 150 years.
and
The 1911 flood was not only the largest flood during the historic period, it is the largest flood that has left preserved evidence in the San Juan Canyon.
The frequency analysis in this paper indicates the recurrence interval of the 1911 flood on the Animas River exceeds 200 years. The following statement from Waltemeyer and Gold (1991) about floods in New Mexico certainly applies to the south facing watersheds in the San Juans:
The principal moisture from late fall to early spring originates in the Pacific Ocean and affects the western part of the State. Pacific moisture also contributes to precipitation in the eastern plains, although the Pacific is not as important a source as the Gulf of Mexico. Occasionally, the remnants of an eastern Pacific tropical cyclone bring locally intense rain in the fall.
It is possible conditions set-up by the North American Monsoon create a pathway for moisture from the Eastern Pacific if there is a transport mechanism such as a eastern Pacific tropical cyclone. This is a concept that needs further investigation.
The 1927 snow-melt flood occurred during the snow-melt period and the implication that rain added to the runoff from snow-melt. The monthy precipitation at Silverton from November thru October is also presented in Figure 10. The 1927 snow-melt flood did considerable damage in the Silverton area and between Silverton and Durango. The June precipitation was the largest for the period of record at both Silverton (99 years) and Durango (110 Years) and exceeded the next highest in Silverton (June 1938) by 15% and at Durango the next highest (1948) by 80%.
The June 1927 flood was wide-spread and was the second largest annual peak
discharge on the Rio Grande near Del Norte, Colorado (the largest was the 1911 event). If the snow-melt peak discharge had not occurred the fall 1927 event would have been the second largest.
7. Conclusions
In this paper it has been shown that the normal high flows are a result of snow-melt but the extreme flood events are a result of rain events, mostly in the fall. The single major flood caused by rain during the snow-melt period (the June 1927 flood) may be a third population of peak runoff events (snow-melt and fall rains being the other two). This third population of peak events (major rain on snow) events can be important in terms of flood damages but are significantly less common than the high flows caused by the fall rains.
If we assume the June 1927 flood was a monsoon related event and changed the 1927 peak in the fall maximum daily discharge time series (13,300 cfs) to the snow-melt maximum that occurred in June (17,000 cfs) and call the series a monsoon time series and subsequently delete the 1927 event from the snow-melt time series the 200 year snow-melt maximum daily discharge frequency becomes 9518 cfs (compared to 11,947 cfs with the 1927 maximum daily discharge) and the monsoon 200 year event is 19,950 cfs (compared to 17,663 cfs as a fall event). This change is an attempt to represent the physical process more accurately. The physical process may be one of monsoonal conditions establishing the conditions for transport of water from the eastern Pacific Ocean by late-season cyclones. The 1927 snow-melt period is an anomaly – was it an early monsoon event; or was it something else? Nothing has been found in the literature so far that suggests an answer to this question.
If one is doing flood alerts for the Animas watershed as a whole look for atmospheric conditions that cause moisture movement form the eastern Pacific Ocean. The snow-pack is probably of less concern than the atmospheric conditions associated with widespread rain.
References
Adams, David K. 2004. Review of Variability in the North American Monsoon. Impact of Climate Change and Land Use in the Southwestern United States. Last Modified: Tue 18-May-2004 11:13:08 MDT. Downloaded from http://geochange.er.usgs.gov/sw/changes/natural/monsoon/ on 3 January 2011. Church, S.E., Paul von Guerard, and S.E. Finger, editors. 2007. Integrated investigations of environmental
effects of historical mining in the Animas River watershed, San Juan County, Colorado. U.S. Geological Survey Professional Paper 1651, 1096 pages plus CD-ROM (in two volumes).
Corbosiero, Kristen L. 2003. "The Contribution of Eastern North Pacific Tropical Cyclones to the Warm Season Rainfall Climatology of the Southwestern United States" Down;oaded from
(http://web.archive.org/web/20060505070334/http://www.atmos.albany.edu/student/kristen/monsoon.ht ml) University of Albany. 10 February 2011
Arizona. College of Agriculture and Life Sciences. Tucson, Arizona 85721 8 pages. Downloaded from cals.arizona.edu/pubs/natresources/az1417.PDF on 24 January 2011.
La Plata County Building Department. 2011. 2010 Flood Plain Regulations with FEMA Firm Mapping La Plata County OEM. Downloaded from La Plata County web site on 26 January 2011.
NOAA. 2011. Top Arizona Hurricane/Tropical Storm Events. Downloaded from
http://www.wrh.noaa.gov/psr/tropics/hurricanes.htm on 10 February 2011.
Patterson, J.L. and W.P. Somers. 1966. Magnitude and Frequency of Floods in the United States. Colorado River Basin. USGS Water-Supply Paper 1683. U.S. Geological Survey. Washington, D.C. 475 pages. U.S. Geological Survey. 1954. Compilation of Records of Surface Waters of the United States through
September 1950. Part 9. Colorado River Basin. USGS Water-Supply Paper 1313. Washington, D.C. 749 pages.
Waltemeyer, S.D. and R.L. Gold. 1991. New Mexico Floods and Droughts. in Paulson, R.W., Chase, E.B., Roberts, R.S., and Moody, D.W., Compilers. National Water Summary 1988-89--Hydrologic Events and Floods and Droughts. U.S. Geological Survey Water Supply Paper 2375. 591 pages. (General Climatology Section by K.E. Kunkel, K.E., New Mexico State Climatologist.)
Webb, Robert H., Diane E. Boyer, Lynn Orchard, and Victor R. Baker. 2001. Changes in Riparian Vegetation in the Southwestern United States: Floods and Riparian Vegetation on the San Juan River, Southeastern Utah. USGS Ground Water Resources Program. USGS Open File Report OF 01-314. U.S. Geological Survey. 1675 W. Anklam Road. Tucson, AZ 85745