Market efficiency for two classes of
stocks in China: state owned and
private companies
Authors:
Abdi Abdirahman Renyuan HuangSupervisor:
Catherine LionsStudent
Umeå School of Business and Economics Spring semester 2012
Acknowledgements
We would like to express our thanks to our supervisor Catherine Lions for her generous support and guidance during the work. Without your help we would have not been able to complete this thesis. Particularly, we thank you for the kindness and timely help even in the late nights and holidays.
We would also like to thank our families and friends for their support and accompany during our study.
Finally, we are grateful to those who helped us to revise the language of this thesis.
Abdi Abdirahman Huang Renyuan
Umeå Sweden 2012-05-29
Summary
The fast-growing economy in China attracts the world’s interests, which includes the Chinese stock markets. The market efficiency of Chinese stock markets is widely discussed by researchers in different approaches. The involvement of government in stock markets is a unique case in the financial world.
By this paper, we are answering the question that is the degree of market efficiency of stat-owned companies different from that of private companies in Chinese stock markets. This will bring us knowledge about Chinese stock markets as well as the impact from ownership, market value and management styles on market efficiency.
To clarify the influence from government involvement in stock markets, we select 938 stocks distinguished by ownership structure. This quantitative study is preceded on daily data from 2007 to 2011. We use auto correlation, Chi-square test, and linear regression together with Spearman’s correlation to test our hypothesis. The degree of market efficiency of each ownership group is examined and compared to each other. Market efficiency related to ownership and market capitalization are inspected if they are anomaly factors in Chinese markets.
The empirical results indicate that the degree of market efficiency of state-owned companies is significantly different from the degree of market efficiency of private-owned companies in China. The market capitalization is one of the existing anomaly factors in Chinese stock markets, as well as it is correlated with degree of market efficiency to some extent. For state-owned enterprises, active management on stock market does not provide a better market efficiency compared to passively managed companies.
Keywords: Efficient Market Hypothesis, Random Walk, Degree of Market efficiency, Anomaly, Chinese stock markets, State-owned enterprises, Ownership, Market Capitalizations.
Contents
Acknowledgements I
Summary II
Contents III
List of Tables and Figures 1
Chapter 1 : Introduction 2 1.1 Background 2 1.2 Knowledge Gap 6 1.3 Research Question 6 1.4 Research Purpose 7 1.5 Audience 7 1.6 Delimitations 7 1.7 Disposition 8 1.8 Glossary 9 1.9 Abbreviation list 9 Chapter 2 : Methodology 11 2.1 Preconceptions: 11 2.2 Choice of subject 11 2.3 Research Philosophy 12 2.3.1 Ontology 12 2.3.2 Epistemology 13 2.3.3 Axiology 14 2.4 Research Approach 14 2.5 Research Strategy 15 2.6 Research Method 15 2.7 Time Horizon: 16 2.8 Research Design: 16 2.8.1 Research Objectives 16
2.8.2 Research Process of our study 17
2.9 Source of Literature 18
2.10 Criticism of Literature: 18
Chapter 3 : Theoretical Framework 20
3.1 Theories 20
3.1.1 Efficient Market Hypothesis (EMH): 20
3.1.2 Random Walk Theory: 21
3.1.3 Degree of Market efficiency 22
3.1.5 Value at Risk (VaR) 24
3.1.6 Anomalies: 25
3.1.7 Behavioral Finance 29
3.1.8 Chinese Capital Markets and State-Owned Enterprises (SOEs) 29
3.2 Literature Review 30
3.3 Summary of Theoretical Framework 33
Chapter 4 : Empirical Study 36
4.1 Accessing and Adjusting Data 36
4.2 Data Description: 37
4.3 Data Analysis Procedure 37
4.3.1 Step 1: Log Return 37
4.3.2 Step 2: Normality Test 37
4.3.3 Step 3: Autocorrelation Test: 38
4.3.4 Step 4: Ownership Recognizing 39
4.3.5 Step 5: Comparing the Market Efficiency of Different Classes of Stocks 39 4.3.6 Step 6: Illustrating the influence of market value 40
4.3.7 Step 7: Anomaly Test 41
4.4 Methodological Criticism 42
Chapter 5 : Findings and Analysis 44
5.1 Test the Homogeneity of Degrees of Market Efficiency among Ownership Groups 44
5.2 Market Value and Market Efficiency 46
5.3 Anomalies Test 51
5.3.1 Anomaly: Ownership and Market Efficiency 51
5.3.2 Anomaly: Market Value 54
5.4 Findings and discussion 55
5.5 Summary Our Findings 56
Chapter 6 : Discussion and Conclusion 58
6.1 Discussion and Conclusion 58
6.1.1 Discussion 58 6.1.2 Conclusion 59 6.1.3 Contributions: 60 6.2 Further Research 60 6.3 Credibility Criteria 61 6.3.1 Validity 61 6.3.2 Reliability 62 Reference List 63 Appendix 67
Appendix I: Market Value Deciles for Portfolios Setting 67 Appendix II: Normality Test for Log Return of Detailed Ownership Groups 67 Appendix III: Log Return for Stocks in Different Ownership Groups and Different Efficiency
Level 69
Appendix IV: Mean of Log Return 70
List of Tables and Figures
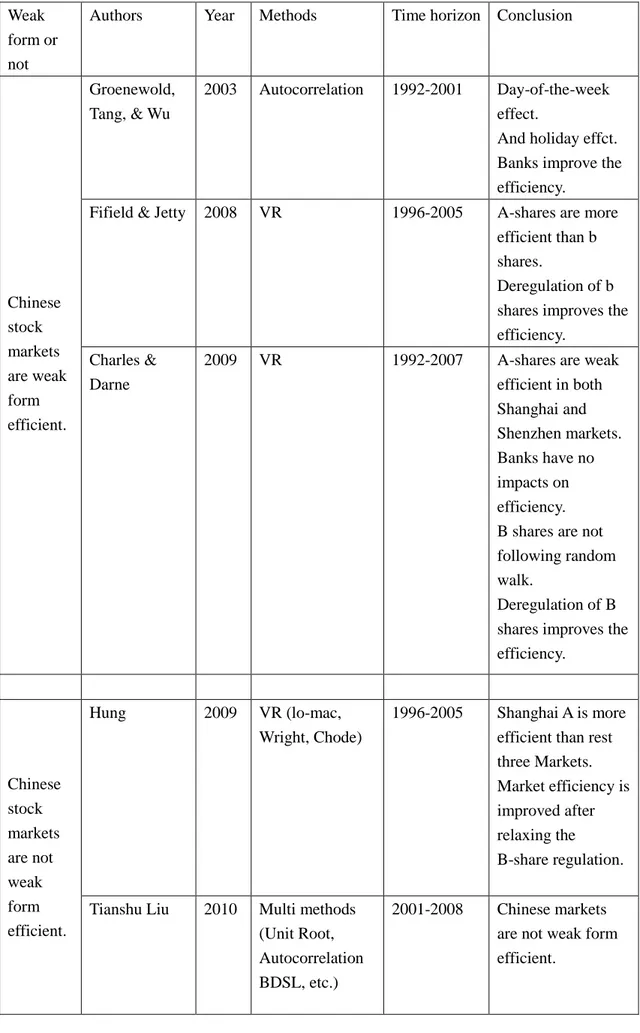
Tables:Table 1: A and B share markets overview 3 Table 2: The number of QFII from 2003 to 2011 5 Table 3: Previous studies on the weak form efficiency for Chinese stock markets 32
Table 4: The overview of data 37
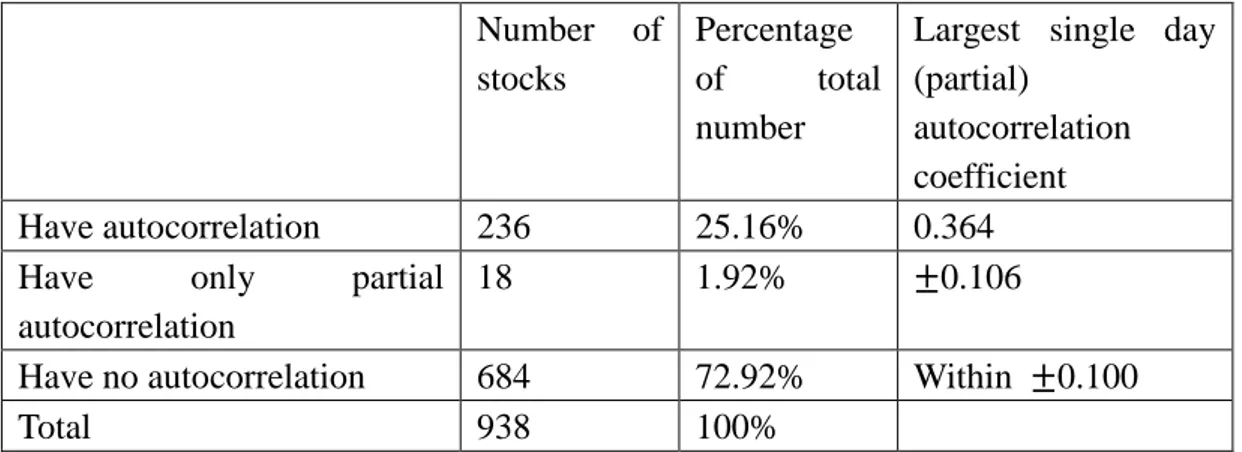
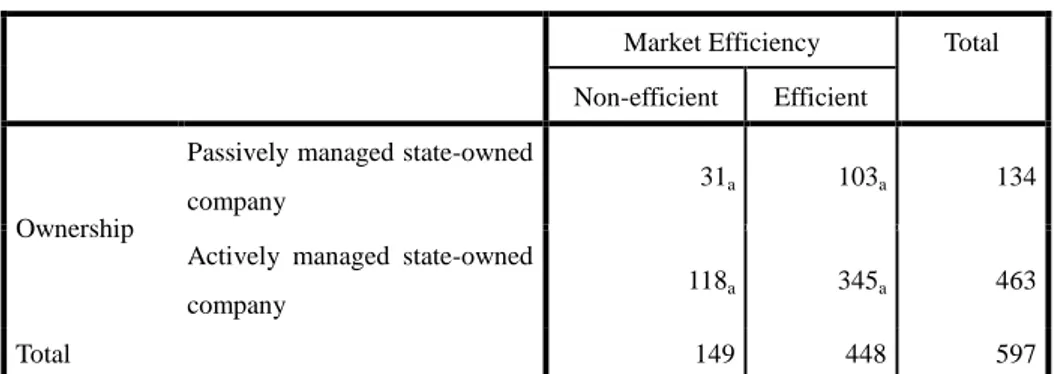
Table 5: Number of stocks following normal distribution 38 Table 6: Number of stocks with/without (partial) autocorrelation 38 Table 7: The ownership structure of Chinese stock markets 39 Table 8: Overview of Chinese stock markets: ownership and market efficiency 44 Table 9: Chi-square test: market efficiency and ownership 45 Table 10: Chi-square test: market efficiency and management of state-owned companies 46 Table 11: Chi-square test: market efficiency and market value portfolios 48 Table 12: Spearman's correlation test of market value and log return 54
Figures:
Figure 1: Summary of Chinese stock market and GDP from 2000 to 2009 4
Figure 2: The research 'onion' 12
Figure 3: The research 'onion' of our study according to Saunder et al. 18
Figure 4: Random walks and bounds 22
Figure 5: Market efficiency histogram classified by ownerships and market value
portfolios 49
Figure 6: Degree of market efficiency of all portfolios in each ownership groups 49 Figure 7: Market efficiency histogram classified by detailed ownerships and market value
portfolios 50
Figure 8: State-owned companies' degree of market efficiency in all portfolios 51 Figure 9: Boxplot of log return for ownership groups 52 Figure 10: Log return and relative parametric VaR of efficient and non-efficient Chinese
stocks grouped by ownership (see also Appendix IV and V) 53 Figure 11: Scatterplot of market value and log return for Chinese stocks 55
Chapter 1 : Introduction
In this chapter, we present the background of Efficient Market theory and Chinese stock markets. Then we introduce the existing knowledge gap, followed by our research problem and the choice of subject. The limitations and disposition of the study are defined and can be found in the end of this chapter.
1.1 Background
Market efficiency mainly concerns how the prices of stocks reflect all the information available in the market. In 1970, Eugene Fama developed Efficient Market Hypothesis, which results in three levels of market efficiency: weak form, semi-strong form, and strong form (Fama E. F., (1970)). Ogden et al. (2003) describe the three levels, “In weak form, a security’s price reflects all information that may be contained in the security’s historical prices. In semi-strong form, a security’s price reflects all publicly available information. Finally the market is strong form efficient if a security’s price reflects all information, both public information and information held privately.”
There is a substantial amount of research and studies about market efficiency. Many of these studies indicate that the fair price of security can be achieved if many rational investors actively trade the stock when they have information that may impact the stock price. There is one group of scholars who believe that certain ownership structures may have an impact on market efficiency. For example, block trading can actually improve the short-term market efficiency (Edmans, (2009)). The price of stock is adjusted when institutional investors sell or buy the security according to their insight.
In contrast, some parties involving the security market are inactive either for short-term or for long-term. Restricted shares are not transferable until certain conditions are fulfilled. Owners of restricted shares cannot response to any information during the lockup period forced by law or binding contract. However, they can long the share in the market. And, government is another type of inactive player in the market. In some cases, the government just holds the securities and is resistant to any kind of information or performance changes of companies. This means that the government would neither buy nor sell the shares at any price. Based on existing theories, the inactive holding position may lead to a less efficient situation. On the other hand, the government establishes the supervisory institution and perfects laws and regulations to improve the efficiency of the stock markets (OECD, 2005). Still, empirical studies are needed to determine whether the government’s passive management of its stock holdings has effects on the degree of market efficiency.
When discussing the ownership structure of a company, it can be separated into three situations based on their holding position: 1) Dominant. One party owns the largest proportion of shares, and has major influence the company performance. 2) Non-dominant but significantly owning. One party owns a large proportion of shares, and has minor influence on the company performance but not determinate. Normally they show on the list of shareholders. 3) Non-significantly owning. One party owns some of shares but has little or no influence on the company performance. This paper mainly focuses on the first two situations, dominant and significantly owning. Within this framework, the companies can be separated into three groups: Government Dominant, Pure Private Dominant and the rest in between or with other ownerships (i.e. collective ownership). Only government dominant and pure private dominant situations are discussed.
China is the world’s most populated country and its economy has gone through some fundamental changes after its economic reforms started in the late 1970s. China has since the reform policies been developed from a central-planned economy to a market-oriented economy. However, there are some adjustments still needed for the country to be considered as a full market-oriented economy, inasmuch the state sector still has a major role in the Chinese economy. Its economic reforms created new incentives for individual initiative and led to a sharp increase in productivity or performance, mainly due to a better use of resources.
To accelerate the capitalization, the Chinese government established two stock markets, Shanghai (SSE) and Shenzhen (SZSE) in 1990. This increased the economic ties with the rest of the world. To involve foreign capital, a B-share market was established from the very beginning of the Chinese stock markets. The first B-share IPO was in 1991. The B-share market was limited to those investors who are foreign citizens from countries or regions outside of Mainland China. The domestic individual investors were only allowed to be involved after 2001. The B-shares are traded in either USD or HKD. In 2001, China formally joined and became a member of the World Trade Organization (WTO). This gives them a greater access to the foreign markets but it also allows the world to access the Chinese markets. (Information can be found in Table 1.)
Table 1: A and B share markets overview
A-share markets B-share markets
1990: First IPO
1991:First IPO (Only for foreign investors)
2001: Domestic individual investors were allowed to invest in B-shares 2003:QFII policy applied (Foreign
At present there are two stock exchanges in Mainland China, Shanghai stock exchange (SSE) and Shenzhen stock exchange (SZSE). Both of the stock exchanges serve under the control of central government. The establishment of stock markets should stimulate Chinese economy for decades.
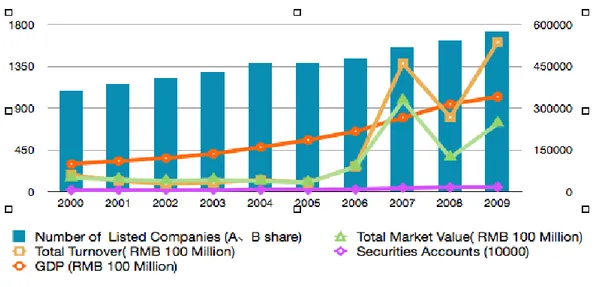
According to the Figure 1, both Chinese economy and stock markets grow rapidly from 2000 to 2009. The economy grows constantly, while the stock market increases with fluctuations. The number of listed companies’ both A and B share have increased year by year, as well as the securities accounts. The increasing securities accounts imply more and more investors to participating in Chinese stock markets. Although the Chinese stock market is extremely risky in some years (the total market capitalizations exceeding annual GDP in 2007), it is still a growing and interesting market.
Source: the stock market data are coming from China Securities and Future Yearbook 2010, China Securities Regulatory Commission (CSRC), 2010.
GDP data are coming from China statistical yearbook 2010, National Bureau of Statistics of China (NBSC) 2011.
Figure 1: Summary of Chinese stock market and GDP from 2000 to 2009
One interesting factor about Chinese stock markets is that stocks of State-owned public companies are available. State-owned public companies are those dominated by state or government and arelisted in the stock markets, the shares are owned by the government but are only traded in rare cases. This situation is uncommon in western countries: only a few listed companies involve government as their shareholders, and few of them are controlled or dominated by government. As a previous planned economy, the Chinese government still controls many companies. From the very beginning, and even currently, state-owned companies are playing an essential role in both the Shanghai and Shenzhen Stock Exchange (SSE and SZSE). Most of the listed companies in 1990 were state-owned companies. Today, the state-owned companies are still making up a large
proportion of the total Chinese stock market value. The State-owned listed companies are generally stable, profitable and taking advantage from the government’s policy-making.
Meanwhile, the fast growing economy of China is attracting foreign capital to invest in the domestic capital market. The Qualified Foreign Institutional Investors (QFII) are allowed to invest directly in A-share markets since 2003 .The growing sizes and numbers of the QFII are showing the interest of being involved in the Chinese security market (Table 2). By 2012 Feb 9, there are in total 142 QFIIs in total (China Securities Regulatory Commission, (2012)). China is not only a diversification alternative for foreign investors, but also a hedge tool against their domestic market. According to YiHao Lai and Jen-Ching Tseng’s research (Lai & Tseng, (2010)), Chinese stock markets are both a hedge and also a safe haven for G7 stock markets based on its low dependency of international stock market. Regardless of the rapid economic growth in China, Chinese stocks should be considered to been put into the portfolio for both individual and institutional investors.
Table 2: The number of QFII from 2003 to 2011
New QFII Total QFII
2003 12 12 2004 14 26 2005 7 33 2006 18 51 2007 0 51 2008 23 74 2009 19 93 2010 13 106 2011 29 135
Source: China Securities Regulatory Commission CSRC 2012,
Although more and more foreign investors invest in the Chinese stock markets, it is still a small proportion of their total investments. According to Swedish investment fund association (Fondbolagens förening, 2012), the net assets of Swedish funds invested in Chinese stock markets is 7575 million SEK, which is less than 1% of total 887 billion SEK of Swedish equity funds, while over 40 billion SEK equity fund are invested in Nordic, Eastern Europe, and other European countries. The small proportion indicates the unwillingness of Swedish funds to invest in Chinese stock markets. The lack of knowledge for the Chinese stock markets prohibits the Swedish funds to take Chinese securities into their portfolio. Language, culture, and business environment in China are completely different from those in Sweden. For those who are interested or have plans to start investing in China, they might wonder if the stock markets of China are efficient.
In this paper, we select sample companies from Shanghai and Shenzhen stock markets. A shares and B shares for same company are included separately to check the efficiency of state-owned listed companies of Chinese stock markets.
1.2 Knowledge Gap
As far as we know, there are no previous conducted studies or research on comparing the market efficiency of state-owned companies and private companies. Most of the existing research regarding the ownership and market efficiency are mainly focusing on how financial institutions’ trading activities improve the short-term information efficiency (Wang, et al., (2011)). There are numbers of evidences showing that institutional ownership significantly improved the market efficiency. Still, the influence of government ownership is unknown. By our research, we try to clarify if the market efficiencies of state-owned companies are significantly different from private owning companies in Chinese Stock markets. We intend to bring more knowledge on the efficiency of the Chinese stock markets, based on the facts that they are unique when considering the proportion of state-owned stocks.
As we believed, this knowledge gap is interesting for not only the players on Chinese stock markets, but also, the investors and scholars who are focused on the involvement of government in financial market. On one side, by bridging this knowledge gap, we can provide the players in Chinese markets break-through knowledge. On the other side, we hope our study can become a reference for those who are researching on Efficient Market Hypothesis or the involvement of government in countries even where SOEs are not listed.
Thus, the research question comes out.
1.3 Research Question
The research question is formulated as following:
Is the degree of market efficiency of state-owned companies different from that of private companies in Chinese stock markets?
To simplify our research, we separate in to several sub-questions to answer this question:
1. Is the degree of market efficiency of state-owned companies different from private companies or the companies with other ownerships?
2. Is there any difference in efficiency between actively managed and passively managed state-owned companies?
3. Is there any relationship between market value and degree of market efficiency? 4. Is any of following anomalies existing in Chinese stock markets? Ownership, market value, and market efficiency.
1.4 Research Purpose
The purpose of this paper is to examine if there are any differences of efficiency between state-owned companies and private companies. In order to solve this problem, the efficiencies of companies with different ownership are tested, and will be compared between different categories. We firstly identify the degree of market efficiency of state-owned companies and private companies, and categorize them by their market value or management style. By comparing companies’ degree of market efficiency in different groups, we illustrate the influence from these category factors.
Thereafter, the effects of the size of sampled companies are verified by the test of efficiency differences between the companies with various sizes.
1.5 Audience
This research is aiming for disclosing the impact from different ownership on the market efficiency in Chinese markets. We believe that the result may provide knowledge about the Chinese stock markets. Thus, the investors, both institutional and individual, who invest or are interested in Chinese stock markets, are the primary audience of our thesis. Whilst, we study the data based on the Efficient Market Hypothesis, the scholars who either agree or challenge the EMH theory may also exploit our conclusion in their arguments. Considering that we study the government involvement in the capital market, this paper may end up with a practical advice for Chinese government. Also, for those other countries that are trying to intervene the stock markets, our research may be one of the references due to the government and market interaction. Besides, financial analysts, portfolio advisors and financial community in general are also the target groups for our study.
1.6 Delimitations
First, in this paper, only Shanghai and Shenzhen stock exchange markets are concerned. Hong Kong stock exchange is materially different from the mainland markets, even though many Chinese blue chip companies are listed in the Hong Kong market.
terms, size may be one of the factors which may mislead the conclusion, thus the test regarding the efficiency on different companies with various share volumes are made to isolate the effects of size. The current size of each company is used to distinguish.
Third, the time period of selected data is from 2006 Dec 31 to 2011 Dec 31 and the companies are selected only if the base dates are before 2006 Dec 31. This means that the companies that IPOed after 2006 Dec 31 are not included. During this period, the Chinese stock markets got its historical peak (Shanghai composite index: 6124.04) and also suffered the global financial crisis.
Furthermore, language is another important issue that should be considered. Most of our referred literatures are documented in English, while many studies in Chinese are ignored for language cause. This may be the limitation of our research.
1.7 Disposition
Chapter 1: Introduction
The background information of Chinese stock markets and concepts of efficient market are presented in Chapter 1. The research problem of this paper is formulated right after describing existing knowledge gap. The research purpose and delimitations show the aim of this research.
Chapter 2: Methodology
In this chapter, by arguing scientific philosophy, positivism is used in this paper. Then we explain why quantitative research approach is conducted rather than qualitative research. We propose our research procedure according to the theory and the aim of our research.
Chapter 3: Theoretical Framework
In the third chapter we introduce the theoretical framework, by reviewing and contrast previous studies authoritative in the field of market efficiency. Moreover, to provide a concrete base to a further analysis, theoretical choices will be argued.
Chapter 4: Empirical Study
This section covers the relevant data collected in this study to achieve our goal, here the data is analyzed by applying statistical tests. We, furthermore, formulate our hypotheses for further examinations.
Chapter 5: Findings and analysis
In this chapter, we mainly present the observations, and with the help of statistical tools, we try to answer the research question of this paper.
Chapter 6: Discussion and Conclusion
We include our conclusions with the discussions in this chapter, and the further research is also suggested. Credibility is discussed based on both reliability and validity dimensions.
1.8 Glossary
State-owned Enterprises: Are those companies that are listed in the stock markets
and dominates by the state.
Private-owned Enterprises: Companies are recognize as private owned if it has
individual shareholding as it is actual control.
Long position: The investor in this position will profit if the price of the assets
increase
Short position:The investor who sold the contract will profit if the price of the assets
decreases.
Actively Mananged: Implies the companies use stock repurchase for private offering
and other strategies.
Passively Managed: Are those companies that have consistently stable holding
power in the examined period.
Market Capitalization:
Market value: Is the current or recently-quoted price for a market-traded security. Abnormal return: Is how the actual returns differ from the predicted return.
1.9 Abbreviation list
EMH Efficient Market Hypothesis SOE State-owned Enterprise
OECD Organisation for Economic Co-operation and Developement SSE Shanghai Stock Exchange
SZSE Shenzhen Stock Exchange NYSE New York Stock Exchange IPO Initial Public Offering WTO World trade Organization QFII Qualified Foreign Institutional
CSRC Chinese Security Regulatory Commissions SASAC Supervision and Adminstration Commission HR Human Resource
CAPM Capital Asset Pricing Model VaR Value at Risk
PEAD Post-earning Announcement Drift
Chapter 2 : Methodology
The methodology chapter describes how we proceed in the process of creating this paper. We begin by introducing the different research philosophy and the stance taken in this research process. Then we also explain and discuss the research approach, data collection methods, research design and source of literature. Finally, the research philosophy defines how the researchers assessed and developed their knowledge.
2.1 Preconceptions:
Obviously, Bryman and Bell (2011, p. 29-30) demonstrates that possibility for researchers to be influenced by previous experience and background is high. And to deal with the values and personal biases, the researchers have to act neutrally and to process the research based on the fact.
The authors of this study are two students that have significant different backgrounds. By doing a master thesis in finance, both of us have studied business for four years, and one of us has work and investment experience in Chinese capital market. Together with our financial statistics knowledge, we are sufficient to conduct this research. Furthermore, we believe that our research will be unbiased and objective without subjective preconceptions.
The interpretations in this thesis would be based on facts and data that we collected from reliable sources. In addition, we proceed our analysis and conclusions independently and unprejudiced.
2.2 Choice of subject
Our theoretical and practical background facilitated various discussions on many interesting research opportunities. From the start, we are attracted by the Efficient Market Hypothesis. As one of us has investment experience in Chinese stock markets, as well as its fast growing economy, we decide to investigate if Chinese stock markets are efficient or not. After reading the Edmans’ “Blockholder trading, Market Efficiency, and Managerial Myopia” (2009), we realize that the ownership may improve the market efficiency by trading activity. To connect this with our research target, the government is a crucial and unique player in the Chinese stock markets, and it is believed that the government is not as active as other players in the markets. Thus we finalize our
research to explore the market efficiency differences between private companies and government-owned companies in Chinese stock markets.
2.3 Research Philosophy
Johnson and Clark (2006) argued that the important issue is not whether their research should be philosophically informing, but how well they are able to reflect upon their philosophical choices and defend them in relation to the alternatives they could have adopted (Saunders et al., 2009, p. 108). This emphasizes that, what makes sense, is how well the process adopts the philosophical choices. The philosophy should be based on good arguments rather than being informing and shaped in a philosophical way. In this section, we will discuss three concepts of scientific philosophy: ontology, epistemology and axiology. In Figure 2.1 the research ‘onion’ shows the general picture of the research methodology alternatives on different levels.
Source: © Mark Saunders, Philip Lewis and Adrian Thornhill 2008
Figure 2: The research 'onion'
2.3.1 Ontology
Ontology, which extends both objectivism and subjectivism, carries on the assessment with the nature of reality. The research based on objectivism indicates that social entities exist in reality but are independent and external to social actors, whereas subjectivism assumes that social entities are not independent and external to social actors. The
subjectivists believe that reality is created by perceptions and consequent actions of the social actors concerned with their existence (Saunders et al., 2009, p. 110-111).
In this paper, we study the efficiencies of different classes of companies in the Chinese stock markets. It is believed that the efficiencies independently exist in the world, and can be observed, categorized and measured. Also, this concept does not rely on the social actors. Correspondingly, the social entities that we are interested in this research, stocks in Chinese markets, are independent and external to social actors. Thus we choose objectivism as our ontological stand point.
2.3.2 Epistemology
Epistemology defines what constitutes the philosophical underpinning of acceptable knowledge in a field of study. This enables us to gain a comprehensive knowledge and different procedures of explanation. That is, what is acceptable or legitimate with the way the researcher is doing this study. The epistemology theory can be seen as a requirement to follow the research procedure that is appropriate in different fields of studies (Saunders et al., 2009, p. 112).
Furthermore, the research process reflects two major views that contradict each other. They are positivism and interpretivism. Their initial meanings and how they are related to the different research will be summarized as following.
According to Bryman and Bell (2011, p. 15) positivism is an epistemological position to which reality should be derived from the methods of the natural sciences and applied to the social reality. This means that the researcher should not be influenced by different values and no values should affect the subject of the study.
Contrarily, interpretivism advocates that it is necessary for the researcher to understand differences between humans in the role as social actors. This idea reflects things differently. More important, the researcher has to adopt an emphatic stance in order to gain insight in the social world of the research subject and understand the world from their point of view (Saunders et al., 2009, p. 116). Consequently, many consider that an interpretivist perspective is highly appropriate in the area of business and management
research, particularly organizational behavior, marketing,and human resource (HR)
management.
In essence, the mentioned theories are well adopted depending on whether it is used as a positivism or interpretivism research. If the selected research is based on positivism then the researcher adopts the philosophical stance of the natural science. In positivism, in a research strategy the author has to collect existing theories to develop testable
hypotheses, which in turn tests by further researcher that would result whether to confirm or refute the theory in the research findings (Saunders et al., 2009, p. 113-114).
To resubmit our research question presented in chapter 1, it would be logical to base our research under the positivism philosophy. This means that the knowledge of something is true if we perceive it as it is. There, the researcher is examined for explanations as truthfully as possible. The same applies to our study since it is composed to collect data/information to discover and analyze the research question. The philosophy guided us to accomplish our goal through testing different theories, and therefore the positivism philosophy is appropriate to conduct our research.
2.3.3 Axiology
Axiology is the philosophical theory of value and value judgment that deals with all stages of the research process to improve the credibility of research results. Heron (1996, cited in Saunders et al., 2009, p. 116) enhanced the theory and argued that researchers exhibit the skills of the theory by being able to express their values and value judgments that are based on the research they are conducting and how they proceed. This is also used as a guideline for their research. We are attempting to process our research in a critical way without any presumptions. The sampling size should be large enough to conduct a significant test, as the theories are used in appropriate manner. By all likewise efforts, it might improve the credibility of our study.
2.4 Research Approach
There are basically two different approaches to the study, which explain the links between theory and reality, namely deductive and inductive methods. Our study will take a deductive research approach. It is suitable for descriptive studies since the researchers have tested existing theories and hypotheses. The deductive research approach enables the researcher to be independent in his or her observing but in an operational way measure the facts. As Locke mentioned in his argument of inductive and deductive method, “deduction involves going from the general to the particular.” (Locke, (2007))
In contrast, an inductive approach is making the researcher gather data/information, which is then analyzed in order to formulate a theory. The inductive approach is often used for a qualitative rather than a quantitative study (Saunders et al., 2009, p. 125-126).
The deductive method allows us to be objective and is more suitable for our study since the purpose of our study is to examine if there are any differences of the efficiency between state-owned companies and private companies. Building hypotheses and
testing would be the tools implied through a usage of existing literature and theories under the study. We base our study on deductive approach to process this study.
2.5 Research Strategy
There are multiple research strategies that can be conducted to a solid research, for example: experiment, survey, case study, archival research, etc. According to Saunders et al., (2009, p. 141), ‘what is most important is not the label that is attached to a particular strategy, but whether it will enable you to answer your particular research question(s) and meet your objectives’. Based on our research approach, archival research is the strategy that is able to provide the answer to our research question. The data of listed companies’ stock price and capital size as well as ownership, which are going to be analyzed, are recorded and documented. Thus, archival research will be conducted as the strategy of this thesis.
2.6 Research Method
There are two different methods that define how a researcher collects, uses and analyzes empirical data: quantitative and qualitative. Both methods are widely used in business management research and are distinguished in different ways. The characteristic of quantitative research is gathering data/information in the form of numbers and this eliminates the occurrence of any subjective judgments. The qualitative research tends to be subjective and focuses more on interviews and data categorizing than numbers. This gives a better understanding of the key concepts (Saunders et al., p. 151-152). Yet, other than this, Thurston et al. (2008, p. 3) argue that the mixed method is an option to combine methods from different paradigms as one. A mixed method research is which the researcher collects, analyses and mixes inferences in both quantitative and qualitative research into one single study. The module is useful when to supplement one research-information to another by using different data sources.
As the authors of this thesis, we have to manage our empirical data in an objective way so that the study can be generalized in a reliable manner, and a generalization can only be made if we operate trustworthy observations of data/information in companies listed in China. Examining data/information in the companies listed in China will clarify the implication of our research question. The data analyses we have chosen in this study are based on existing theories and not to create any new theory. We have therefore applied a quantitative approach to analyze data collection of large number of companies listed in the Chinese market.
2.7 Time Horizon:
In a study, either a cross-sectional or longitudinal can be chosen in time horizon. (Saunders et al, 2009, p. 155) A cross-sectional study grasps to inspect a particular phenomenon, within a short time frame. It is more suitable to use a cross-sectional method when comparing different segments. Longitudinal study, on the other hand, is a research set a period of time, namely to trail the effect of variables being studied. Since we examine the different degrees of market efficiency between state-owned and private listed companies, the cross-sectional study is more appropriate to conduct to our research. We believe that the time horizon of the last five years may provide us reliable observations. It may be argued that the five years is not a short time period. However, considering our aim of this research is to compare market efficiency between different segments in Chinese stock markets, it constrains our time horizon as cross-sectional. If we were attempting to illustrate how the market efficiency situation has changed over years, the longitudinal method should be applied. The data collection and data analysis will be discussed in the empirical part.
2.8 Research Design:
Research design is the model that is based on theoretical considerations to distinguish the way we think and how we conduct to our study. Bryman and Bell (2011, p. 40) demonstrate that the research design is a framework of how a researcher collects and analyses data and its procedures. This framework is further described by Greener (2008, p. 38) who remarkably indicates that a research design is a grand plan of approach to a research topic. He even highlights: before designing the research topic, it must have been assessed and considered various views on truth both knowledge and social entities. Saunders et al., (2009, p. 136) refer to the same formulation as above. There they mean that a research design is attended as a guide in answering the research question. The method consists to how we have preceded our study.
2.8.1 Research Objectives
The research objectives of our study are clearly stated in our early discussion of research question. We are trying to determine if the degree of market efficiency is different when we compare state-owned public companies and private companies.
To achieve the objective, we have decided to break down into following steps:
1. Examine the market efficiency of individual companies, and compare the sampled companies by two classes: state-owned and private.
illustrate the size’s influence on market efficiency.
3. Testify the existence of anomalies in Chinese stock markets. 4. Finalize the result from data, and answer the research question.
This enabled us to decide our approach to research design as a base of the setting research objectives.
2.8.2 Research Process of our study
To choose an appropriate research philosophy, it is very important to gain a correct understanding of the way we portrayed our research question. In previous sections we have discussed different research philosophies that might be the stances of our research process. We examined which philosophies were more suitable for the research. As the research mainly focuses on descriptive study, it tends to apply to positivism with deductive approach because of its research question. Based on these considerations, this study is highly adopted a quantitative method. Finally, we also conduct archival strategy to the study, as it applies to descriptive study and uses of administrative records and documents as a principal source of data (Saunders et al., 2009, p. 150). To exam the market efficiency we need to use price data and other relevant information about the companies. Thus, archival strategy suits our research. Our study is based on a cross-sectional time horizon. Here we present our research design by our own research ‘onion’ Positivism Deductive Archival Quantitative Cross-sectional Data
Figure 3: The research 'onion' of our study according to Saunder et al.
2.9 Source of Literature
In our study, we want to refer to peer-reviewed materials that have scientific acceptance. To weigh this up we selected books, articles, journals and web-based sources that support the objective of our research.
The books we chose are mostly related to our research field. And some of them are widely used as course literatures. In addition, the books regarding to the methodology and statistics are also used as a guideline to support our thesis. The articles and journals are mainly accessed from Google Scholar search engine and the Scopus database from the Umeå University Library. We collected extensive international business articles and journals by exploring the keywords such as ‘market efficiency’, ‘degree of market efficiency’, ‘Chinese stock market’ and etc. We choose the most relevant ones to extent our knowledge about our study. And the web-based sources are used only if they are officially published by governments, institutions and companies.
2.10 Criticism of Literature:
To justify the quality of different sources it is important to consider the relevance and its scientific foundation (Saunders et al., 2009, p. 93).
The books acquired in this paper are believed to be good quality and relevant to our study. Being as course literatures implies that they define and explain the concept detailed and thorough. They provide a clear view of the concepts that are related to our research.
These articles and journals are published in various years range from late 1960 to 2010. As time passes, the main concepts of these articles are developed in a consistent way, which means that they are reliable to be referred to. Some articles may come up to result conflict to others, mainly because of the different methods they are using regarding the same issue. These conflicts in fact reflect the different views of previous researchers and the complicated market situations. This required us as authors to review them in a more critical approach, thus enhance the solidity of our research.
Also, the web-based sources contribute to the reliability of our study, although, they are not as solid as scientific articles. Government and institutions are regard as authorities, the data and information from them are approbatory and widely used. The used data and information from the listed companies are under direct of CSRC standard and are provided to the public investors. Thus, the reliability of these sources is ensured.
As mentioned above, the selection of the literature is assumed to prove the quality of this research and to fulfill the requirements and conditions to conduct a scientific research
Chapter 3 : Theoretical Framework
This chapter explicates the relevant Efficient Market theories to answer our research question. We start from the Efficient Market Hypothesis, followed by Random Walk Theory. Capital Asset Pricing Model and Value at Risk are used as the instruments to conduct this paper. At the same time, we include those concepts conflict or challenging the Efficient Market theories. Previous studies about the efficiency of Chinese markets are deposited as referred material.
3.1 Theories
3.1.1 Efficient Market Hypothesis (EMH):
Fama Eugene developed the Efficient Market theory in 1970 based on previous research, such as Samuelson’s random walk theory in 1965. The Efficient Market theory, in general, asserts that the price of securities should fully reflect all available information. The price of the security should always be the fair price. Thus, if market is efficient, no one can achieve abnormal return compared to average level. The mathematical way to describe EMH is that:
, [3.1]
Where, is the price of securities at time t, equal to , the rational expectation of securities at time by given value-based information at time t, divided by expected return .
In Fama’s 1970 research, he distinguished three situations of market based on different efficient levels. They are weak form, semi-strong form, and strong form.
Weak form: Price of the security fully reflects all historical information that may be contained in the historical prices and returns. In a weak form market, the price cannot be predicted based on previous prices or return. In mathematic term, if the price or return of the security shows as below, it means it is not a weak form:
Or , [3.2]
Where is the return of the security at time t, and is the return at time . It indicates that the price or return of the security is somehow related to its previous price of return. Investors cannot forecast the future price of the stock based on securities’ historical data, if the market is in weak form.
all market participants). Public information includes the previous prices of the stock, financial reports of the companies, and other relevant news or information that regard to the listed companies. In contrast, some private information or so-called insider information can influence the price of the stock, such as new contract, unexpected tax or debt waive, acquisition from other companies and etc. This kind of private information is only available for small groups of people, who are insiders of the stocks like top managers, investment bankers, and major shareholders. But, the insider trading is prohibited in most of countries, and it is also forbidden in China (Ogden et al., 2003).
Strong form: Price of the security fully reflects all available information (both public and private). In strong form market, historical and public information are used to price the securities by public investors, and insiders are using private information to adjust the security’s price also. Thus no one can beat the market. The return would be the same no matter the investors are following an active strategy or a passive strategy. There is no existing strong form market in the world. First of all, insider trading is forbidden in most countries over the world, it is impossible that stock price reflects the value of inside information. Empirically, insiders can achieve abnormal return by trading on private information, which conflict with strong form hypothesis. On the other hand, funds or investors can beat the market just by ‘luck’. The returns of hundreds of thousands funds and investors should follow a normal distribution, thus, beat the market situation appears time to time (Ogden et al., 2003).
3.1.2 Random Walk Theory:
The random walk model was mentioned first by French mathematician Bachelier in 1900. Other researchers later develop this theory (Paul Cootner 1964, Paul Samuelson 1965, and Eugene Fama 1970). The theory demonstrates that the previous movement in the market price cannot be used to anticipate the future prices. In other words, stock price movements are unpredictable and impossible to foresee which direction the price will move; either will be up or down. So no individuals can beat the market. This theory is well commonly used when we talk about the market efficiency.
, [3.3] Or
Where
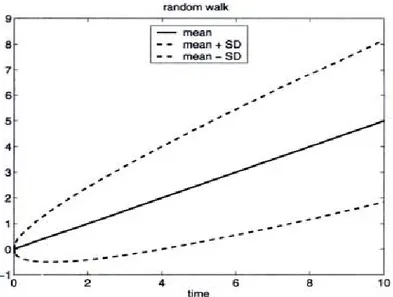
is the start point of security price. is the price difference between time t-1 and time t, or so-called steps. is independent with mean µ and standard deviation σ. So with . The mean µ is the drift that indicates the general direction of the random walk (Ruppert, 2004, p. 82). If is normally distributed, then the process of , , …, is a random walk.
Mean and bounds (mean plus and minus one standard deviation) on a random walk with , , and . At any given time the probability of being between the bounds (dashed curves) is 68% if the distribution of the steps is normal.
Source: Statistics and Finance, An Introduction. David Ruppert 2004.
Figure 4: Random walks and bounds
In the reality, the return is more commonly used in financial world. And natural logarithm return is more convenient for measuring multi-period returns. It simplifies the product of returns by summing up single period log returns.
, [3.4]
Or
Only if , … are following independent N ( , ).
By the influence of log return of security prices, the random walk process should be changed into geometric random walks or exponential random walk.
However, the geometric random walk model implies that future price changes are independent of the past and therefore not possible to predict, but it does not imply that one cannot make money in the stock market (Ruppert, 2004, p.83). In most cases, the mean is positive, thus an upward trend exists to the random walk. Considering that, only future deviations from the trend cannot be predicted, still the trend itself can be foreseen once is estimated (Ruppert, 2004, p.83). This is a condition that matches the weak form efficient market. The geometric random walk is the theory we are mainly concerned in this paper.
3.1.3 Degree of Market efficiency
Efficiency”, in order to measure the degree of market efficiency, a new practical tool or instrument is needed to evaluate the risk level for both short-term and long-term nonlinear time horizons and for strict non-stationarity. ‘The empirical financial markets are just not as efficient as is theoretically assumed in the financial textbooks. The financial markets cannot be divided in black or white, and they cannot be separated into either inefficient or efficient. The financial markets exhibit a continuum of different degrees of efficiency. Since this is the empirically observed case, financial research has to concentrate on different issues.’ stated by Los (2005). In our thesis, we tend to interpret the degree of market efficiency differences between various ownerships and market capitalizations. An indicator is required to measure this concept. The degree of market efficiency is the measurement that to what extent the market unpredicted. For stock markets, one market having relatively more unpredictable stocks is believed more efficient than the one with more predictable stocks. Simply, we use the proportion of the stocks following Random Walk Theory as the measurement of the degree of market efficiency.
3.1.4 Capital Asset Pricing Model
CAPM model was first introduced by William Sharpe (1964), John Linter (1965) and Mossin (1966). It is designed to evaluate the performance of managed portfolios (Fama and French 2004). Sharpe illustrated that the covariance between the security’s return and that on market portfolio is the most important part. The equation of CAPM model is:
, [3.5]
Where is the expected return of the security or portfolio. is the risk free rate, which in other word the return of a benchmark risk-free instrument. is the market portfolio return. And is the coefficient of the link between market portfolio and security or portfolio. This equation indicates that the individual security’s return should somehow correlate to the market return or relevant index return if the risk-free rate is excluded.
Moreover, the CAPM model is the theory grounded on assumptions, which simplify the reality. According to Bodie et al. (2009, p. 280), these assumptions are:
1. There are many investors in the market. None of them have an endowment are sufficient enough to affect the security prices by their own trades.
2. The holding period of investment is identical.
3. Investments are restricted. Investors are allowed to put their money only in a universe of publicly traded financial assets such as stocks and bonds, and risk-free borrowing or lending arrangements. It is also assumed that investors may borrow or lend any amount at a fixed, risk-free rate.
4. Taxes on returns and transaction costs on trades are irrelevant. 5. All investors are rational expected return-variance optimizers.
6. All investors have homogeneous expectations of the securities and share the same view of economy.
All these assumptions should be reminded when adopting CAPM model.
Some researchers also criticize the model for its idealistic assumptions. The reality is more complex. i.e. taxation and transaction cost do exist. Not all investors are rational. In addition, investors do not always have homogeneous expectations of the securities.
3.1.5 Value at Risk (VaR)
Value at Risk is a measurement of risk firstly used by J.P. Morgan as an internal risk management system to illuminate the next-day potential losses on the bank’s entire portfolio. (Ruppert 2004, p. 346) Later, Value at Risk is widely used around the world for its flexibility to assess various risks of all types of securities. There are two kinds of Value at Risk, namely nonparametric and parametric VaR.
Nonparametric VaR is also known as quantile of a distribution. It is the value below which lies of the values, where is the confidence level. For instance, 5%, =− × ( ℎ 5% a s) means that we are 95% sure that the largest loss of investment should not exceed S total investment times the 5% lowest return in T periods. Non-parametric VaR suits when the return of the security is following a non-parametric distribution. The non-parametric VaR is mainly concerning the historical data of the security return. (Ruppert 2004, p. 346-347)
If the return of security is following a parametric distribution, e.g. normal distribution, parametric VaR is a more appropriate method compare to nonparametric VaR. The parametric VaR is more accurate comparing to the non-paramentric one.
) means that the largest loss of the security is total investment times 5% quantile of the return in T periods (Ruppert, 2004, p. 348).
Furthermore, bot parametric VaR and nonparametric VaR can be recognized as either relative or absolute (Jorion, 2007, p.108). Relative VaR is measuring how much money can be lost comparing to the project average return, while absolute VaR is the money lost relative to zero or without reference to the expected value (Jorion, 2007, p.108). The non-parametric VaR we mentioned above is absolute VaR, while the parametric one belongs to relative VaR. In this paper, assumed that we invest same amount of endowment into each individual stock and we are mainly concern about the stocks that have normal distribution returns. Considering that for normally distributed returns, parametric VaR provides a more precise picture of the risk level together with our interest of the relative loss based on stocks’ potential returns. We are employing relative parametric VaR to our study.
3.1.6 Anomalies:
Anomalies or market inefficiency are found by empirical results that seem to be inconsistent the hypothesis of market efficiency (Schwert, 2003 p,940). In EMH, there is no possibility to obtain any abnormal returns if it is a strong-form market. Henceforth, it is impossible to observe any anomalies. In fact, none of real markets are running in the strong-forms. It is interesting to observe that some factors become anomalies in the global markets.
Here, in this paper, we categorize anomalies to five segments: time effect, size effect, value effect, momentum effect and other anomalies. These are widely known and observed in the western capital markets. We provide this information as important references for the challenge of the Efficient Market Hypothesis.
3.1.6.1 Time Effects
The time effect or seasonality is concerned about that investor can obtain abnormal returns by investing in particular period of time. In other word, the price of securities may follow a pattern based on the time horizon. Then investors could predict the price of securities. This is inconsistent with the weak-form efficiency. The time effect includes: the weekend effect, turn-of-month effect, January effect, turn of year effect, and other calendar effects.
In 1980, French (1980) observed that the average return to the S&P composite portfolio was consistently negative over weekends in the period 1953-1977; this effect is named as weekend effect. In the period of 1978 to 2002, the weekend effect is materially less than the previous period and not significant different from other weekdays. The effect seems to have disappeared or attenuated since its first documentation in 1980.
Turn of the Month Effect shows that the stocks returns are climbing up around the turn of the month. According to McConnell and Xu (McConnell & Xu, (2009)) ‘turn-of-the-month is defined as beginning with the last trading day of the month and ending with the third trading day of the following month.’ Frank Russell and Co. (Hensel & Ziemba, (1996)) have examined the returns of the S&P 500 over 65 years finding that U.S. large-cap stocks regularly gain more returns at the turn of the month. Together with other research, most of the positive return to stocks ensued during the turn-of-the-month interval for over 109 years.
According to Haugen and Jorion (Haugen & Jorion, (1996)) January month is conceivably the best known of anomalies behavior in security markets, and historically generates the highest abnormal returns in stocks as general. The reason of January effect is different from country to country. In America the effect can be explained that
investors tend to sell their securities in December due to the tax-loss selling (Roll, (1983)). Although, some countries do not use December 31st as tax-year end, the January effect still exists.
Turn of the year Effect is quite similar to January Effect. Keim (1983) and Reinganum (1983) investigated that the abnormal return to small firms occurs during the first two weeks in January. This can also be explained by Roll’s tax-loss selling hypothesis, since the small-cap companies have a high level of volatility and investors may suffer substantial short-term losses.
3.1.6.2 Size Effect
The size effect was firstly documented by Banz (1981) and Reinganum (1981). They found that small-capitalization firms in New York Stock Exchange (NYSE) were more profitable than those largest companies on average by using capital asset-pricing model (CAPM) from 1931-1975 (Schwert, 2003). The risk parameter of small firms may be underestimated and argued as the reason of size effect (Roll 1981 and Reinganum 1981). Christie and Hertzel (1981) explained that the current economic risk might be different from the historical risk for small-cap companies. The small-cap firms are becoming more and more risky considering their low level of survival probability, while the risk of CAPM model is associated with previous data. The risks of small-cap firms are underestimated by utilizing CAPM model.
In this paper, we study the companies listed in Chinese stock markets both state-owned and private. There is absolutely size disparity into those companies listed. The state-owned tend to be larger than the private. Besides, institutional investors are more in favor of state-owned companies, while individual investors prefer to put their money in private companies. Hence, we think size effect is interesting to observe in our study.
3.1.6.3 Value Effect:
According to Basu (1977, 1983) the anomaly of value effect states to the observation that firms with high earnings-to-price (E/P) ratios generate positive abnormal returns relative to CAPM. Including high dividend yields (D/P) stocks or stocks with high book-to-market (B/M) values in the portfolios are two strategies that may produce positive abnormal returns. These abnormal returns are related to the fundamental value of the companies. It stands for weak-form efficiency but challenges the semi-strong and strong forms. The value effect is argued that it is a fault in CAPM model rather than market inefficiency. Ball (1978) observed the evidence that supports this argument. And many other international researches are supporting the value effect by the data from different countries.
Fama and French (1992, 1993) considered that the size and value (in terms of book-to-market value of common stock) are two risk factors, which are missed from the CAPM model. Fama and French developed a three-factor model to improve the CAPM model by identifying the effects from size and fundamental value. The three-factor model is showing as follow:
, [3.6] Where:
is the expected return of portfolio by adjusted the risk. is abnormal performance.
is measuring the exposure to market risk. is the market risk premium.
is the return difference between portfolios of small- and large- cap companies. denotes the return difference between portfolios of high and low B/M ratio firms. and are regression coefficients related to and .
While is the noise.
Some may criticize about the three-factor-model. Since the model is based on the data of stocks from U.S. market, the model may be country specific (Griffin 2002). Data snooping is the other question raised by critics. Researchers also argue that the three-factor-model is conflicting with the observed Momentum Effects. The reason that the size and value indicators (B/M ratio) are risk proxies are not explained in Fama and French studies.
3.1.6.4 Momentum Effects
There are two momentum effects: Debondt and Thaler (1985) found the ‘contrarian’ effect whereby past losers (stocks with low returns in past three to five years) have higher average returns than past winners (stocks with high returns in past three to five years); while ‘continuation’ effect was observed by Jegadeesh and Titman in 1993 that recent past winner (portfolios formed on the last year of past returns) out-perform recent past losers.
3.1.6.5 Other Anomalies
Announcement Based Effects and Post-earning announcement drift (PEAD)
Both announcement based effects and Post-earning announcement drift are concerning that the market is reacting to the new information with lags. The market had to take three or four weeks to react to the new information in the 80’s, and it accelerated to two days currently. The new technologies (e.g., computer, internet) facilitate to achieve information diffusion and to react more efficiently.
IPO’s offerings and buy-backs
When the company comes to the Initial Public Offering (IPO) procedure, it is most likely that it faces two IPO-related anomalies: the IPO underpricing anomaly and the post-IPO underperformance anomaly. The first named anomaly is mainly coursed by spread offering price and the secondary market price, according to Ogden (2003, p.410). The second anomaly states that the IPOs underperform other stocks in the aftermarket for up to three years. Some studies explain that the Post-IPO underperformance is linked to small firm and low book-to-market ratio. Thus, it may be another symptom of size effect or value effect.
Insider transactions:
The relationship between transactions by managers and directors of the firms and the stock’s performance are documented many researches. Insider buying is considered as a signal that the insiders believe that the stocks of their firm are undervalued. Many researchers’ questions are still including: whether the gains are significant and whether they will occur in the future. The insider transactions are consistent with strong form efficiency, but most countries prevent this kind of trading. In addition, institutional investors can be recognized as insiders since they are digging deep into the companies and have more private information compared to the public. Numerous studies emphasize that the institutional investors improve the market efficiency by trading the stocks based on the information they obtained. This is the starting point of our research, considering that the government companies would only trade their stocks in rare cases no matter the performance of the companies or information they got. This is on the opposite side of institutional investors. Hence, it is interesting to discover how government ownership affects the market efficiency.
The S&P Game:
Shleifer, Harris and Gurel in 1986 figured that the stocks upswing immediately after being added to S&P 500 index. This appearance is repetitively observed by other researchers. The recent studies are also discussing about other indexes.
Liquidity, transaction cost and intra-day trading are also believed as anomaly factors, since our research is mainly focusing on the informative efficiency, they will be excluded.
Additionally, most anomalies can be explained by data snooping. This phenomenon is about the result of certain researches are only applicable for the samples they collected or a particular time period in their studies. Some of the mentioned effects are disappeared or attenuated since they were first documented (Schwert 2003). The knowledge of anomalies benefit the investors if they utilize the strategy to arbitrage based on these anomalies. Therefore, the arbitrage position does no longer exist.