Rapport 26 - 2013
Foto:
Karin Jacobsson
by Laurence Nachin, Christina Normark and Irina Boriak
Proficiency testing
Food Microbiology
Internal and external control for microbiological analyses of food and drinking
water
All analytical activities require work of a high standard that is accurately documented.
For this purpose, most laboratories carry out some form of internal quality assurance,
but their analytical work also has to be evaluated by an independent party. Such external
quality control of laboratory competence is commonly required by accreditation bodies
and can be done by taking part in proficiency testing (PT).
In a proficiency test, identical test material is analysed by a number of laboratories
using their routine methods. The organiser evaluates the results and compiles them in a
report.
The National Food Agency’s PT program offers
External and independent evaluation of laboratories analytical competence.
Improved knowledge of analytical methods used by laboratories with respect to
various types of organisms.
Expert support
Tool for inspections regarding accreditation.
Free extra material for follow-up analyses
For more information visit our website: www.slv.se/absint
The National Food Agency’s reference material
As a complement to the proficiency testing, National Food Agency produces also
reference material (RM) for internal quality control: a total of 7 RM for food and
drinking water microbiological analyses, including pathogens, are available.
Information available on our website: www.slv.se/RM-micro
Edition
Version 1 (2013-11-26)
Editor in chief
Annika Rimland, Head of Science Department, National Food Agency
Responsible for the scheme
Laurence Nachin, Microbiologist, Microbiology Division, National Food Agency
PT October 2013 is registered as no. 2519/2013 at the National Food Agency, Uppsala.
Proficiency Testing
Microbiology – Food
October 2013
Quantitative analyses
• Aerobic microorganisms, 30 °C
• Aerobic microorganisms, 20 °C
• Contaminating microorganisms in dairy products
• Enterobacteriaceae
• Coliform bacteria 30 ºC
• Coliform bacteria 37 ºC
• Thermotolerant coliform bacteria
• Escherichia coli
• Presumptive Bacillus cereus
• Coagulase positive staphylococci
• Enterococci
Qualitative analyses
• Gram-negative bacteria in dairy products
Abbreviations
Media
BcS
Bacillus cereus Selective agar
BGB
Brilliant Green Broth
BP
Baird-Parker agar
BP
+RPF
Baird-Parker agar +
Rabbit Plasma Fibrinogen
EC medium
Escherichia coli medium
PCA
Plate count agar
MPCA
Milk Plate Count agar
MPN
Most Probable Number
MYP
Mannitol-Egg Yolk-Polymyxin agar
S&B
Slanetz & Bartley agar
TBX
Tryptone Bile X-Glucuronide agar
TSA
Trypticase Soy agar
TGE
Tryptone Glucose Extract agar
VRB
Violet Red Bile agar
VRBG
Violet Red Bile Glucose agar
Organisations
ISO
International Organization for Standardization
NMKL
Nordic Committee for Food Analyses
Contents
General information on results evaluation... 4
Results of the PT round October 2013 ... 5
- General outcome ... 5
- Aerobic microorganisms, 30 °C and 20 °C ... 6
- Contaminating microorganisms in dairy products ... 8
- Enterobacteriaceae ... 9
- Coliform bacteria 30 ºC and 37 ºC... 10
- Thermotolerant coliform bacteria.. ... 11
- Escherichia coli ... 12
- Presumptive Bacillus cereus ... 13
- Coagulase positive staphylococci ... 14
- Enterococci ... 15
- Gram-negative bacteria in dairy products ... 16
Outcome of the results of individual laboratory – assessment ... 17
- Box plot ... 17
Test material and quality control ... 23
- Test material ... 23
- Quality control of the mixtures ... 24
References ... 25
Annex 1: Results obtained by the participants
General information on results evaluation
Statistical evaluation of the results
Highly deviating values that did not belong to a strictly normal distribution were
identified as statistical outliers (Grubbs’ test modified by Kelly (1)). In some cases,
subjective adjustments were made to set limits, based on knowledge of the mixture’s
contents. Outliers and false results were not included in the calculations of means and
standard deviations. Results reported as “>value” were excluded from the evaluation.
Results reported as “<value” were interpreted as being zero (negative result). All
reported results are presented in Annex 1.
According to EN ISO/IEC 17043, for which the proficiency testing programme
organised by the National Food Agency is accredited since early 2012, it is mandatory
for the participating laboratories to give method information for all analyses for which
they report results. Method information is sometimes difficult to interpret, e.g. many
laboratories choose a medium that differs from that in the reported standard methods.
Therefore, in the following section, results have been grouped according to the method
or the medium used to perform the analysis.
Uncertainty of measurement for the assigned values
The uncertainty of measurement for an assigned value is calculated as the standard
deviation divided by the square root of the number of correct results (”standard error”).
The assigned value of evaluated parameters is the mean value of participants results.
Tables and figures legend
Tables
n
number of laboratory that performed the analysis
m
results mean value in log
10cfu/ml (false results and outliers excluded)
s
results standard deviation
F
number of false positive or false negative results
<
number of low outliers
>
number of high outliers
global results for the analysis
values discussed in the text
Figures
Histograms of all analytical results obtained for each mixture are presented. The mean value of
the analysis results is indicated in each histogram.
values within the interval of acceptance (Annex 1)
outliers
false negative results
Results of the PT round October 2013
General outcome
Samples were sent to 199 laboratories, 48 in Sweden, 134 in other European countries,
and 17 outside Europe. 197 laboratories reported results, 65 (33 %) provided at least one
result that received an annotation. In the previous round (October 2012) with similar
analyses, the proportion was 50 %.
Individual results for each analysis of the PT round are listed in annex 1 and are also
available on the website after logging in: www.slv.se/absint/index.aspx .
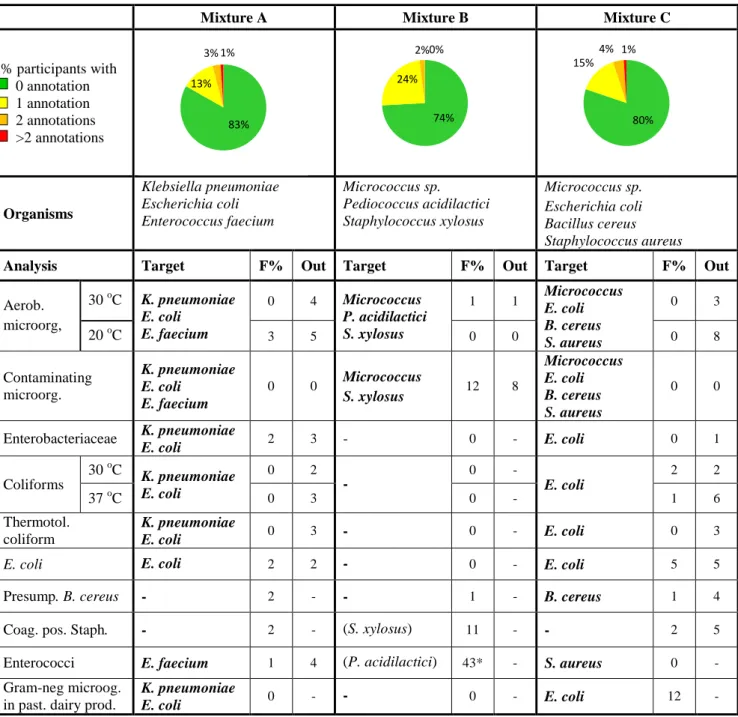
Table 1 Microorganisms in each mixture and % of deviating results (F%: false positive
or false negative, Out: outliers).
Mixture A
Mixture B
Mixture C
% participants with
0 annotation
1 annotation
2 annotations
>2 annotations
Organisms
Klebsiella pneumoniae
Escherichia coli
Enterococcus faecium
Micrococcus sp.
Pediococcus acidilactici
Staphylococcus xylosus
Micrococcus sp.
Escherichia coli
Bacillus cereus
Staphylococcus aureus
Analysis
Target
F%
Out Target
F%
Out Target
F%
Out
Aerob.
microorg,
30
oC
K. pneumoniae
E. coli
E. faecium
0
4
Micrococcus
P. acidilactici
S. xylosus
1
1
Micrococcus
E. coli
B. cereus
S. aureus
0
3
20
oC
3
5
0
0
0
8
Contaminating
microorg.
K. pneumoniae
E. coli
E. faecium
0
0
Micrococcus
S. xylosus
12
8
Micrococcus
E. coli
B. cereus
S. aureus
0
0
Enterobacteriaceae
K. pneumoniae
E. coli
2
3
-
0
-
E. coli
0
1
Coliforms
30
oC
K. pneumoniae
E. coli
0
2
-
0
-
E. coli
2
2
37
oC
0
3
0
-
1
6
Thermotol.
coliform
K. pneumoniae
E. coli
0
3
-
0
-
E. coli
0
3
E. coli
E. coli
2
2
-
0
-
E. coli
5
5
Presump. B. cereus
-
2
-
-
1
-
B. cereus
1
4
Coag. pos. Staph.
-
2
-
(S. xylosus)
11
-
-
2
5
Enterococci
E. faecium
1
4
(P. acidilactici)
43*
-
S. aureus
0
-
Gram-neg microog.
in past. dairy prod.
K. pneumoniae
E. coli
0
-
-
0
-
E. coli
12
-
- : no target organism or no value; (microorganism): false positive; * analysis not evaluated
83%
13%
3% 1%
74%
24%
2% 0%
80%
15%
4% 1%
Aerobic microorganisms, 20 °C and 30 °C
Mixture A
The colonies counted for these analyses were mainly from the strains of Enterococcus
faecium present at the highest concentration in mixture A.
Mixture B
The colonies counted for these analyses were mainly from the strains of Pediococcus
acidilactici and Staphylococcus xylosus present at the highest concentration in mixture
B. At NFA, P. acidilactici formed smaller colonies, especially under incubation at 20
°C
which could explain the quite large distribution of the results.
Mixture C
The colonies counted for these analyses were mainly from the strains of Micrococcus
sp. and Staphylococcus aureus present at the highest concentration in mixture C.
Results of aerobic microorganisms analysis, 20 °C
Medium
Mixture A
Mixture B
Mixture C
n
m
s
F < >
n
m
s
F < >
n
m
s
F < >
Total
36
4.01 0.09 1 0 2
36
4.10 0.40 0 0 0
36
4.69 0.19 0 2 1
PCA
27
4.01 0.10 1 0 2
27
4.19 0.40 0 0 0
27
4.66 0.21 0 2 1
Petrifilm
™3
4.02 0.07 0 0 0
3
3.84 0.08 0 0 0
3
4.74 0.02 0 0 0
A
A
B
B
C
C
0 5 10 15 20 2 2,5 3 3,5 4 4,5 5 5,5 6 log 10 CFU per ml 4,0 ↓ N o of r e s ul ts * 0 5 10 15 20 2 2,5 3 3,5 4 4,5 5 5,5 6 PCA Petrifilm N o of r es ul tslog10 CFU per ml
* 0 5 10 15 20 2 2,5 3 3,5 4 4,5 5 5,5 6
log10 CFU per ml
4,1 ↓ N o of r e s ul ts 0 5 10 15 20 2 2,5 3 3,5 4 4,5 5 5,5 6 PCA Petrifilm N o of r es ul ts
log10 CFU per ml
0 5 10 15 20 2 2,5 3 3,5 4 4,5 5 5,5 6
log10 CFU per ml
4,7 ↓ N o of r e s ul ts 0 5 10 15 20 2 2,5 3 3,5 4 4,5 5 5,5 6 PCA Petrifilm N o of r es ul ts log 10 CFU per ml
Results of aerobic microorganisms analysis, 30 °C
Medium
Mixture A
Mixture B
Mixture C
n
m
s
F < >
n
m
s
F < >
n
m
s
F < >
Total
186
4.04 0.09 0 2 6 186
4.26 0.26 1 0 1 186
4.83 0.12 0 3 2
PCA
104
4.03 0.09 0 1 5 104
4.35 0.22 1 0 1 104
4.84 0.12 0 3 2
Petrifilm
™35
4.06 0.08 0 0 1
35
4.03 0.18 0 0 0
35
4.81 0.12 0 0 0
MPCA
23
4.04 0.06 0 0 0
23
4.36 0.11 0 0 0
23
4.83 0.07 0 0 0
TSA
12
4.05 0.10 0 0 0
12
4.21 0.25 0 0 0
12
4.86 0.10 0 0 0
TGE
5
4.00 0.13 0 1 0
5
4.21 0.31 0 0 0
5
4.80 0.14 0 0 0
TEMPO
4
3.92 0.05 0 0 0
4
3.92 0.32 0 0 0
4
4.72 0.14 0 0 0
A
A
B
B
C
C
Overall, there is no clear differences in results depending on the medium chosen for
mixtures A and C. For mixture B, the results are more spread and form two distinct
peaks for incubation at 30
°C; the peak with lower values being linked to the use of
Petrifilm
™
. The average values obtained with Petrifilm
™
at both 30
°C and 20°C
correspond approximately to the concentration of S. xylosus present in mixture B which
suggests that the strain of P. acidilactici might not form visible colonies on Petrifilm
™
and would explain the lower average values and standard deviation obtained.
The few laboratories using the MPN-based method Tempo
®
obtained lower average
values for all mixtures for the analysis performed at 30
°C.
0 30 60 90 120 2 2,5 3 3,5 4 4,5 5 5,5 6 log 10 CFU per ml 4,0 ↓ N o of r e s ul ts 0 30 60 90 120 2 2,5 3 3,5 4 4,5 5 5,5 6 PCA Petrifilm MPCA TSA N o of r es ul ts log 10 CFU per ml 0 20 40 60 80 2 2,5 3 3,5 4 4,5 5 5,5 6
log10 CFU per ml
4,3 ↓ N o of r e s ul ts * * 0 20 40 60 80 2 2,5 3 3,5 4 4,5 5 5,5 6 PCA Petrifilm MPCA TSA N o of r es ul ts log 10 CFU per ml * * 0 25 50 75 100 2 2,5 3 3,5 4 4,5 5 5,5 6 log 10 CFU per ml 4,8 ↓ N o of r e s ul ts 0 25 50 75 100 2 2,5 3 3,5 4 4,5 5 5,5 6 PCA Petrifilm MPCA TSA N o of r es ul ts log 10 CFU per ml
Contaminating microorganisms in dairy products
Mixture A
At NFA, we counted three morphologically different types of colonies, indicating that
the three strains present in mixture A can form colonies on sugar-free agar, i.e.
Enteroccoccus faecium, Klebsiella pneumoniae and Escherichia coli.
Mixture B
At NFA, three types of colonies could be distinguished, indicating that the three strains
present in mixture B can form colonies on sugar-free agar, i.e. Pediococcus acidilactici,
Staphylococcus xylosus and Micrococcus sp. However the colonies of P. acidilactici
were extremely small (pin-point) and should therefore not be counted according to the
method ISO 13559:2002 / IDF 153:2002.
Mixture C
As for the analysis of aerobic microorganisms, colonies were mainly from the strains of
Micrococcus sp. and S. aureus.
Results of contaminating microorganisms analysis
Method
Mixture A
Mixture B
Mixture C
n
m
s
F < > n
m
s
F < > n
m
s
F < >
Total
23 3.78 0.31 0 0 0 24 3.78 0.15 3 1 1 24 4.49 0.52 0 0 0
ISO 13559:2002 11 3.85 0.26 0 0 0 12 3.77 0.10 0 0 1 12 4.74 0.13 0 0 0
Other
12 3.72 0.35 0 0 0 12 3.79 0.21 3 1 0 12 4.23 0.65 0 0 0
A
A
B
B
C
C
0 5 10 15 20 2 2,5 3 3,5 4 4,5 5 5,5 6 log 10 CFU per ml 3,8 ↓ N o of r e s ul ts 0 5 10 15 20 2 2,5 3 3,5 4 4,5 5 5,5 6 ISO 13559:2002 / IDF 153:2002 Other N o of r es ul ts log 10 CFU per ml 0 5 10 15 20 2 2,5 3 3,5 4 4,5 5 5,5 6 log 10 CFU per ml 3,8 ↓ N o of r e s ul ts * 0 5 10 15 20 2 2,5 3 3,5 4 4,5 5 5,5 6 ISO 13559:2002 / IDF 153:2002 Other N o of r es ul ts log 10 CFU per ml * 0 5 10 15 20 2 2,5 3 3,5 4 4,5 5 5,5 6 log 10 CFU per ml 4,5 ↓ N o of r e s ul ts 0 5 10 15 20 2 2,5 3 3,5 4 4,5 5 5,5 6 ISO 13559:2002 / IDF 153:2002 Other N o of r es ul ts log 10 CFU per mlFew laboratories participate in this analysis and the results are spread for all mixtures.
Half of the laboratories reported to follow the standard method ISO 13559:2002 / IDF
153:2002, but all used the same medium, sugar-free agar.
Enterobacteriaceae
Mixture A
Two target-organisms were present in the mixture: Escherichia coli and Klebsiella
pneumoniae.
Mixture B
Mixture B did not contain any target-organism for this analysis.
Mixture C
A strain of Escherichia coli was target-organism for the analysis.
Results of enterobacteriaceae analysis
Medium
Mixture A
Mixture B
Mixture C
n
m
s
F
< >
n
m s
F
< >
n
m
s
F
<
>
Total
148
3.37 0.12
3
4 0 147
- -
1
- -
148
3.02 0.16
0
0
2
VRBG
109
3.36 0.12
2
3 0 109
- -
1
- -
109
2.99 0.17
0
0
1
Petrifilm
™33
3.39 0.12
0
0 0
32
- -
0
- -
33
3.11 0.11
0
0
0
A
A
C
C
For mixture C, the laboratories using Petrifilm
™
reported values slightly higher than
those using VRBG. It is possible that the indicator dye present in Petrifilm
™
facilitated
the reading of colonies and therefore led to a higher count for mixture C.
0 15 30 45 60 2 2,5 3 3,5 4 4,5 5 5,5 6
log10 CFU per ml
3,4 ↓ N o of r e s ul ts * 0 20 40 60 2 2,5 3 3,5 4 4,5 5 5,5 6 VRBG Petrifilm N o of r es ul ts log 10 CFU per ml * 0 15 30 45 60 2 2,5 3 3,5 4 4,5 5 5,5 6 log 10 CFU per ml 3,0 ↓ N o of r e s ul ts 0 20 40 60 2 2,5 3 3,5 4 4,5 5 5,5 6 VRBG Petrifilm N o of r es ul ts log 10 CFU per ml
Coliform bacteria 30 °C and 37 °C
Mixture A
Both Escherichia coli and Klebsiella pneumoniae were target-organisms for thes
analyses.
Mixture B
Mixture B did not contain any target-organism.
Mixture C
A strain of Escherichia coli was target-organism for these analyses
Results of coliform bacteria analysis, 30 °C
Medium
Mixture A
Mixture B
Mixture C
n
m
s
F < > n
m
s F < > n
m
s
F < >
Total
63 3.31 0.13 0 0 1 62
-
- 0
- - 63 2.99 0.16 1 0 1
VRB
42 3.30 0.13 0 0 1 41
-
- 0
- - 42 2.96 0.15 0 0 1
TSA/VRB
7
3.37 0.10 0 0 0
7
-
- 0
- -
7
3.07 0.26 0 0 0
Petrifilm
™CC
5
3.34 0.13 0 0 0
5
-
- 0
- -
5
3.07 0.11 1 0 0
Petrifilm
™EC/CC
4
3.32 0.01 0 0 0
4
-
- 0
- -
4
3.05 0.17 0 0 0
A
A
C
C
Results of coliform bacteria analysis, 37 °C
Medium
Mixture A
Mixture B
Mixture C
n
m
s
F < >
n
m s F < >
n
m
s
F < >
Total
105
3.36 0.18 0 2 1 106
- - 0 - -
105
3.03 0.17 1 4 2
VRB
51
3.36 0.16 0 1 1
51
- - 0 - -
50
2.98 0.16 0 2 1
TSA/VRB
10
3.45 0.18 0 0 0
10
- - 0 - -
10
3.11 0.15 0 0 0
Petrifilm
™CC
15
3.41 0.11 0 0 0
14
- - 0 - -
14
3.13 0.06 0 0 1
Petrifilm
™EC/CC
14
3.40 0.10 0 0 0
14
- - 0 - -
14
3.09 0.14 0 0 0
BGB
6
3.27 0.32 0 1 0
7
- - 0 - -
6
3.05 0.25 0 1 0
0 10 20 30 40 2 2,5 3 3,5 4 4,5 5 5,5 6 log 10 CFU per ml 3,3 ↓ N o of r e s ul ts 0 10 20 30 40 2 2,5 3 3,5 4 4,5 5 5,5 6 VRB TSA / VRB N o of r es ul ts log 10 CFU per ml 0 10 20 30 40 2 2,5 3 3,5 4 4,5 5 5,5 6 log 10 CFU per ml 3,0 ↓ N o of r e s ul ts * 0 10 20 30 40 2 2,5 3 3,5 4 4,5 5 5,5 6 VRB TSA / VRB N o of r es ul ts log 10 CFU per mlA
A
C
C
The analysis of coliform bacteria did not cause any difficulties and the results reported
are similar independently of the medium used.
Thermotolerant coliform bacteria
Mixture A
Both Escherichia coli and Klebsiella pneumoniae are thermotolerant coliform bacteria.
Mixture B
Mixture B did not contain any target-organism for the analysis.
Mixture C
A strain of Escherichia coli was target-organism.
Results of thermotolerant coliforms analysis
Medium
Mixture A
Mixture B
Mixture C
n
m
s
F < >
n
m
s F < > n
m
s
F < >
Total
59 3.36 0.17 0 1
1
59
-
- 0
- - 60 3.10 0.13 0 1 1
TSA/VRB
28 3.43 0.13 0 1
1
28
-
- 0
- - 28 3.14 0.11 0 0 0
VRB
13 3.31 0.12 0 0
0
13
-
- 0
- - 13 3.10 0.12 0 0 0
EC medium
7
3.29 0.32 0 0
0
7
-
- 0
- -
8
3.05 0.22 0 1 1
Petrifilm
™EC/CC
5
3.38 0.17 0 0
0
5
-
- 0
- -
5
3.04 0.07 0 0 0
0 10 20 30 40 2 2,5 3 3,5 4 4,5 5 5,5 6 log 10 CFU per ml 3,4 ↓ N o of r e s ul ts 0 10 20 30 40 2 2,5 3 3,5 4 4,5 5 5,5 6 VRB Petrifilm CC Petrifilm EC/CC TSA / VRB N o of r es ul ts log 10 CFU per ml 0 10 20 30 40 2 2,5 3 3,5 4 4,5 5 5,5 6 log 10 CFU per ml 3,0 ↓ N o of r e s ul ts * 0 10 20 30 40 2 2,5 3 3,5 4 4,5 5 5,5 6 VRB Petrifilm CC Petrifilm EC/CC TSA / VRB N o of r es ul ts log 10 CFU per ml *A
A
C
C
Laboratories following an MPN-based method with the use of EC medium obtained
results more spread, some of which were identified as outliers for mixture C.
Escherichia coli
Mixture A
Both Escherichia coli and Klebsiella pneumoniae are thermotolerant coliform bacteria.
At NFA, two types of colonies could clearly be distinguished on TSA/VRBG after
incubation at 44
°C. Both fermented lactose at 44°C, but only one type was positive for
the indol test, i.e. colonies from the strain of E. coli.
Mixture B
Mixture B did not contain any target-organism.
Mixture C
A strain of Escherichia coli was target-organism for this analysis
Results of E.coli analysis
Medium
Mixture A
Mixture B
Mixture C
n
m
s
F < >
n
m s F < >
n
m
s
F < >
Total
126
3.16 0.20 3 1 1 131
- - 0 - -
129
3.09 0.16 7 5 1
Petrifilm
™EC/CC
34
3.09 0.14 0 0 0
34
- - 0 - -
34
3.09 0.15 1 1 0
Petrifilm
™S
EC
17
3.16 0.12 0 0 0
17
- - 0 - -
17
3.15 0.08 1 1 0
TSA/VRB
22
3.30 0.16 1 0 0
22
- - 0 - -
22
3.13 0.16 0 0 0
VRB
14
3.18 0.26 1 0 1
14
- - 0 - -
14
3.08 0.12 1 0 1
TBX
14
3.00 0.16 0 0 0
15
- - 0 - -
15
2.93 0.14 0 2 0
0 5 10 15 20 25 2 2,5 3 3,5 4 4,5 5 5,5 6 log 10 CFU per ml 3,4 ↓ N o of r e s ul ts 0 5 10 15 20 25 2 2,5 3 3,5 4 4,5 5 5,5 6 TSA / VRB VRB EC medium N o of r es ul ts log 10 CFU per ml 0 5 10 15 20 25 2 2,5 3 3,5 4 4,5 5 5,5 6 log 10 CFU per ml 3,1 ↓ N o of r e s ul ts 0 5 10 15 20 25 2 2,5 3 3,5 4 4,5 5 5,5 6 TSA / VRB VRB EC medium N o of r es ul ts log 10 CFU per mlA
A
C
C
There is no statistically significant difference between the reported results depending on
the medium used. However it can be noticed that the use of chromogenic medium TBX
led to lower results compared to the total average: 3.00 versus 3.16 and 2.93 versus 3.09
for mixture A and C, respectively. On this medium which reveals the presence of
β-glucuronidase activity, only colonies of E. coli appear typical (K. pneumoniae does not
produce
β-glucuronidase enzyme). For mixture A, higher results were reported with
TSA/VRB. On VRB with or without TSA, E. coli and K. pneumoniae form typical
colonies that could be counted as E. coli if confirmation is not performed or performed
only on colonies of E. coli.
Presumptive Bacillus cereus
Mixture A
Mixture A did not contain any target-organism for this analysis.
Mixture B
Mixture B did not contain any target-organism for this analysis
Mixture C
Mixture C contained a typical strain belonging to the Bacillus cereus group.
Results of presumptive B. cereus analysis
Method
Mixture A
Mixture B
Mixture C
n
m
s
F
< >
n
m
s F < >
n
m
s
F < >
Total
128
-
-
2
- -
127
-
- 1 - -
127
3.52 0.18 1 4 1
NMKL 67:2010
77
-
-
0
- -
77
-
- 0 - -
76
3.54 0.16 1 3 1
ISO 7932:2004
22
-
-
0
- -
22
-
- 0 - -
23
3.45 0.21 0 0 0
0 10 20 30 40 2 2,5 3 3,5 4 4,5 5 5,5 6 log 10 CFU per ml 3,2 ↓ N o of r e s ul ts * 0 10 20 30 40 2 2,5 3 3,5 4 4,5 5 5,5 6 Petrifilm EC/CC Petrifilm SEC TSA / VRB VRB TBX N o of r es ul ts log 10 CFU per ml * 0 10 20 30 40 2 2,5 3 3,5 4 4,5 5 5,5 6 log 10 CFU per ml 3,1 ↓ N o of r e s ul ts * 0 10 20 30 40 2 2,5 3 3,5 4 4,5 5 5,5 6 Petrifilm EC/CC Petrifilm SEC TSA / VRB VRB TBX N o of r es ul tslog10 CFU per ml
C
C
The NMKL method 67:2010 describes the confirmation of suspected colonies from
blood-agar plates on BcS agar or Cereus-Ident-Agar (chromogenic medium) while the
ISO method 7932:2004 describes first an isolation on MYP medium followed by a
confirmation of suspected colonies on blood-agar. The results obtained with the ISO
method are distributed in a peak slightly shifted towards lower values compared to the
results obtained with the NMKL method.
Coagulase-positive Staphylococci
Mixture A
Mixture A did not contain any target-organism for this analysis.
Mixture B
There was no target-organism for this analysis but a strain of Staphylococcus xylosus
was included. Twelve laboratories reported a false positive result. On BP-agar, colonies
could be suspected as coagulase positive staphylococci but they were negative when
further tested for coagulase activity. On BP-agar with RPF, colonies of S. xylosus are
atypical without precipitation zone.
Mixture C
A strain of Staphylococcus aureus was target-organism for this analysis.
Results of coagulase-positive Staphylococci analysis
Medium
Mixture A
Mixture B
Mixture C
n
m
s F < >
n
m
s
F
< >
n
m
s
F < >
Total
118
-
- 3 - -
114
-
- 12 - -
118
4.60 0.12 2 4 2
BP
75
-
- 1 - -
71
-
-
9
- -
75
4.59 0.12 1 4 2
BP + RPF
21
-
- 0 - -
21
-
-
3
- -
21
4.65 0.10 1 0 0
Petrifilm
™S
taph
15
-
- 1 - -
15
-
-
0
- -
15
4.60 0.11 0 0 0
C
C
0 10 20 30 40 2 2,5 3 3,5 4 4,5 5 5,5 6 log 10 CFU per ml 3,5 ↓ N o of r e s ul ts * 0 10 20 30 40 2 2,5 3 3,5 4 4,5 5 5,5 6 NMKL 67:2010 ISO 7932:2004 N o of r es ul ts log 10 CFU per ml * 0 15 30 45 60 2 2,5 3 3,5 4 4,5 5 5,5 6 log 10 CFU per ml 4,6 ↓ N o of r e s ul ts * 0 15 30 45 60 2 2,5 3 3,5 4 4,5 5 5,5 6 BP BP+RPF Petrifilm N o of r es ul ts log 10 CFU per ml *Almost all laboratories that reported a false positive result for mixture B used BP agar
which indicates that confirmation was not performed or failed. For mixture C, there is
no difference in results depending on the medium used.
Enterococci
Mixture A
A strain of Enterococcus faecium was target-organism for this analysis.
Mixture B
Mixture B did not contain any Enterococci. At NFA, the strain of Pediococcus
acidilactici present in mixture B formed pinkish colonies on Slanetz-Bartley medium.
Colonies inoculated on BEA agar did not hydrolyse esculine after 2 hours of incubation
at 44°C but a black color could be seen in the medium after 24 hours of incubation.
These characteristics might explain that 43 % of the laboratories that performed the
analysis reported a positive result.
Due to the difficulty in the analysis interpretation, the results are not evaluated and
therefore no z-scores are calculated. Moreover, these results are not taken into account
in the tables under the box plots.
Mixture C
Mixture C did not contain any target-organism for this analysis.
Results of enterococci analysis
Medium
Mixture A
Mixture B
Mixture C
n
m
s
F < > n
m
s
F
< >
n
m
s
F < >
Total
78 3.93 0.13
1
0 3 77
-
-
33 -
-
77
-
-
0 - -
S&B
59 3.92 0.14
1
0 2 59
-
-
26 -
-
59
-
-
0 - -
TSA/S&B
9
3.93 0.08
0
0 0
8
-
-
5
-
-
8
-
-
0 - -
A
A
Most of the laboratories performing the analysis of enterococci followed the method
NMKL 68:2011 and /or used S&B agar. Therefore, the high proportion of false positive
results for mixture B cannot be linked to any particular method or medium but must be
accounted for the characteristics of the P. acidilactici strain present in the mixture.
0 10 20 30 40 2 2,5 3 3,5 4 4,5 5 5,5 6
log10 CFU per ml
3,9 ↓ N o of r e s ul ts * 0 10 20 30 40 2 2,5 3 3,5 4 4,5 5 5,5 6 S&B TSA / S&B N o of r es ul ts log 10 CFU per ml *
Gram-negative bacteria in pasteurized milk and cream. Detection of
recontamination.
Mixture A
Both Escherichia coli and Klebsiella pneumoniae were target-organisms for this
analysis.
Mixture B
Mixture B did not contain any target-organism for this analysis.
Mixture C
E. coli was target-organism for this analysis
Results of gram-negative bacteria in dairy products analysis
Method
Mixture A
Mixture B
Mixture C
n
m
s
F
< >
n
m s
F
< >
n
m
s F <
>
Total
8
-
-
0
-
-
8
-
-
0
-
-
8
-
- 1
-
-
NMKL 192:2011
6
-
-
0
-
-
6
-
-
0
-
-
6
-
- 1
-
-
The method NMKL 192:2011 describes a qualitative analysis for the detection of
recontamination of dairy products by gram-negative bacteria. The method consists of a
pre-
incubation at 25˚C, 24h or at room temperature, 28h, followed by streaking 10 or
100µl of the sample on VRBG, respectively.
Outcome of the results of individual laboratory - assessment
In order to allow comparison of the results from different analyses and mixtures, all the
results of the analyses were transformed into standard values (z-scores). For quantitative
analyses, a z-score is either positive or negative, depending on whether the individual
result is higher or lower than the mean value calculated from all laboratories results for
each analysis. For qualitative analyses, a z-score of zero is attributed for a correct
answer. The z-scores obtained, which are listed in Annex 2, can be used as a tool by
laboratories when following up on the results.
All the results from each laboratory – outliers included and false results excluded – were
compiled into a box plot based on their z-scores. The smaller and the more centred
around zero the box of a laboratory is, the closer its results are to the general mean
values calculated for all laboratories results.
The laboratories were not grouped or ranked based on their results. However, for each
laboratory, the numbers of false results and outliers are presented below the box plots.
These results are also highlighted in Annex 1, where all the reported results are listed,
and the minimum and maximum accepted values for each analysis are stated.
Information on the results processing and recommendations for follow-up work are
given in the Scheme Protocol (2). Samples for follow-up can be ordered, free of charge
via our website:www.slv.se/pt_extra
Box plots and numbers of deviating results for each laboratory
- The plots are based on the laboratory results from all analyses transformed into
z-scores calculated according to the formula: z = (x-m)/s, where x is the result of the
individual laboratory, m is the mean of the results of all participating laboratories,
and s is the standard deviation.
- Correct results for quantitative analyses without target organism and for qualitative
analyses generate a z-value of 0.
- The laboratory median value is illustrated by a horizontal red line in the box.
- The box includes 50 % of a laboratory’s results (25 % of the results above the
median and 25 % of the results below the median). The remaining 50 % are
illustrated by lines and circles outside the box.
- Very deviating results are represented by circles and are calculated as follow:
the
lowest result in the box − 1.5 × (the highest result in the box − the lowest result in
the
box) or the highest result in the box + 1.5 × (the highest result in the box − the
lowest result in the box). z-scores high
er than +4 and less than −4 are positioned at
+4 and −4, respectively, in the plot.
- The background is divided by lines and shaded fields to indicate ranges in order to
18 Livsmedelsverkets rapport nr 26/2013
z
-scor
e
Lab no
1081
1149
1254
1594
1970
2035
2058
2072
2324
2350
2386
2402
2459
2505
2553
2637
2659
2670
2704
2720
No. of results
15
18
20
26
29
14
9
26
17
5
20
12
18
15
10
24
12
13
18
6
False positive
-
-
-
-
-
-
-
-
-
-
-
-
-
-
-
-
-
-
-
-False negative
-
-
-
-
-
1
-
-
-
1
1
-
-
-
-
-
-
2
-
-Low outliers
-
-
-
-
-
-
-
-
-
-
-
-
-
-
-
-
-
1
-
-High outliers
-
-
-
-
-
-
-
2
-
-
-
-
-
-
-
-
1
1
-
-z
-scor
e
Lab no
2745
2757
2764
2842
2920
2941
3055
3159
3225
3243
3305
3327
3346
3452
3457
3511
3533
3543
3587
3588
No. of results
23
15
14
15
9
12
12
18
12
6
17
12
24
6
14
16
13
12
20
26
False positive
-
-
-
-
-
-
-
-
-
-
-
-
-
-
-
-
-
1
-
-False negative
-
-
-
-
-
-
-
-
-
-
1
-
-
-
-
1
-
1
-
-Low outliers
-
-
-
-
-
-
-
-
-
-
-
1
-
1
-
-
1
-
-
-High outliers
-
-
-
1
-
-
-
-
-
-
-
-
-
-
-
-
-
-
-
--4
-2
0
2
4
-4
-2
0
2
4
Livsmedelsverkets rapport nr 26/2013 19
z
-scor
e
Lab no
3626
3652
3831
3925
4047
4050
4064
4100
4153
4171
4246
4266
4278
4288
4305
4339
4352
4400
4562
4633
No. of results
26
6
12
6
15
17
6
20
26
14
11
12
9
26
21
29
24
9
20
26
False positive
-
-
-
-
-
-
-
-
-
-
1
-
-
-
-
-
1
-
-
-False negative
-
-
-
-
-
1
-
-
-
-
-
-
-
-
-
-
-
-
-
-Low outliers
-
-
-
2
-
-
-
-
-
-
-
-
-
-
1
-
-
-
1
1
High outliers
-
-
-
-
-
-
-
-
-
-
-
1
-
-
-
-
-
-
-
-z
-scor
e
Lab no
4635
4664
4889
4951
4955
4980
5018
5100
5119
5162
5197
5201
5204
5220
5221
5250
5290
5304
5329
5333
No. of results
13
21
26
13
21
18
26
7
9
14
14
14
-
6
18
5
20
9
20
20
False positive
1
-
-
-
-
-
-
-
-
-
-
-
-
-
-
-
-
-
-
-False negative
-
1
-
1
-
-
-
2
-
-
-
1
-
-
-
1
-
-
-
-Low outliers
-
-
-
1
-
-
-
-
-
-
-
-
-
-
-
1
2
-
-
-High outliers
1
-
-
-
-
-
-
-
-
-
-
-
-
-
-
-
-
-
-
--4
-2
0
2
4
-4
-2
0
2
4
20 Livsmedelsverkets rapport nr 26/2013
z
-scor
e
Lab no
5338
5350
5352
5380
5419
5446
5494
5545
5553
5615
5632
5701
5801
5883
5993
6109
6175
6224
6232
6253
No. of results
6
-
23
15
20
21
18
14
8
20
12
3
9
15
3
12
3
9
6
20
False positive
-
-
-
-
-
-
-
-
-
-
-
-
-
-
-
-
-
-
-
-False negative
-
-
-
-
-
-
-
-
-
-
-
-
-
-
-
-
-
-
-
-Low outliers
-
-
-
1
-
-
-
-
-
-
-
-
-
-
1
-
-
-
1
-High outliers
-
-
-
-
-
-
-
-
1
-
-
-
-
-
-
-
-
-
-
-z
-scor
e
Lab no
6258
6343
6352
6368
6380
6456
6490
6594
6628
6647
6658
6707
6730
6762
6852
6885
6944
6958
6971
7024
No. of results
7
15
20
23
9
26
14
12
6
5
6
31
14
9
17
20
19
7
9
9
False positive
-
-
-
-
-
-
-
-
-
-
-
-
1
-
-
-
-
2
-
-False negative
-
-
-
-
-
-
-
-
-
-
-
-
-
-
-
-
1
-
-
-Low outliers
-
-
-
-
2
-
-
-
-
-
-
-
-
-
-
-
-
-
-
-High outliers
-
-
-
-
-
-
-
-
-
-
-
-
-
-
-
-
-
-
-
--4
-2
0
2
4
-4
-2
0
2
4
Livsmedelsverkets rapport nr 26/2013 21
z
-scor
e
Lab no
7096
7182
7191
7207
7232
7242
7248
7253
7296
7334
7336
7449
7543
7564
7596
7627
7688
7728
7750
7825
No. of results
20
21
21
11
3
9
23
17
9
13
7
9
15
32
24
11
20
21
12
12
False positive
-
-
-
-
-
-
-
1
-
-
1
-
-
-
-
-
-
-
-
1
False negative
-
-
-
-
-
-
-
-
-
-
1
-
-
-
-
-
-
-
-
1
Low outliers
-
-
-
-
-
1
-
-
-
1
-
-
-
-
-
-
-
-
-
-High outliers
-
-
4
-
-
-
-
1
-
-
-
-
-
-
-
-
-
-
-
-z
-scor
e
Lab no
7876
7877
7906
7930
7940
7946
7962
7984
8066
8068
8105
8213
8228
8255
8260
8313
8333
8352
8380
8397
No. of results
17
8
19
26
6
35
26
12
19
29
12
15
11
26
26
17
14
23
27
17
False positive
-
1
1
-
-
-
-
-
-
-
-
-
-
-
-
-
-
-
-
-False negative
-
-
1
-
-
-
-
-
1
-
-
-
1
-
-
-
-
-
-
-Low outliers
-
-
-
-
-
-
-
-
-
-
-
-
2
-
-
-
-
2
-
-High outliers
-
-
-
-
-
2
-
-
-
-
-
-
-
-
2
-
-
7
-
--4
-2
0
2
4
-4
-2
0
2
4
z
-scor
e
Lab no
8428
8430
8435
8523
8529
8568
8626
8628
8657
8734
8742
8756
8766
8891
8909
8918
8961
9002
9007
9034
No. of results
25
14
29
6
19
14
18
29
6
6
13
13
17
20
20
18
9
18
9
12
False positive
-
1
-
-
1
-
-
-
-
-
1
2
-
-
-
-
-
-
-
-False negative
1
-
-
-
-
-
-
-
-
-
1
-
-
-
-
-
-
-
-
-Low outliers
-
-
-
-
-
-
1
-
-
-
4
-
-
-
-
-
-
-
-
-High outliers
-
2
1
-
-
-
-
-
-
-
1
-
-
-
-
-
1
-
-
-Falsknegativa ?
z
-scor
e
Lab no
9051
9086
9217
9245
9429
9436
9451
9453
9512
9559
9569
9662
9747
9753
9783
9890
9903
9923
9950
No. of results
18
8
14
9
29
26
29
16
9
26
28
23
6
21
3
21
23
15
14
False positive
-
-
-
-
-
-
-
1
-
1
-
-
-
-
-
-
-
-
-False negative
-
1
-
-
-
-
-
-
-
-
1
-
-
-
-
-
-
-
-Low outliers
1
-
-
-
-
1
-
2
-
-
-
1
-
-
-
-
-
-
-High outliers
-
-
-
-
-
-
1
-
-
-
-
-
-
-
-
-
-
-
--4
-2
0
2
4
-4
-2
0
2
4
Test material and quality control
Test material
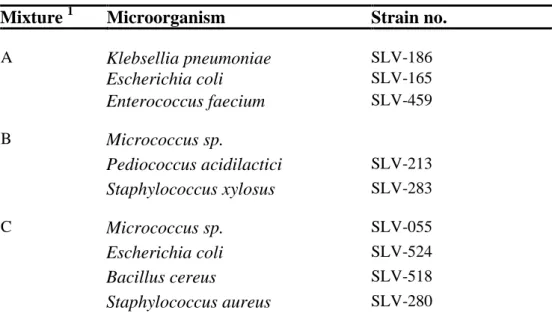
Each laboratory received three freeze-dried microbial mixtures designated A-C. The
manufactured test material was freeze-dried in portions of 0.5 ml in vials, as described
by Peterz and Steneryd (3). Before analysing the samples, the contents of each vial had
to be dissolved in 254 ml of diluent. The organisms present in the mixtures are listed in
Table 2.
Table 2. Microorganisms present in mixture A-C supplied to participants
Mixture
1
Microorganism
Strain no.
A
Klebsellia pneumoniae
SLV-186
Escherichia coli
SLV-165
Enterococcus faecium
SLV-459
B
Micrococcus sp.
Pediococcus acidilactici
SLV-213
Staphylococcus xylosus
SLV-283
C
Micrococcus sp.
SLV-055
Escherichia coli
SLV-524
Bacillus cereus
SLV-518
Staphylococcus aureus
SLV-280
1
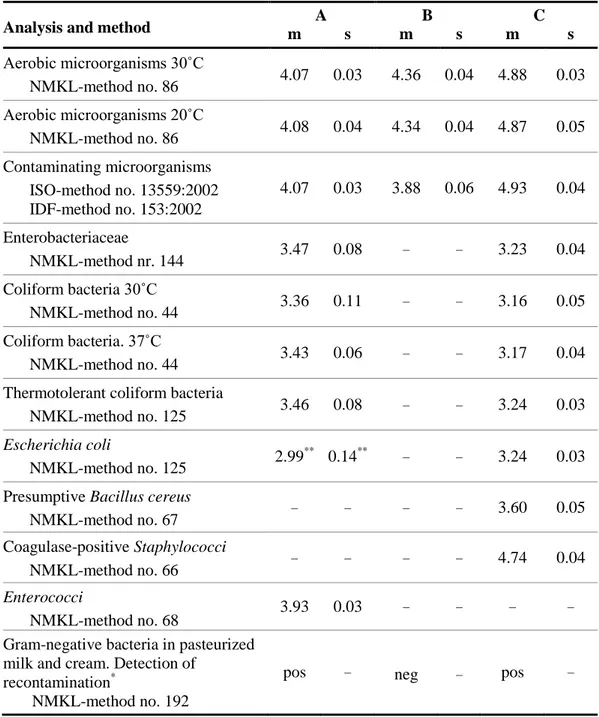
Quality control of the mixtures
It is essential to have aliquots of homogeneous mixture and equal volume in all vials in
order to allow comparison of all freeze-dried samples from one mixture. Quality control
was performed in conjunction with manufacturing of the mixtures according to Scheme
Protocol (2). The results are presented in Table 3. Homogeneity requires that the
standard deviation and the difference between the highest and lowest value of results
from 10 samples analysed do not exceed 0.15 log
10
units and 0.5 log
10
units,
respectively.
Table 3. Concentration mean (m) and standard deviation (s) from analyses of 10
randomly selected vials per mixture, expressed in log
10
cfu (colony forming units) per
ml of sample.
Analysis and method
m
A
s
m
B
s
m
C
s
Aerobic microorganisms 30˚C
NMKL-method no. 86
4.07
0.03
4.36
0.04
4.88
0.03
Aerobic microorganisms 20˚C
NMKL-method no. 86
4.08
0.04
4.34
0.04
4.87
0.05
Contaminating microorganisms
ISO-method no. 13559:2002
IDF-method no. 153:2002
4.07
0.03
3.88
0.06
4.93
0.04
Enterobacteriaceae
NMKL-method nr. 144
3.47
0.08
–
–
3.23
0.04
Coliform bacteria 30˚C
NMKL-method no. 44
3.36
0.11
–
–
3.16
0.05
Coliform bacteria.
37˚C
NMKL-method no. 44
3.43
0.06
–
–
3.17
0.04
Thermotolerant coliform bacteria
NMKL-method no. 125
3.46
0.08
–
–
3.24
0.03
Escherichia coli
NMKL-method no. 125
2.99
**0.14
**–
–
3.24
0.03
Presumptive Bacillus cereus
NMKL-method no. 67
–
–
–
–
3.60
0.05
Coagulase-positive Staphylococci
NMKL-method no. 66
–
–
–
–
4.74
0.04
Enterococci
NMKL-method no. 68
3.93
0.03
–
–
–
–
Gram-negative bacteria in pasteurized
milk and cream. Detection of
recontamination
*NMKL-method no. 192
pos
–
neg
–
pos
–
– No target organism or no value
References
1. Kelly, K. 1990. Outlier detection in collaborative studies. J. Assoc. Off. Anal.
Chem. 73:58-64.
2. Anonymous, 2012. Protocol. Microbiology. Drinking Water & Food. The National
Food Agency.
3. Peterz. M. Steneryd. A.C. 1993. Freeze-dried mixed cultures as reference samples
in quantitative and qualitative microbiological examinations of food. J. Appl.
Bacteriol. 74:143-148.
Lab no Lab no A B C A B C A B C A B C A B C A B C A B C A B C A B C A B C A B C A B C A B C 1081 1 3 2 4.08 4.86 4.92 - - - 3.32 <1 2.84 - - - 3.04 <1 2.88 <1 <1 3.79 <1 <1 4.59 - - - 1081 1149 2 3 1 4.18 4.18 4.9 - - - 3.48 <1 3.08 - - - 3.32 <1 3.23 - - - 2.9 <1 3.23 <1 <1 3.4 <1 <1 4.56 - - - 1149 1254 3 2 1 4.06 4.32 4.85 - - - 3.35 <1 3.09 3.35 <1 3.07 3.32 <1 3.2 3.32 <1 3.22 <2 <2 3.4 - - - 3.91 4.08 <2 - - - 1254 1594 1 3 2 4.11 4.38 4.85 - - - 3.45 <1 2.95 3.36 <1 2.59 3.48 <1 2.85 3.58 <1 3.2 3.46 <1 3.2 <2 <2 3.63 <2 <2 4.65 4.08 4.26 <2 - - - 1594 1970 1 2 3 4.11 4.3 4.79 4.11 4.3 4.74 - - - 3.46 <1 3.2 3.38 <1 3.2 3.46 <1 3.18 3.46 <1 3.2 3.37 <1 3.18 <2 <2 3.76 <2 <2 4.72 3.99 <2 <2 - - - 1970 2035 2 3 1 4 4.3 4.9 - - - 3.4 <1 3 - - - 3.2 <1 <1 <1 <1 3.6 <2 <2 4.7 - - - 2035 2058 2 1 3 4.07 4.32 4.72 - - - 3.06 <1 3.15 <2 <2 3.56 - - - 2058 2072 2 1 3 4.87 4.2 4.64 4.83 4.2 4.52 - - - 2.96 0 2.87 3 0 2.89 3 0 2.99 3.06 0 3 2.84 0 2.91 0 0 3.2 0 - 4.54 - - - 2072 2324 2 3 1 3.91 4.55 4.82 - - - 3.29 0 2.81 - - - 2.94 0 2.78 0 0 3.55 0 0 4.73 3.79 0 0 - - - 2324 2350 3 1 2 - - - 3.81 <2 3.23 - - - <2 <2 4.75 - - - 2350 2386 1 2 3 4 3.89 4.89 - - - 3.13 <1 <1 3.54 <1 3.16 3.3 <1 3.1 3.12 <1 3.23 <2 <2 3.48 <2 <2 4.64 - - - 2386 2402 1 2 3 4.03 4.66 4.88 - - - 3.56 <1 3.15 - - - 3.53 <1 2.95 - - - 3.18 <1 2.95 - - - 2402 2459 1 2 3 3.98 3.89 4.68 3.94 3.84 4.72 - - - 3.42 <1 3.23 - - - 3.28 <1 3.16 <1 <1 3.52 <1 <1 4.64 - - - 2459 2505 2 3 1 3.98 4.2 4.87 - - - 3.28 <1 3.08 3.25 <1 3.04 3.3 <1 3.04 - - - 3.04 <1 2.86 - - - 2505 2553 1 3 2 3.97 4.2 4.87 - - - <1 - - - - 3.05 <1 2.55 - - - <2 <2 4.59 - - - 2553 2637 1 2 3 4.04 4.32 4.78 - - - 3.39 3.81 4.81 3.43 <1 3.23 - - - 3.41 <1 3.17 3.38 <1 3 3.38 <1 2.95 <1 <1 3.59 <1 <1 4.65 - - - 2637 2659 2 1 3 4.3 3.95 4.61 - - - 3.52 <1 4.02 - - - 3.08 <1 2.7 - - - <1 <1 4.56 - - - 2659 2670 2 1 3 4.05 6.45 4.96 - - - 3.04 0 3.04 3.04 0 2.4 0 0 0 - - - 0 0 4.5 - - - 2670 2704 3 1 2 4.14 3.85 4.84 - - - 3.54 <1 3.11 - - - 3.57 <1 3.11 - - - 3.04 <1 3.11 <2 <2 3.4 <2 <2 4.51 - - - 2704 2720 3 1 2 4.03 4.38 4.85 - - - 3.4 <1 3.15 - - - 2720 2745 2 3 1 4.05 4.34 4.78 4.05 4.33 4.83 - - - 3.43 <1 3.17 - - - 3.38 <1 3.2 3.15 <1 3.17 <2 <2 3.81 <2 <2 4.86 3.93 <2 <2 - - - 2745 2757 3 1 2 4.08 3.91 4.85 4.08 3.76 4.75 - - - 3.38 <1 3.15 3.4 <1 3.18 - - - <2 <2 3.46 - - - 2757 2764 1 2 3 3.93 3.87 4.81 - - - 3.6 <1 3.04 - - - 3.3 <0,60 2.93 - - - <2 <2 3.54 - - - 3.9 <2 <2 - - - 2764 2842 3 1 2 4.93 3.83 4.65 - - - 3.2 0 2.95 3.32 0 3 - - - 3.2 0 3 3.11 0 2.97 - - - 2842 2920 1 2 3 3.99 4.34 4.99 - - - 3.3 <1 3.16 - - - 3.21 <1 3.06 - - - 2920 2941 3 1 2 4 4.52 4.84 - - - 3.3 - 2.98 3.42 - 2.99 - - - 3.1 - 3.1 - - - 3.31 - - 4.7 3.98 - - - 2941
3055 3 2 1 4.04 4.14 4.74 - - - 3.4 <1 3.01 - - - <1 <1 3.4 - - - Pos Neg Pos 3055 3159 3 2 1 4.01 3.92 4.85 - - - 3.45 <1 3.2 - - - 3.4 <1 3.15 3.28 <1 3 3.11 <1 3.11 - - - <2 <2 4.62 - - - 3159
3225 3 1 2 3.94 4.24 4.77 - - - 3.31 <1 3.08 - - - <1 <1 3.27 - - - Pos Neg Pos 3225 3243 1 2 3 4.02 4.18 4.83 - - - 3.42 <1 2.97 - - - 3243 3305 1 3 2 4.08 4.54 4.88 - - - 3.28 <1 3 - - - 3.43 <1 3.3 3.43 <1 3.34 <2 <2 3.79 <2 <2 <2 - - - 3305 3327 3 1 2 4.01 4.19 4.71 - - - 3.33 0 2.93 - - - 3.05 0 2.35 - - - 0 0 4.5 - - - 3327 3346 1 2 3 3.88 4.2 4.51 - - - 3.34 <1 3.1 3.31 <1 3.08 3.34 <1 3.14 3.23 <1 3.2 2.85 <1 3.15 <2 <2 3.4 <2 <2 4.36 - - - 3346 3452 2 3 1 3.96 4.42 4.34 - - - 3.47 0 2.86 - - - 3452 3457 1 3 2 - - - 4.08 3.57 4.59 - - - 3.36 <1 3.04 - - - 3.44 <1 3.1 - - - <2 <2 4.43 4.04 4.06 <2 - - - 3457 m 4.0 4.26 4.83 4.0 4.1 4.69 3.8 3.78 4.5 3.4 0 3.0 3.3 0 3.0 3.36 0 3.03 3.36 0 3.1 3.2 0 3.1 0.0 0 3.5 0.0 0 4.6 3.9 0 0.0 pos neg pos m s 0.09 0.26 0.12 0.09 0.4 0.19 0.31 0.15 0.53 0.12 0 0.16 0.127 0 0.16 0.18 0 0.17 0.17 0 0.1 0.196 0 0.16 0 0 0.181 0 0 0.115 0.13 0 0 - - - s
Code no
Thermotolerant
colif. bacteria Escherichia coli
Presumptive Bacillus cereus Coagulase-positive staphylococci Enterococci Gram-neg bacteria in dairy prod. Aerobic microorg. 30 °C Aerobic microorg. 20 °C Contaminating microorg. Enterobacteriaceae Coliform bacteria 30 °C Coliform bacteria 37 °C