https://doi.org/10.1007/s10209-020-00714-x LONG PAPER
Disability digital divide: the use of the internet, smartphones,
computers and tablets among people with disabilities in Sweden
Stefan Johansson1 · Jan Gulliksen1 · Catharina Gustavsson2,3,4© The Author(s) 2020
Abstract
Although Sweden is one of the most digitalized countries and the Swedish population’s use of the internet is among the most studied in the world, little is known about how Swedes with disabilities use internet. The purpose of this study is to describe use of and perceived difficulties in use of the internet among people with disabilities and to explore digital divides in-between and within disability groups, and in comparison with the general population. This is a cross-sectional survey targeting the same issues as other nationwide surveys but adapted for people with cognitive disabilities. Participants were recruited from May to October 2017 by adaptive snowball sampling. The survey comprised questions on access to and use of devices, and use of and perceived difficulties in use of internet. A total of 771 people responded to the survey, representing 35 diagnoses/impairments. Larger proportions of people with autism, ADHD and bipolar disorder reported using internet than other disability groups. Women with autism used the internet more than any other disability group, and women with aphasia used the internet the least. People with disabilities related to language and understanding reported more difficulties using internet than other disability groups. Larger proportions of participants than the general Swedish population reported not feeling digitally included. In many but not all disability groups, larger proportions of men than women reported not feeling digitally included. Our findings show that there are differences in digital inclusion between sub-groups of diagnoses/ impairments. Thus, disability digital divides are preferably investigated by sub-grouping disabilities, rather than studied as one homogeneous group.
Keywords Disability digital divide · Accessibility · Internet access · Internet usage · Internet skills · Smartphone · Tablet · Assistive technology · Inclusion · Exclusion
1 Introduction
High expectations have been linked to digitization and espe-cially the internet, as a force to decrease divides in society. The inventor of the internet, Sir Tim Berners-Lee, launched the Web Accessibility Initiative in 1997 with the statement
‘As we move towards a highly connected world, it is critical that the Web be usable by anyone, regardless of individual capabilities and disabilities’ [1]. Up until the recent Euro-pean Union (EU) Directive on the Accessibility of Websites and Mobile Applications [2], we have seen some 20 years of policy making, legislation, development of standards and guidelines to improve the accessibility to the internet for people with disabilities. In this paper we present the first data from the survey study ‘Swedes with disabilities and the internet’. It is the first of its kind, in that we have succeeded to disaggregate disability into 35 different groups of diagno-ses and impairments by data from 771 people responding to a survey about internet use and the use of devices to access the internet.
The purpose of this study was to describe use of and per-ceived difficulties in use of the internet among people with disabilities and to explore digital divides in-between and * Stefan Johansson
stefan.johansson@begripsam.se
1 School of Electrical Engineering and Computer Science,
KTH Royal Institute of Technology, 100 44, Stockholm, Sweden
2 Center for Clinical Research Dalarna, Uppsala University,
Nissers vag 3, 79182 Falun, Sweden
3 School of Education, Health and Social Studies, Dalarna
University, 79188 Falun, Sweden
4 Department of Public Health and Caring Sciences, Uppsala
within disability groups, and in comparison with the general population.
1.1 The nature of digital divides
There are several studies to show how internet use in the general population depends on various biological, economic, social or organizational aspects. Age is negatively related to internet use, but higher education, higher income, having a job, being coupled is related to higher internet use [3]. The previously gender gap in internet access, has closed in several countries [4–7], but still women use the internet less and for different purposes. Women value their online skills lower than men [4, 6, 8]. Thus, differences related to gender are important to consider when investigating digital divides. People who have most problems online lack high quality support [9]. There are several studies that address potentially problematic features in internet use, e.g. navigation [10], orientation [11], selecting search results [12, 13], defining search queries [14], evaluating information [15]. However, in those studies people with disabilities are rarely included in the targeted populations.
Skills are an important predictor for internet use. Younger men tend to over-estimate while women and older people underestimate their skills [6, 8]. Studies show that self-reported high self-efficacy for using the internet increase the likelihood of using the internet [16, 17]. Van Deursen and van Dijk presented four types of internet skills; opera-tional, formal, information and strategic [18–20]. They drew on work done by Hargittai [21] and proposed a set of items to be used as proxy to measure these four types of internet skills [22]. This was challenged by Talja who places the use of the internet in a social constructivist setting and argues that skills are dialogic, multi-layered, and context-dependent [23].
1.2 Disability digital divides
Disability is often ignored as a potential reason for digi-tal exclusion [3]. Few researchers investigating the digital divide have paid attention to disability [3, 4, 24]. Dobransky and Hargittai [4] explored the digital divide by investigat-ing internet access and use among people with six types of disabilities. When controlling for demographic and socio-economic factors, i.e. gender, age, education, income, peo-ple in five of the six disability types reported less access to internet and lower skills as compared to the general popu-lation. In contrary, having a hearing impairment increased the odds of access to the internet as compared to the general population. However, once online, there were no differences in many areas of usage and increased chances that people with disabilities engaged in five activities: downloading vid-eos, playing games online, reviewing products or services,
sharing own content and posting to blogs. In an earlier study, Dobransky and Hargittai [24] concluded that there is a ability digital divide but all disabilities are not equally dis-advantaged. They found that people with hearing or walking impairment are more likely to use the internet than other types of disabilities. They summarize that the most disad-vantaged disability groups were those being blind, having difficulties leaving home and having multiple disabilities. For future research to properly investigate disability digital divides, they call for disaggregated categories of disabilities and conclude that collapsing all types of disabilities into one category may be misleading. Scholz et al. [3] compared data from 27 European countries and found a distinct disability effect in regard to digital divides and that people with dis-abilities are over-represented among those who are digitally excluded.
Studies involving disability in relation to digital divides and difficulties in using the internet often have used qualita-tive methods, have involved small samples and been based on accessibility or universal design approach. Those studies have typically targeted one specific disability group at a time and one specific digital product, service or environment. For example, Kennedy et al. [25] found that web pages became more accessible for people with intellectual disabilities if they used images to communicate core content; had simple navigation; used simple text and short sentences; used voic-ing to narrate pages; and incorporated video, animation and sound. Sevilla et al. [26] argued that content presented at different levels of difficulties and modalities enhanced the use of web pages for people with cognitive impairments. Carmien and Manzanares [27] presented a set of heuristics that aimed to give advice on designing for elderly people using smartphones. Greig et al. [28] identified 18 barriers and 9 facilitators to mobile phone use for people with apha-sia. Williams and Hennings studied how web design can be optimized for people with learning difficulties [29]. Findings from studies involving small samples and qualitative data collection provide valuable information, such as heuristics, personal experiences and how things work in a specific con-text, but may have limited generalizability [30].
1.3 Accessibility and universal design
An approach to dealing with exclusion due to impairments is to eliminate existing barriers and prevent new ones to appear by implementing principles of accessibility and universal design [31]. Referring to the social model of disability, disa-bling structures are located outside the impaired person and should be understood as the society being unprepared to organize its activities without discriminating people with impairments [32]. Policy and law in Sweden, as in the rest of the European Union [2], points to WCAG, Web Content Accessibility Guidelines as the standard to comply with
requirements of accessibility [33]. Even though WCAG has been important for the development of web accessibility, it has also has been criticized for lack of support to people with cognitive impairments [34, 35], intellectual disabili-ties [36], dyslexia [37] in favour of people with sensory and physical impairments [25].
1.4 The Swedish population and the internet
There are two well-established surveys on internet use in the Swedish population. The government agency SCB, Statistics Sweden [38] (referred to as SCB 2016) and IIS, the Internet Foundation in Sweden [39] (referred to as IIS 2017) report about the use of the internet in the population. Since the 1990s, the Swedish population is one of the best documented in the world regarding engagement on the internet. How-ever, the Swedish surveys have shortcomings in regard to people with disabilities in the population. Both SCB and IIS use stratified random probability sampling and have made attempts to identify disability in the samples by adding a question about disability in the survey.
Many disability groups are not represented in the survey sample, and since the total number reporting a disability is small, they are reported as one group. Thus, despite the fact that the Swedish population has been extensively investi-gated, there is still a knowledge gap, regarding the use of internet among disabled groups in Sweden.
2 Method
2.1 Study design and sample
This was a cross-sectional survey [40] using adaptive snow-ball sampling methods [41] for recruiting participants hav-ing cognitive and perception disabilities (by diagnoses or impairments), which were considered relevant to possibly interfere with use of internet [41]. The study applied a sur-vey-mirroring concept and inclusive participatory methods [42–44]. By survey-mirroring, we refer to targeting the same issues as the nationwide surveys but elaborating the surveys to be accessible to the target populations. The members of the Begripsam Group, whom all have different cognitive and perception disabilities, acted as expert reference group and contributed to the development of the survey, selection of target populations and interpretation of the results. The study was approved by the Ethics Board at KTH Royal Institute of Technology (Decision date 17-4-2017). The participants provided informed consent by entering the survey, after given the opportunity to read the written information about the study.
2.2 Study procedures
A survey-mirroring concept was applied to replicate two nationwide surveys investigating internet use. The question-naires from the mirrored surveys were elaborated in col-laboration with the Begripsam Group, in order to increase accessibility for people with disabilities. In consecutive workshops, the number of questions was reduced and rewrit-ten. The preliminary questionnaire was piloted by members of the Begripsam Group and by an online pilot test with 62 respondents.
Participant recruitment was undertaken from May to October 2017 by an adaptive snowball sampling [41] of peo-ple with cognitive and perception disabilities. The recruit-ment process was closely monitored to ensure participation from all targeted disability groups. The survey was distrib-uted through the Begripsam web site and the Facebook site, home pages of disability organizations and disability networks, e-mail contact lists and by personal communica-tion. The survey information endorsed everyone to share and redistribute the survey. The recruitment procedure was modified in real time, in order to ensure recruitment of par-ticipants from as many target populations as possible. Tailor-made information for each target population was offered to organizations or persons willing to redistribute informa-tion about the survey. Key persons within the disability movement, so-called intermediators [43], were specifically appointed for this study, or picked from already established network of intermediators, and contacted. The intermedia-tors introduced the study through their personal networks of professionals and people with disabilities.
Participants could choose to respond to the survey online, on paper, or request a telephone interview. Face-to-face interviews recorded on paper questionnaires were used to penetrate especially hard to reach populations. Research assistants visited disability organizations’ member meet-ings and meeting points for face-to-face interviews. A sign-language speaking research assistant communicated with deaf people. Staff at centres run by an Aphasia Organiza-tion assisted in interviews with people with aphasia. For people with intellectual disabilities, face-to-face interviews were undertaken using complementary pictograms cover-ing internet-related terms. Pictograms presentcover-ing devices, features and logotypes were used as complimentary material alongside with the survey questions to support understand-ing. The interviewer was allowed to explain and give exam-ples in order to ensure understanding.
2.3 Data collection
The questionnaire comprised 54 questions and started by a checkbox list to report types of disabilities (i.e. 35 diag-noses and impairments, and a free text response option).
The questions on internet use covered: access to and dif-ficulties in use of devices (i.e. smartphone, computer and tablet), perceived difficulties in use of general functions on the internet (i.e. search for information, navigate, understand information, use passwords and understand and cope with design), use of and difficulties in use of specific resources on the internet (online banking, online shopping, using social media, e.g. blogging and Facebook). Participants were also asked if they felt included in the digital society. The ques-tionnaire also contained questions on background character-istics: gender, age, accommodation, education, occupation and income.
2.4 Statistical analyses
Survey data were analysed with descriptive statistics [45]. When analysing data by disability group and by demo-graphic and socio-economic variables, only those 28 dis-ability groups that had 25 or more participants were included in the analyses. Seven disability groups contained fewer than 25 participants and were excluded from analyses on com-parisons between disability group and on comcom-parisons in demographic and socio-economic variables. Analyses were conducted using the statistical software IBM SPSS 23.0 and Microsoft Excel.
3 Results
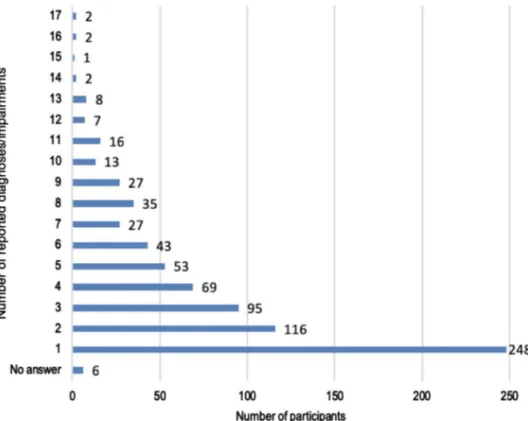
A total of 771 persons were participated. All a priori defined 35 disability groups were represented. Table 1 presents the number of participants for each disability group and the group proportion (%) of the total number of participants. It also presents the number of women and men for each group. The largest group was difficulties related to concentration, with 201 participants, followed by autism spectrum disor-der (n = 189) and sensitive for strong impressions (n = 184). Seven of the disability groups had less than 25 participants, i.e. CP, dementia, deaf, deafblind, MS, Parkinson and schiz-ophrenia. As presented in Fig. 1, in average the participants reported having 4 diagnoses/impairments. Two participants reported having 17 diagnoses/impairments; 248 persons reported one diagnosis or impairment.
3.1 Demographic and socio‑economic characteristics of the participants
3.1.1 Gender
The gender distribution among the participants was: 419 women, 283 men and 22 persons of other gender. (Forty-seven participants did not answer the question.)
3.1.2 Age
The age distribution among the participants is slightly dif-ferent than in the general Swedish population [46]. In total, 67% of participants were in the age categories 31–54 years (48%) and 17–30 years (19%), which is a larger proportion than in the general Swedish population (52%); 12% of par-ticipants were in the age category 65 years and older, which is a smaller proportion than in the general Swedish popu-lation; 3% of participants were 16 years or younger. Age differences between groups of disabilities correspond with information retrieved from the disability organizations. For example, the known prevalence of stroke, aphasia, blind, and low vision is higher in older age and the prevalence of ADHD and autism spectrum is higher in younger or middle-aged people. Almost all participants in the age categories up to 30 years report access to the internet and daily use of digital resources. This drops at older ages.
3.1.3 Education
The level of education among the participants differs slightly as compared to the Swedish population [47]. A larger pro-portion among the participants (31%) than the general popu-lation (25%) have university level education; 12% among the participants have attended elementary school or special elementary school for students with intellectual disabili-ties, i.e. the lowest level of education in Sweden, which is equivalent to the reported incidence in the general Swedish population (12%). A smaller proportion among the partici-pants (34%) than the general population (44%) has attended upper secondary school or special upper secondary school for students with intellectual disabilities.
3.1.4 Occupation
In regard to occupation, 36% of the participants reported having a job, which is a lower rate of employment com-pared to the general population (50%) [48]; 11% reported being students and 18% being on age retirement from the workforce, leaving 35% of the participants as being outside the workforce although they are not children, students or age retired. For the latter category, the corresponding proportion in the general Swedish population is 6% [48].
3.1.5 Income
While the average income in general Swedish population [49] at the time-point for the survey was 33,000 Swedish crones (SEK), half of the participants (54%) had an income of 17,999 SEK or less. 19% of participants had an income of 25,000 SEK or more. 13% of the participants did not know what income they had.
3.1.6 Accommodation
Regarding accommodation, 8.5 per cent of the participants live in some kind of specially arranged accommodations or
institutions, 25% of the participants live in small houses, 39% in rented flats and 25% in owned flats. The accommo-dation distribution is different compared with the general population [50], where 50% of the general population live Table 1 Number (n) and proportion (%) of participants who reported having each diagnosis and impairment, and number (n) of women and men in each diagnosis/impairment group
a On gender there were also the options ‘Other’ and ‘I do not want to answer that question’. Those gender groups were small and are not
pre-sented in the results. Participants could report multiple diagnoses/impairments Total
n (%)a Womenn Menn Prevalence in the general Swedish population
Diagnoses
ADD 52 (7%) 30 14 People with ADD are included in the ADHD prevalence figures
ADHD 94 (12%) 56 26 4–5% [60]
Aphasia 34 (4%) 19 14 0.34% have stroke-induced aphasia [61]. No numbers found on
apha-sia caused by other brain injuries
Autism spectrum disorder 189 (25%) 99 64 1–2.5% [62]
Bipolar 25 (3%) 13 10 2.4% [63]
Cerebral palsy 19 (3%) 8 9 0.2% [64]
Dementia, Alzheimer’s disease 2 (0.3%) 1 1 1.82% [65]
Depression, anxiety 179 (23%) 110 46 Point prevalence (2016) for depression: 5–8% and for anxiety:
12–17% [66]
Dyscalculia 31 (4%) 18 11 14.7% reach level 1 or lower in numeracy proficiency [67]. 6.5% [68]
Dyslexia 113 (15%) 57 46 5–8% [69]
Epilepsy 35 (5%) 13 19 0.04–0.06% [70]
Intellectual disability 82 (11%) 43 35 0.8–3.7% [71]
Language disorder 39 (5%) 17 16 9.92% of children aged 4–5 [72].
Multiple sclerosis 6 (1%) 4 2 0.11% men and 0.26% women [73]
Parkinson’s disease 1 (0.1%) 1 0 0.2%, 1% of all Swedes aged 65 or more [74]
Stroke 60 (8%) 29 25 Incidence 2016: 14 688 men, 13 635 women [75]
Schizophrenia 20 (3%) 15 4 0.7% [76]. 0.4–1% [77]
Impairment
Blind 30 (4%) 13 12 Blind people are included in the visually impaired group
Visually impaired 57 (7%) 27 26 1.2–2.97% [78]
Deaf 22 (3%) 17 4 0.07–0.1% [79]
Deafblind 11 (1%) 8 3 0.02% (age under 65) and 0.1% (age over 65) [80]
Hearing impaired 25 (3%) 13 9 15–17% [81]
Fine motor impairments 93 (12%) 52 33 No numbers on prevalence/incidence found
Speech impairment 54 (7%) 22 26 No numbers on prevalence/incidence found
Difficulties related to concentration 201 (26%) 116 67 No numbers on prevalence/incidence found
Difficulties related to focusing 158 (21%) 88 50 No numbers on prevalence/incidence found
Difficulties related to lack of self-esteem 129 (17%) 84 37 No numbers on prevalence/incidence found
Difficulties related to learning new things 72 (10%) 41 26 Specific learning disabilities: 10% [82]
Difficulties related to memory 151 (20%) 79 56 No numbers on prevalence/incidence found
Difficulties related to reading 112 (15%) 60 43 13.3% reach level 1 or lower in literacy proficiency [67]. No
distinc-tion was made between reading and writing
Difficulties related to writing 110 (14%) 54 50 See reading
Difficulties related to social fear 78 (10%) 40 28 No numbers on prevalence/incidence found
Difficulties related to start or stop activities 168 (22%) 94 56 No numbers on prevalence/incidence found
Difficulties related to ability to understand 90 (12%) 49 34 No numbers on prevalence/incidence found
Sensitive for strong impressions 184 (24%) 126 40 No numbers on prevalence/incidence found
in small houses, 25% in rented flats and 16% in owned flats.
3.2 Access to and use of smartphone, computers and tablets
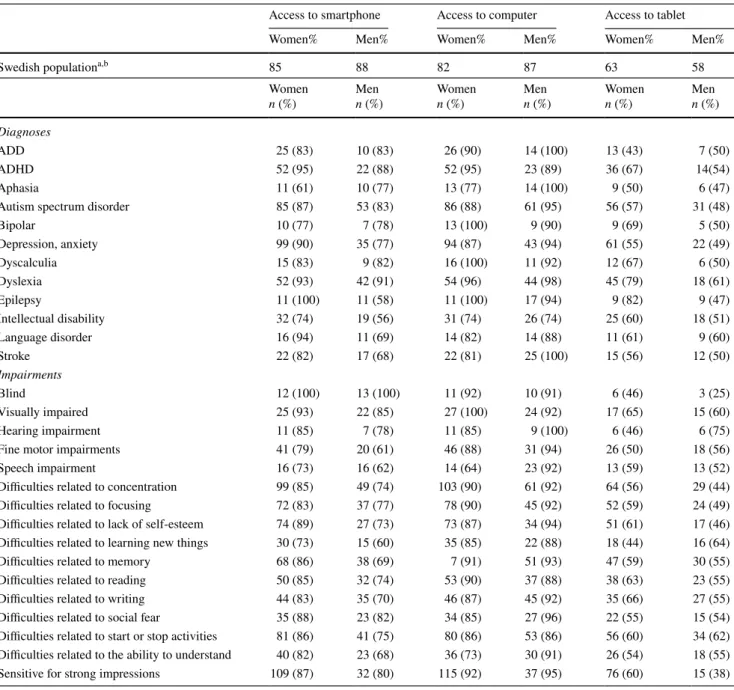
The participants’ access to a smartphone, personal computer and/or tablet is presented in Table 2. The penetration of smart-phones was between 61% (men with fine motor impairments) to 100% (blind women and men). The penetration for personal computers was between 64% (women with speech impair-ments) to 100% (men with ADD, aphasia, stroke and women with bipolar syndrome, dyscalculia and visual impairment). The penetration for tablets was between 25% (blind men) to 79% (women with dyslexia).
In regard to education, the lowest proportions reporting access to devices were among participants having studied at special schools for students with intellectual disabilities: smartphone (68%), computer (79%) and tablet (59%).
In regard to accommodation, the lowest proportions report-ing access to devices were among participants livreport-ing in spe-cially arranged accommodations or institutions: smartphone (52%), computer (65%) and tablet (39%).
3.3 Difficulties in using general functions on the internet
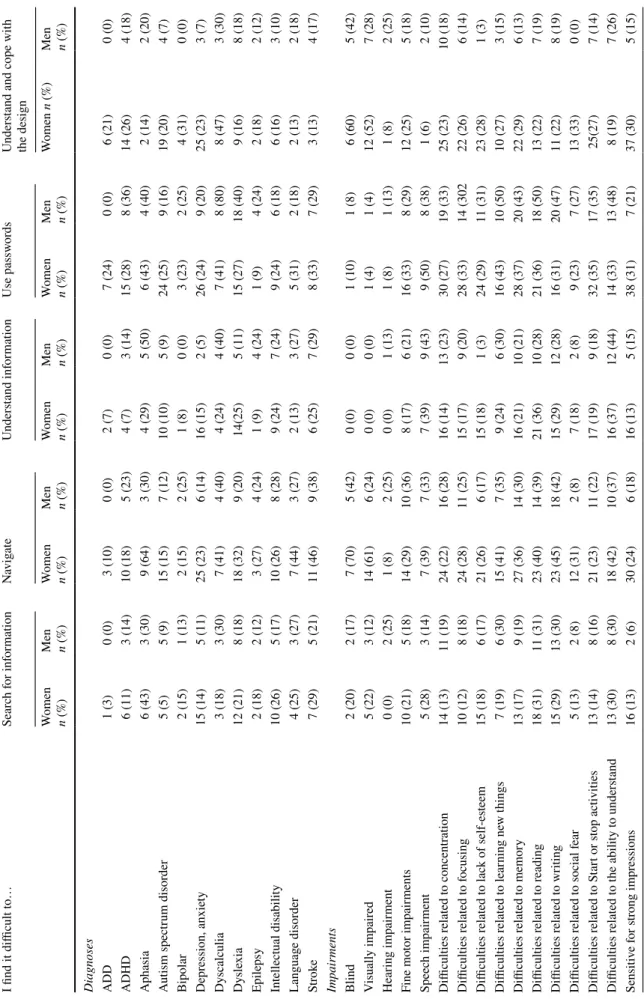
In response to the overall question whether the use of inter-net, in general, was difficult, 62% answered that they did not find the internet difficult. In response to the questions whether searching, navigation, understanding informa-tion, using passwords, and coping with design were dif-ficult (Table 3), dyscalculia, language-related diagnoses, impairments and intellectual impairments reported the larg-est proportions having difficulties. ADD, hearing impair-ments, autism spectrum and bipolar reported the smallest proportions having difficulties. Navigation and passwords are reported difficult by the largest proportions, followed by services, design, content and search. In regard to these num-bers there are no statistics available to allow for comparisons with the general Swedish population.
In regard to education, the lowest proportions respond-ing that they did not find the internet difficult was among people having studied at special schools for students with intellectual disabilities (49%).
In regard to accommodation, the lowest proportions responding that they did not find the internet difficult was Fig. 1 Number of reported
diag-noses and impairments. Total number of participants was 771. On average, the participant reported having 4 diagnoses/ impairments
among people living in specially arranged accommodations or institutions (55%).
3.4 Use of online banking and shopping
Participants’ reported use of internet banking and online shopping is presented in Table 4, alongside with reported difficulties in using those services. The proportion of par-ticipants in the groups who paid bills by internet bank-ing ranged between 34% (intellectual disability) and 88%
(bipolar syndrome). Larger proportions of women reported using internet banking and found it less difficulty than men. The proportions using online shopping were between 35% (intellectual disability) and 88% (ADD). When ana-lysing by gender separately, the largest proportion using online shopping was women with ADD (93%), ADHD (95%), bipolar syndrome (92%) and dyscalculia (94%).
In regard to education, people having studied at special schools for students with intellectual disabilities reported Table 2 Number (n) and proportion (%) of participants by each diagnosis/impairment who reported that they had access to smartphone, com-puter and tablet
a Data from IIS 2017. % of women and men having an own smartphone, computer or tablet
b The total number of people in the Swedish population in 2017 was 9.995.000 (Eurostat)
Access to smartphone Access to computer Access to tablet
Women% Men% Women% Men% Women% Men%
Swedish populationa,b 85 88 82 87 63 58
Women
n (%) Menn (%) Womenn (%) Menn (%) Womenn (%) Menn (%)
Diagnoses
ADD 25 (83) 10 (83) 26 (90) 14 (100) 13 (43) 7 (50)
ADHD 52 (95) 22 (88) 52 (95) 23 (89) 36 (67) 14(54)
Aphasia 11 (61) 10 (77) 13 (77) 14 (100) 9 (50) 6 (47)
Autism spectrum disorder 85 (87) 53 (83) 86 (88) 61 (95) 56 (57) 31 (48)
Bipolar 10 (77) 7 (78) 13 (100) 9 (90) 9 (69) 5 (50) Depression, anxiety 99 (90) 35 (77) 94 (87) 43 (94) 61 (55) 22 (49) Dyscalculia 15 (83) 9 (82) 16 (100) 11 (92) 12 (67) 6 (50) Dyslexia 52 (93) 42 (91) 54 (96) 44 (98) 45 (79) 18 (61) Epilepsy 11 (100) 11 (58) 11 (100) 17 (94) 9 (82) 9 (47) Intellectual disability 32 (74) 19 (56) 31 (74) 26 (74) 25 (60) 18 (51) Language disorder 16 (94) 11 (69) 14 (82) 14 (88) 11 (61) 9 (60) Stroke 22 (82) 17 (68) 22 (81) 25 (100) 15 (56) 12 (50) Impairments Blind 12 (100) 13 (100) 11 (92) 10 (91) 6 (46) 3 (25) Visually impaired 25 (93) 22 (85) 27 (100) 24 (92) 17 (65) 15 (60) Hearing impairment 11 (85) 7 (78) 11 (85) 9 (100) 6 (46) 6 (75)
Fine motor impairments 41 (79) 20 (61) 46 (88) 31 (94) 26 (50) 18 (56)
Speech impairment 16 (73) 16 (62) 14 (64) 23 (92) 13 (59) 13 (52)
Difficulties related to concentration 99 (85) 49 (74) 103 (90) 61 (92) 64 (56) 29 (44)
Difficulties related to focusing 72 (83) 37 (77) 78 (90) 45 (92) 52 (59) 24 (49)
Difficulties related to lack of self-esteem 74 (89) 27 (73) 73 (87) 34 (94) 51 (61) 17 (46)
Difficulties related to learning new things 30 (73) 15 (60) 35 (85) 22 (88) 18 (44) 16 (64)
Difficulties related to memory 68 (86) 38 (69) 7 (91) 51 (93) 47 (59) 30 (55)
Difficulties related to reading 50 (85) 32 (74) 53 (90) 37 (88) 38 (63) 23 (55)
Difficulties related to writing 44 (83) 35 (70) 46 (87) 45 (92) 35 (66) 27 (55)
Difficulties related to social fear 35 (88) 23 (82) 34 (85) 27 (96) 22 (55) 15 (54)
Difficulties related to start or stop activities 81 (86) 41 (75) 80 (86) 53 (86) 56 (60) 34 (62)
Difficulties related to the ability to understand 40 (82) 23 (68) 36 (73) 30 (91) 26 (54) 18 (55)
Table 3 N umber ( n) and pr opor tion (%) of par ticipants b y eac h diagnosis/im pair ment, who r epor ted g ener al functions on t he inter ne t as difficult I find it difficult t o… Sear ch f or inf or mation Na vig ate Unders tand inf or mation Use passw or ds Unders
tand and cope wit
h the design W omen n (%) Men n (%) W omen n (%) Men n (%) W omen n (%) Men n (%) W omen n (%) Men n (%) W omen n (%) Men n (%) Diagnoses ADD 1 (3) 0 (0) 3 (10) 0 (0) 2 (7) 0 (0) 7 (24) 0 (0) 6 (21) 0 (0) ADHD 6 (11) 3 (14) 10 (18) 5 (23) 4 (7) 3 (14) 15 (28) 8 (36) 14 (26) 4 (18) Aphasia 6 (43) 3 (30) 9 (64) 3 (30) 4 (29) 5 (50) 6 (43) 4 (40) 2 (14) 2 (20) Autism spectr um disor der 5 (5) 5 (9) 15 (15) 7 (12) 10 (10) 5 (9) 24 (25) 9 (16) 19 (20) 4 (7) Bipolar 2 (15) 1 (13) 2 (15) 2 (25) 1 (8) 0 (0) 3 (23) 2 (25) 4 (31) 0 (0) Depr ession, anxie ty 15 (14) 5 (11) 25 (23) 6 (14) 16 (15) 2 (5) 26 (24) 9 (20) 25 (23) 3 (7) Dy scalculia 3 (18) 3 (30) 7 (41) 4 (40) 4 (24) 4 (40) 7 (41) 8 (80) 8 (47) 3 (30) Dy sle xia 12 (21) 8 (18) 18 (32) 9 (20) 14(25) 5 (11) 15 (27) 18 (40) 9 (16) 8 (18) Epilepsy 2 (18) 2 (12) 3 (27) 4 (24) 1 (9) 4 (24) 1 (9) 4 (24) 2 (18) 2 (12) Intellectual disability 10 (26) 5 (17) 10 (26) 8 (28) 9 (24) 7 (24) 9 (24) 6 (18) 6 (16) 3 (10) Languag e disor der 4 (25) 3 (27) 7 (44) 3 (27) 2 (13) 3 (27) 5 (31) 2 (18) 2 (13) 2 (18) Str ok e 7 (29) 5 (21) 11 (46) 9 (38) 6 (25) 7 (29) 8 (33) 7 (29) 3 (13) 4 (17) Im pair ments Blind 2 (20) 2 (17) 7 (70) 5 (42) 0 (0) 0 (0) 1 (10) 1 (8) 6 (60) 5 (42) Visuall y im pair ed 5 (22) 3 (12) 14 (61) 6 (24) 0 (0) 0 (0) 1 (4) 1 (4) 12 (52) 7 (28) Hear ing im pair ment 0 (0) 2 (25) 1 (8) 2 (25) 0 (0) 1 (13) 1 (8) 1 (13) 1 (8) 2 (25) Fine mo tor im pair ments 10 (21) 5 (18) 14 (29) 10 (36) 8 (17) 6 (21) 16 (33) 8 (29) 12 (25) 5 (18) Speec h im pair ment 5 (28) 3 (14) 7 (39) 7 (33) 7 (39) 9 (43) 9 (50) 8 (38) 1 (6) 2 (10) Difficulties r elated t o concentr ation 14 (13) 11 (19) 24 (22) 16 (28) 16 (14) 13 (23) 30 (27) 19 (33) 25 (23) 10 (18) Difficulties r elated t o f ocusing 10 (12) 8 (18) 24 (28) 11 (25) 15 (17) 9 (20) 28 (33) 14 (302 22 (26) 6 (14) Difficulties r elated t o lac k of self-es teem 15 (18) 6 (17) 21 (26) 6 (17) 15 (18) 1 (3) 24 (29) 11 (31) 23 (28) 1 (3) Difficulties r elated t o lear ning ne w t hings 7 (19) 6 (30) 15 (41) 7 (35) 9 (24) 6 (30) 16 (43) 10 (50) 10 (27) 3 (15) Difficulties r elated t o memor y 13 (17) 9 (19) 27 (36) 14 (30) 16 (21) 10 (21) 28 (37) 20 (43) 22 (29) 6 (13) Difficulties r elated t o r eading 18 (31) 11 (31) 23 (40) 14 (39) 21 (36) 10 (28) 21 (36) 18 (50) 13 (22) 7 (19) Difficulties r elated t o wr iting 15 (29) 13 (30) 23 (45) 18 (42) 15 (29) 12 (28) 16 (31) 20 (47) 11 (22) 8 (19) Difficulties r elated t o social f ear 5 (13) 2 (8) 12 (31) 2 (8) 7 (18) 2 (8) 9 (23) 7 (27) 13 (33) 0 (0) Difficulties r elated t o S tar t or s top activities 13 (14) 8 (16) 21 (23) 11 (22) 17 (19) 9 (18) 32 (35) 17 (35) 25(27) 7 (14) Difficulties r elated t o t he ability t o unders tand 13 (30) 8 (30) 18 (42) 10 (37) 16 (37) 12 (44) 14 (33) 13 (48) 8 (19) 7 (26) Sensitiv e f or s trong im pr essions 16 (13) 2 (6) 30 (24) 6 (18) 16 (13) 5 (15) 38 (31) 7 (21) 37 (30) 5 (15)
the lowest proportions of using online banking (41%) and online shopping (43%).
In regard to accommodation, people living in specially arranged accommodations or institutions reported the lowest proportions of using online banking (36%) and online shopping (35%).
3.5 Use of social media: blogging and Facebook In all disability groups, more women than men reported use of social media, in response to questions on blogging and use of Facebook. The largest proportion of participants having a blog was reported by women with ADD (30%), Table 4 Number (n) and proportion (%) of participants by each diagnosis/impairment who reported that they have used online banking and shopping, and number and proportion of those who have used the services that find them difficult
a Data for internet banking from IIS 2017
b The total number of people in the Swedish population in 2017 was 9.995.000 (Eurostat)
Have used internet
banking to pay bills Find paying bills with internet banking
difficult
Have done online
shopping Find online shop-ping difficult
Reference numbers reported in the general
Swedish populationa,b Women% Men% Total population
91% 96% No data 90% No data
Women
n (%) Menn (%) Womenn (%) Menn (%) Womenn (%) Menn (%) Womenn (%) Menn (%) Diagnoses
ADD 25 (83) 8(57) 1 (4) 0 (0) 25 (93) 11 (79) 0 (0) 0 (0)
ADHD 51 (93) 17 (65) 3 (6) 2(11) 51 (94) 19(76) 4 (8) 0 (0)
Aphasia 10 (63) 7 (50) 1 (9) 2 (20) 7 (47) 6 (46) 3 (27) 0 (0)
Autism spectrum disorder 81 (82) 47 (73) 8 (9) 4 (8) 82 (87) 49 (78) 7 (8) 0 (0)
Bipolar 13 (100) 7 (78) 0 (0) 1 (11) 12 (92) 7 (70) 0 (0) 0 (0) Depression, anxiety 92 (84) 34 (77) 12 (13) 5 (14) 88 (82) 30 (68) 12 (14) 2 (6) Dyscalculia 12 (67) 7 (64) 2 (15) 3 (33) 16 (94) 8 (73) 4 (24) 2 (22) Dyslexia 44 (77) 32 (73) 6 (13) 5 (14) 46 (81) 31 (70) 10 (20) 5 (14) Epilepsy 7 (70) 15 (79) 3 (38) 4 (25) 7 (78) 9 (47) 0 (0) 5 (42) Intellectual disability 15 (37) 9 (26) 7 (35) 5 (36) 15 (38) 9 (26) 7 (33) 4 (33) Language disorder 9 (53) 4 (25) 3 (30) 2 (25) 12 (71) 5 (31) 3 (25) 0 (0) Stroke 19 (73) 14 (56) 1 (5) 3 (18) 15 (58) 11 (46) 3 (15) 0 (0) Impairments Blind 7 (64) 11 (92) 2 (22) 2 (18) 9 (75) 9 (75) 4 (40) 4 (36) Visually impaired 23 (8) 21 (81) 2 (8) 1 (5) 22 (85) 21 (81) 5 (22) 5 (22) Hearing impairment 10 (83) 7 (78) 0 (0) 0 (0) 8 (62) 7 (78) 0 (0) 0 (0)
Fine motor impairments 37 (76) 18 (55) 3 (8) 3 (15) 35 (73) 17 (53) 9 (23) 5 (23)
Speech impairment 12 (60) 12 (48) 2 (15) 5 (33) 8 (40) 8 (32) 3 (27) 3 (21)
Difficulties related to concentration 92 (80) 40 (60) 11 (12) 6 (13) 93 (83) 37 (59) 13 (13) 7 (16)
Difficulties related to focusing 68 (79) 34 (68) 11 (16) 3 (8) 73 (88) 28 (58) 12 (16) 6 (17)
Difficulties related to lack of self-esteem 66 (79) 29 (81) 7 (10) 5 (16) 64 (78) 26 (72) 13 (18) 2 (7)
Difficulties related to learning new things 25 (63) 11 (42) 6 (23) 4 (33) 26 (65) 8 (33) 6 (21) 0 (0)
Difficulties related to memory 63 (81) 32 (60) 10 (16) 7 (18) 62 (81) 23 (43) 14 (21) 5 (16)
Difficulties related to reading 43 (73) 24 (57) 8 (18) 7 (25) 41 (69) 22 (51) 7 (16) 4 (15)
Difficulties related to writing 36 (68) 24 (50) 7 (18) 7 (23) 37 (71) 22 (45) 11 (27) 5 (17)
Difficulties related to social fear 34 (85) 22 (79) 1 (3) 4 (17) 30 (77) 22 (85) 5 (16) 2 (8)
Difficulties related to start or stop activities 74 (79) 35 (64) 9 (11) 4 (11) 76 (84) 35 (66) 11 (14) 6 (15)
Difficulties related to the ability to understand 25 (54) 16 (47) 5 (19) 6 (32) 26 (55) 11 (33) 8 (27) 4 (25)
ADHD (16%), autism spectrum (32%), bipolar syndrome (46%), depression/anxiety (25%) and dyscalculia (26%). The ADD group had the largest proportion of men having a blog (14%). In several disability groups, i.e. bipolar, blind, dyscalculia, dyslexia, fine motor impairments, intellectual disability and language impairment, no men had a blog. In the general Swedish population, it has been reported that 8% of both women and men have a blog [51]. The use of Face-book varied from 41% (men with difficulties to understand) to 93% (women with ADHD). In all disability groups more women than men reported using Facebook, and in several disability groups larger proportions reported use of Face-book (ADD 87%, ADHD 83%, autism 77%, bipolar 80%, depression/anxiety 80%, dyscalculia 84% and dyslexia 82%) as compared to the reported proportion in Swedish popula-tion (74%).
In regard to education, people having studied at special schools for students with intellectual disabilities reported the lowest proportions of having a blog (8%) and using Face-book (67%).
In regard to accommodation, people living in specially arranged accommodations or institutions reported the low-est proportions of having a blog (8%) and using Facebook (46%).
3.6 Inclusion in the digital society
The proportion of people in each disability group who do not feel included in the digital society is presented in Fig. 2. The proportion of participants in each disability group that do not feel included in the digital society varies from 0 to 44%. The largest proportion was reported among women with aphasia: of whom 44% do not feel included. Corresponding proportion in the general Swedish population that do not feel included in the digital society was 5% for women and 6% for men according to Statistics from IIS 2017 [51]. While there are almost no gender differences in the general population, there are gender differences between disability groups in our material. In most of the disability groups, larger proportion of men than women reported that they do not feel digitally included. In many disability groups, the vast majority of par-ticipants reported that they feel included. The largest propor-tions of participants who feel digitally included were found among blind, visually impaired, dyslexia, hearing impaired, ADD, ADHD and autism spectrum.
In regard to education, the largest proportion of partici-pants who do not feel included in the digital society was among people having studied at special schools for students with intellectual disabilities (12%).
In regard to accommodation, the largest proportion of participants who do not feel included in the digital society was among people living in specially arranged accommoda-tions or instituaccommoda-tions (19%).
4 Discussion
Previous research by Dobransky and Hargittai [24] called for disaggregated categories of disabilities. In this paper we present how people in 28 disability groups have access to and use of the internet. We have developed an adapted snowball sampling method to penetrate deep into popula-tions of people with disabilities in Sweden. We mirrored two large surveys of the whole Swedish population, SCB [52] and IIS [51]. Our survey presents larger proportions of people with disabilities whom find the internet difficult, than the SCB and IIS surveys. This suggests that difficul-ties related to disability might have been underestimated in previous nationwide surveys, and that estimations of how many people with disabilities that find the internet difficult need to be reconsidered.
A majority of participants, 68%, reported having more than one diagnosis/impairment with an average of 4 diag-noses/impairments. In 2006, Dobransky and Hargittai reported that 44% of the disabled participants had more than one disability [24]. The combined effects of having multiple impairments is not yet understood and research focusing on one diagnosis/impairment at the time, will not clarify the nature of difficulties facing people with multiple impairments. By asking about several aspects, i.e. access to and difficulties in use of devices, as well as use of and difficulties to use general functions and specific resources on the internet, we are able to describe divides in-between and within disability populations.
In summary, the results of this survey to people with disabilities show that there are differences between dis-ability groups in access to devices, use of the internet and in perceived difficulties in use of the internet. Among dis-ability groups related to language and intellectual impair-ments the lowest proportions reported having access to devices and the highest proportions reported difficulties in use of the internet. Among the ADD, ADHD, autism and bipolar disability groups, large proportions reported hav-ing access to devices and reported the least difficulties in using the internet. Overall, the results of this survey sug-gest that most people with disabilities are lagging behind the general population, in that:
• they have less access to devices;
• they use the internet to pay bills less;
• they use the internet for online shopping less;
• they use mobile bank ID for identification less;
• they feel less included in the digital society.
In regard to access to and difficulties in use of devices, the results show that the smartphone is increasingly becoming the most important device for accessing the
internet. In our study, in some groups, the smartphone penetration is higher than computer penetration. The largest device related gap is among those who use tab-lets. As presented by the ISS survey [53], 69% of the Swedish population has a tablet. In our survey, 79% of women with dyslexia have access to a tablet. All other groups reported less access to tablets than the Swedish
population. The IIS-survey 2017 report on the number of devices households and persons has to access the internet [53]. The reason for highlighting the number of devices is the increasing importance for a digital citizen to be able to be connected anywhere. For participation/acting as a digital citizen in a modern society you need one small portable unit and a unit with larger screen at home. Of the Fig. 2 Proportion of women
and men in the disability groups who do not feel included in the digital society. Correspond-ing proportion in the general Swedish population was 5% for women and 6% for men according to Statistics from IIS
2017 [51] 7 0 44 2 0 2 17 3 23 11 16 0 4 13 14 16 19 21 10 19 7 14 22 22 12 19 0 7 7 3 10 12 8 2 8 24 14 8 0 8 6 10 8 13 5 17 3 7 14 18 4 18 ADD ADHD Aphasia Autism Spectrum Disorder Bipolar Depression, Anxiety Dyscalculia Dyslexia Stroke Language disorder Intellectual disability Blind Visually impaired Difficulties related to Concentration Sensitive for strong impressions Difficulties related to Reading Difficulties related to Memory Fine motor impairments Difficulties related to Lack of self-esteem Difficulties related to Writing Difficulties related to Social fear Difficulties related to Focusing Difficulties related to the ability to Understand Difficulties related to Learning new things Difficulties related to Start or stop activities Speech impairment
participants in our study 86% per cent reported having two devices or more. In the Swedish population, 88% have two devices or more [53]. The gap is larger among those who have all three devices. Compared to 48% in our survey, 62% of the Swedish population have access to all three devices (smartphone, computer and tablet).
Overall, largest proportions of people reporting dif-ficulties in using the Internet are language-related dis-abilities. They are followed by intellectual disabilities and memory-related disabilities. Smaller proportions of people with vision impairments report difficulties than most other groups, indicating that the work on accessibility for the blind and people with low vision have improved accessibility for those groups. Visually impaired people pioneered in the struggle for web accessibility, and a lot of their demands have found its way into standards. The ETSI report [54] is an example of a standard, highly influenced by a vision impairment perspective. Developments in this area might be used as a blueprint for increasing web accessibility in other disability groups. Also in our study, as in the work of Dobransky and Hargittai, low proportions in people with hearing impairments report difficulties [24].
In regard to use of the internet, men with disabilities lag behind women with disabilities and men with disabili-ties lag far behind the whole Swedish population. In some groups, women with disabilities use the internet equally or more as the Swedish population. However, the picture is not consistent. For ADD, aphasia, dyscalculia, stroke and blind, women use internet less and feel less included than the men in the same groups. Women with disabilities being ahead of men with disabilities correspond with the similar finding by Dobransky and Hargittai [4], though our results add a more diverse picture. Overall, the findings indicate that women with disabilities, more than men with disabili-ties, use internet for complex services and interactions such as internet banking and online shopping. The most striking example is blogging: 8% of the Swedish population have a blog but 46% of bipolar women and 32% of women within the autism spectrum reported having a blog. Also, the pro-portion of women using Facebook is large in our survey. This corresponds to Dobransky and Hargittai’s findings on women being more active on social media [4]. Overall, the findings indicate that women with disabilities use the inter-net for more complex interactions than men with disabilities. This corresponds to findings noticed by Hargittai and Hsieh [5] and Hargittai and Shafer [8].
The findings indicate that people who have been educated in special schools for students with intellectual disabilities, or living in special housing or institutions, have less access to devices and use the internet less than people with other types of education and accommodation. They seem to be at a higher risk of being digitally excluded. In fact, large proportions of these participants in the survey do not feel
included in the digital society. Low income has been shown to be a predictor of digital exclusion by the underlying expla-nation of low education [3]. We have not used the variable income in our analyses of factors associated with digital inclusion as a proxy for low education, since many of the participants with high education reported very low income. To be digitally literate has become one of the basic compe-tences for humans, alongside with literacy and numeracy. It is so important that OECD has acknowledged being skilled at using digital resources equally important with reading, writing and calculating [55].
There is not one digital disability divide. Our results expose several digital divides facing people with disabili-ties. People with disabilities should not be regarded as one homogenous population. Instead, the digital divides become more visible when ‘people with disabilities’ are disaggre-gated into disability groups, and by doing so we find:
• Divides in access to devices: People in many disability groups report less access to devices, compared to the general Swedish population, but there are also differences between disability groups, and differences related to gen-der, education and accommodation;
• Divides in use of internet related to gender: Women with disabilities use the internet more and for more compli-cated tasks than men with disabilities;
• Divides in perceived inclusion in the digital society: In some of the disability groups larger proportions, com-pared to the Swedish population, reported being excluded from the digital society, but in some disability groups larger proportions compared to the Swedish population reported being included in the digital society;
• Divides are not always disadvantaging people with dis-abilities: Many of the exposed disability digital divides indicate that people with disabilities are disadvantaged, but in the case of engagement in social media the divide is reversed. The clearest example is blogging, where peo-ple with disabilities have a blog more than the Swedish population.
A reasonable objection to our adaptive snowball sampling method is to question the representativeness of the sample. Bearing in mind that stratified random probability sampling methods often do not achieve representation of people with disabilities, it is important to question whether our sampling method provided a representative sample. Some groups are small in our study, but also have low prevalence in the gen-eral population, and for those the result must be seen as indicative. We have presented results for 28 of the 35 groups and to the best of our knowledge this is the first study to do so.
A possible limitation of our study is the risk of over- or underestimation in self-reporting. Estimation of internet
skills by self-reporting is convenient for collecting data from large samples and often used in survey studies but should be accompanied by caution in the interpretation of results [4, 56], due to the risk of over- or underestima-tion of skills [57]. However, we believe that self-reporting (as opposed to actual task testing) was the most appro-priate method for data collection for the purpose of this study. By this, we were able to gather information from a large number of participants and could explore differ-ences between disability groups and differdiffer-ences related to gender and demographic and socio-economic factors. Still, other methods than self-reporting, for example by observations of actual skills, might give deeper under-standing on how to measure digital skills among people with disabilities.
It is important for the interpretation of the results to consider that the participants in this study consist of peo-ple with diagnoses and impairments who do use the inter-net. It is a limitation to the generalizability of the results that we have no results for those people in the disability groups that do not use the internet. It is possible that in every disability group there also exist an unknown pro-portion of people not using the internet at all.
Sweden is among the most digitized countries in the world when it comes to internet usage [58], high broad-band coverage and access to internet-based services. Additionally, it is a country of high social values and is one of the countries where people with disabilities have the best opportunities to participate in the society [59]. As digitalization progresses globally, disability digital divides will become important to monitor also in other countries.
4.1 Implications for policy making
The national policy in Sweden is to promote digital inclu-sion. Disaggregating ‘people with disabilities’ into 35 sub-groups creates opportunities to plan for specific activities. By not treating people with disability as one homogenous group, higher precision in activities aiming to promote participation in the digital society will be obtained. There seems to be a number of prerequisites at play, e.g. demo-graphic and socio-economic factors, which need to be taken into account.
The school system for people with intellectual dis-abilities struggles with promoting inclusion in the digital society and people living in special accommodations or institutions provides by local municipalities are lagging behind in digital inclusion. Both school system and spe-cial accommodations are under public control and might need to be elaborated, both in policy and practice, to better provide for inclusion in the digital society.
4.2 Implications for design
The design community should recognize human diversity in regard to impairments and take such diversity into account when doing design work.
The results of this survey indicate that a focus on vision impairments and other sensory impairments in guidelines, standards and policy to provide accessibility has paid off, since low proportions of participants in those groups report difficulties in the use of devices and the internet. This might indicate an ongoing process to provide more accessible inter-faces for people with sensory impairments. A complimen-tary shift to focus on issues related to especially language and intellectual issues could cater a similar process within the cognitive area. Designers need a better understanding of the prerequisites for participation in the digital society for people with cognitive impairments. Such understanding can be done by a closer collaboration between designers and users with cognitive impairments. Designers might need to revise the design process, develop tools and methods in order to make the design process accessible for people with cognitive impairments. This kind of design is applicable in the intersection of the individual’s use of a specific digital artefact. Design is also relevant in terms of how we design support systems and educational systems. Such systems also need to be accessible. Existing digital divides will probably demand innovative and novel approaches on how to design for inclusion. There are still a large proportion of the popu-lation perceiving current design solutions too difficult and there is a potential for improvements.
5 Conclusions
This paper presents a large set of data describing how people with disabilities have access to, how they use the internet and what barriers they experience. We divided people with diagnoses and impairments into 35 disability groups and have enough data to present results for 28 disability groups. Our findings show that there are differences in digital inclu-sion between sub-groups of diagnoses/impairments. Thus, disability digital divides are preferably investigated by sub-grouping disabilities, rather than studied as one homogene-ous group. The digital divides become more visible when ‘people with disabilities’ are disaggregated into several dis-ability sub-groups. The results of this study indicate that dif-ferences in type of impairment/diagnosis, gender and socio-economic factors, in specific education and accommodation, influence the use of the internet and the perceived difficulties in use of the internet.
We conclude that the results of this study provide a basis for further research to explore the complex set of prerequi-sites for participation in the digital society among people
with disabilities. Further research is needed to expand the understanding of the diversity and complexity inherent in the disability digital divide, and the knowledge on what causes exclusion or inclusion in the digital society for people with disabilities.
Acknowledgements Open access funding provided by Royal Insti-tute of Technology. This work was funded by The Post- and Telecom Authority, The Swedish Consumer Agency, Vinnova and Begripsam AB. The authors are grateful for the valuable contribution by the mem-bers of the Begripsam Group, who have contributed to the development of the survey, selection of target populations and interpretation of the results. The Begripsam Group is constituted by people with own lived experiences of disability, interested in social change towards participa-tion for all.
Compliance with ethical standards
Conflict of interest The authors declare that there are no conflicts of interest.
Open Access This article is licensed under a Creative Commons Attri-bution 4.0 International License, which permits use, sharing, adapta-tion, distribution and reproduction in any medium or format, as long as you give appropriate credit to the original author(s) and the source, provide a link to the Creative Commons licence, and indicate if changes were made. The images or other third party material in this article are included in the article’s Creative Commons licence, unless indicated otherwise in a credit line to the material. If material is not included in the article’s Creative Commons licence and your intended use is not permitted by statutory regulation or exceeds the permitted use, you will need to obtain permission directly from the copyright holder. To view a
copy of this licence, visit http://creat iveco mmons .org/licen ses/by/4.0/.
References
1. World Wide Web Consortium (W3C). World Wide Web Consor-tium (W3C) Launches International Web Accessibility Initiative.
https ://www.w3.org/Press /WAI-Launc h.html (1997). Accessed 5 Jan 2019
2. Directive (EU) 2016/2102 of the European Parliament and of the Council of 26 October 2016 on the accessibility of the websites and mobile applications of public sector bodies. Official Journal of the European Union 2018
3. Scholz, F., Yalcin, B., Priestley, M.: Internet access for disa-bled people: understanding socio-relational factors in Europe.
Cyberpsychol. J. Psychosoc. Res. Cyberspace (2017). https ://doi.
org/10.5817/CP201 7-1-4
4. Dobransky, K., Hargittai, E.: Unrealized potential: exploring the
digital disability divide. Poetics 58, 18–28 (2016). https ://doi.
org/10.1016/j.poeti c.2016.08.003
5. Hargittai, E., Hsieh, Y.P.: Digital inequality. Commun. Res.
(2013). https ://doi.org/10.1177/00936 50208 32178 2
6. Robinson, L., Cotten, S.R., Ono, H., Quan-Haase, A., Mesch, G., Chen, W., et al.: Digital inequalities and why they matter. Inf.
Commun. Soc. 18, 569–582 (2015). https ://doi.org/10.1080/13691
18X.2015.10125 32
7. Perrin, A., Duggan, M.: Americans’ Internet Access: 2000–2015. Pew Research Center, Washington (2015)
8. Hargittai, E., Shafer, S.: Differences in actual and perceived online skills: the role of gender. Soc. Sci. Q. 87, 432–448 (2006) 9. Helsper, E.J., van Deursen, A.J.A.M.: Do the rich get digitally
richer? Quantity and quality of support for digital engagement. Inf. Commun. Soc. 20, 700–714 (2017)
10. Ford, N., Chen, S.Y.: Individual differences, hypermedia naviga-tion, and learning: an empirical study. J. Educ. Multimed. Hyper-media 9, 281–311 (2000)
11. Ahuja, J.S., Webster, J.: Perceived disorientation: an examination of a new measure to assess web design effectiveness. Interact. Comput. 14, 15–29 (2001)
12. Aula, A.: Modeling successful performance in web searching. J. Am. Soc. Inf. Sci. Technol. 57, 1678–1693 (2006)
13. Pan, B., Hembrooke, H., Joachims, T., Lorigo, L., Gay, G., Granka, L.: In Google we trust: users’ decisions on rank, posi-tion, and relevance. J. Comput. Commun. 12, 801–823 (2007) 14. Spink, A.: Searching the web: the public and their queries. J. Am.
Soc. Inf. Sci. Technol. 52, 226–234 (2001)
15. Liebert, M.A., Morahan-Martin, J.M.: Review how internet users find, evaluate, and use online health information: a cross-cultural review. Cyber Psychol. Behav. 7, 497–510 (2004)
16. Eastin, M.S., LaRose, R.: Internet self-efficacy and the psychology of the digital divide. J. Comput. Commun. 6, JCM611 (2000) 17. Torkzadeh, G., Van Dyke, T.P.: Effects of training on Internet
self-efficacy and computer user attitudes. Comput. Hum. Behav. 18, 479–494 (2002)
18. van Deursen, A.J.A.M., van Dijk, J.A.G.M.: Measuring internet skills. Int. J. Hum. Comput. Interact. 26, 891–916 (2010) 19. van Deursen, A., van Dijk, J.: Internet skills and the digital divide.
New Media Soc. 13, 893–911 (2011)
20. van Deursen, A.J.A.M., van Dijk, J.A.G.M.: Internet skill levels increase, but gaps widen: a longitudinal cross-sectional analysis (2010–2013) among the Dutch population. Inf. Commun. Soc. 18,
782–797 (2015). https ://doi.org/10.1080/13691 18X.2014.99454 4
21. Hargittai, E., Hsieh, Y.P.: Succinct survey measures of web-use skills. Soc. Sci. Comput. Rev. 30, 95–107 (2012)
22. van Deursen, A.J.A.M., van Dijk, J.A.G.M., Peters, O.: Proposing a survey instrument for measuring operational, formal, informa-tion, and strategic internet skills. Int. J. Hum. Comput. Interact. 28, 827–837 (2012)
23. Talja, S.: The social and discursive construction of computing skills. J. Am. Soc. Inf. Sci. Technol. 56, 13–22 (2005)
24. Dobransky, K., Hargittai, E.: The disability divide in internet access and use. Inf. Commun. Soc. 9, 313–334 (2006)
25. Kennedy, H., Evans, S., Thomas, S.: Can the web be made acces-sible for people with intellectual disabilities? Inf. Soc. 27, 29–39
(2010). https ://doi.org/10.1080/01972 243.2011.53436 5
26. Sevilla, J., Herrera, G., Martínez, B., Alcantud, F.: Web accessibil-ity for individuals with cognitive deficits. ACM Trans. Comput.
Interact. 14, 12-es (2007). https ://doi.org/10.1145/12797 00.12797
02
27. Carmien, S., Manzanares, A.G.: Elders using smartphones—A set of research based heuristic guidelines for designers. In: Stepha-nidis, C., Antona, M. (eds.) Lecture Notes in Computer Science (Including Subseries Lecture Notes in Artificial Intelligence and Lecture Notes in Bioinformatics). LNCS Part 2, vol. 8514, pp. 26–37. Springer, Cham (2014)
28. Greig, C.-A., Harper, R., Hirst, T., Howe, T., Davidson, B.: Bar-riers and facilitators to mobile phone use for people with aphasia.
Top Stroke Rehabil. 15, 307–324 (2008). https ://doi.org/10.1310/
tsr15 04-307
29. Williams, P., Hennig, C.: Optimising web site designs for people with learning disabilities. J. Res. Spec. Educ. Needs 15, 25–36 (2015)
30. Golofshani, N.: Understanding reliability and validity in qualita-tive research. Qual. Rep. 8, 597–607 (2003)
31. Persson, H., Åhman, H., Yngling, A.A., Gulliksen, J.: Universal design, inclusive design, accessible design, design for all: differ-ent concepts-one goal? On the concept of accessibility-historical, methodological and philosophical aspects. Univers. Access Inf. Soc. 14, 22 (2014)
32. Oliver, M.: Understanding Disability, From Theory to Practice. Macmillan, London (1996)
33. W3C. WCAG, Web Content Accessibility Guidelines 2.1. https ://
www.w3.org/TR/WCAG2 1/ (2017). Accessed 2 Jan 2019 34. Easton, C.: An examination of the Internet’s development as a
disabling environment in the context of the social model of dis-ability and anti-discrimination legislation in the UK and USA. Univers. Access Inf. Soc. 12, 105–114 (2013)
35. Small, J., Schallau, P., Brown, K., Appleyard, R.: Web acces-sibility for people with cognitive disabilities. In: CHI 2005, pp. 1793–1796 (2005)
36. Chadwick, D., Wesson, C., Fullwood, C.: Internet access by peo-ple with intellectual disabilities: inequalities and opportunities.
Future Internet 5, 376–397 (2013). https ://doi.org/10.3390/fi503
0376
37. de Santana, V.F., de Oliveira, R., Almeida, L.D.A., Baranauskas, M.C.C.: Web accessibility and people with dyslexia. In: Pro-ceedings of the International Cross-Disciplinary Conference on
Web Access—W4A’12 ((2012)). https ://doi.org/10.1145/22070
16.22070 47
38. Statistics Sweden (SCB): ICT usage in households. Use of
com-puters and the internet by private persons 2016. https ://www.scb.
se/Stati stik/_Publi katio ner/LE010 8_2016A 01_BR_00_IT01B R1601 .pdf (2016). Accessed 5 Jan 2019
39. The Internet Foundation in Sweden (ISS): https ://www.iis.se/engli
sh/. Accessed 5 Jan 2019
40. Creswell, J.: Qualitative Inquiry and Research Design: Choosing Among Five Approaches. SAGE Publications, Thousand Oaks (2012)
41. Lavrakas, P.J.: Encyclopedia of Survey Research Methods. SAGE Publications, Thousand Oaks (2008)
42. Newell, A.F., Gregor, P., Morgan, M., Pullin, G., Macaulay, C.: User-sensitive inclusive design. Univers. Access Inf. Soc. 10,
235–243 (2011). https ://doi.org/10.1007/s1020 9-010-0203-y
43. Johansson, S., Gulliksen, J., Lantz, A.: User participation when users have mental and cognitive disabilities. In: ASSETS 2015: The 17th International ACM SIGACCESS Conference of Com-puters and Accessibility. ACM, pp. 69–76 (2015)
44. Bergold, J., Stefan, T.: Participatory research methods: a meth-odological approach in motion. Forum Qual. Soc. Res. 13:Art. 1
(2012). http://www.quali tativ e-resea rch.net/index .php/fqs/artic le/
view/1801
45. Kirkwood, B.R., Sterne, J.A.C.: Essential Medical Statistics, 2nd edn. Blackwell Science, Malden (2003)
46. Statistics Sweden (SCB): The Swedish Population. http://www.
stati stikd ataba sen.scb.se/pxweb /sv/ssd/START __BE__BE010 1__BE010 1A/Befol kning Ny/?rxid=7757f b53-cf9f-4c15-a578-d37f0 f1c86 99 (2019). Accessed 10 Sep 2019
47. Statistics Sweden (SCB): The level of education in the population (in Swedish: Befolkningens utbildning) (2018)
48. Ekonomifakta: What is the Population doing? (in Swedish: Vad
gör befolkningen?). https ://www.ekono mifak ta.se/fakta /arbet
smark nad/befol kning /befol kning -och-arbet smark nad/ (2019). Accessed 4 Oct 2019
49. Statistics Sweden (SCB): Average Incomes in Sweden (in
Swed-ish: Medellöner i Sverige). https ://www.scb.se/hitta -stati stik/
sveri ge-i-siffr or/utbil dning -jobb-och-penga r/medel loner -i-sveri
ge/ (2019). Accessed 5 Sept 2019
50. Statistics Sweden (SCB): Households in Sweden (in
Swed-ish: Hushållens boende). https ://www.scb.se/hitta -stati stik/stati
stik-efter -amne/husha llens -ekono mi/inkom ster-och-inkom stfor delni ng/husha llens -boend e/ (2019). Accessed 5 Sept 2019 51. The Internet Foundation in Sweden (IIS): The Swedes and the
Internet 2017. http://www.soi20 17.se/the-swede s-and-the-inter
net-2017-summa ry/ (2017). Accessed 8 Jan 2018
52. Statistics Sweden (SCB): Use of computers and the internet by private persons 2016 (in Swedish: Privatpersoners användning
av datorer och internet 2016). https ://www.scb.se/Stati stik/_Publi
katio ner/LE010 8_2016A 01_BR_00_IT01B R1601 .pdf (2016). Accessed 8 Jan 2018
53. The Internet Foundation in Sweden (IIS): The Swedes and the Internet 2017—access to devices (in Swedish: Svenskarna och internet 2017 - Innehav av utrustning). Svenskarna och internet
2017. https ://2017.svens karna ochin terne t.se/allma nt-om-utvec
kling en/inneh av-av-utrus tning / (2017). Accessed 20 Sept 2018 54. ETSI: EN 301 549—Accessibility Requirements Suitable for
Pub-lic Procurement of ICT. ETSI, Sophia Antipolis (2014) 55. OECD: Skills for a Digital World. OECD, Paris (2016)
56. Hargittai, E.: Survey measures of web-oriented digital literacy. Soc. Sci. Comput. Rev. 23, 371–379 (2005)
57. Merritt, K., Smith, D., Di Renzo, J.: An investigation of self-reported computer literacy: is it reliable? Issues Inf. Syst. 6, 289–295 (2005)
58. World Economic Forum. Network Readiness Index. http://repor
ts.wefor um.org/globa l-infor matio n-techn ology -repor t-2016/ netwo rked-readi ness-index / (2016). Accessed 5 Jan 2019
59. OECD: OECD Better Life Index. http://www.oecdb etter lifei
ndex.org/count ries/swede n/ (2018). Accessed 21 Sept 2018 60. Karlsson, T., Classon, E., Rönnberg, J.: The brain-friendly
workplace—cognition, cognitive disability and working envi-ronment (in Swedish: Den hjärnvänliga arbetsplatsen - kogni-tion, kognitiva funktionsnedsättningar och arbetsmiljö). Stock-holm (2014)
61. Johansson, M.B.: Aphasia and Communication in Everyday Life. Uppsala University, Uppsala (2012)
62. Lundström, S., Reichenberg, A., Anckarsäter, H., Lichtenstein, P., Gillberg, C.: Autism phenotype versus registered diagnosis in Swedish children: prevalence trends over 10 years in general population samples. BMJ 350, 1–6 (2015)
63. Kingdom, U., Inter-, C.I.D.: Prevalence and correlates of bipolar spectrum disorder in the world mental health survey initiative. Arch. Gen. Psychiatry 68, 241–251 (2011)
64. Oskui, M., Coutinho, F., Dykeman, J., Jette, N., Pringheim, T.: An update on the prevalence of cerebral palsy: a systematic review and meta-analysis. Dev. Med. Child Neurol. 55, 509–519 (2013)
65. Alzheimer Europe: Sweden 2013: the prevalence of dementia in
Europe. https ://www.alzhe imer-europ e.org/Polic y-in-Pract ice2/
Count ry-compa rison s/2013-The-preva lence -of-demen tia-in-Europ e/Swede n (2013). Accessed 11 Oct 2018
66. Adler, M., Knorring, L., Von Oreland, L.: Depression—back-ground and treatment (in Swedish: Depression – bakgrund och behandling) (2016)
67. OECD: OECD Skills Outlook 2013—First Results from the Sur-vey of Adult Skills. OECD, Paris (2013)
68. Gross-Tsur, V., Manor, O., Shalev, R.S.: Developmental dyscalcu-lia: prevalence and demographic features. Dev. Med. Child
Neu-rol. 38, 25–33 (2008). https ://doi.org/10.1111/j.1469-8749.1996.
tb150 29.x
69. The Swedish Dyslexia Association (Svenska Dyslexiföreningen): How common are difficulties in reading and writing/dyslexia? (in
Swedish: Hur vanligt är läs- och skrivsvårigheter/dyslexi?). https
://www.dysle xifor ening en.se/page2 / (2018). Accessed 20 Aug 2018
70. Forsgren, L., Beghi, E., Õun, A., Sillanpää, M.: The epidemiology of epilepsy in Europe—a systematic review. Eur. J. Neurol. 12, 245–253 (2005)
71. National Center for Biotechnology Information U.S. National
Library of Medicine: Prevalence of Intellectual Disabilities. https
://www.ncbi.nlm.nih.gov/books /NBK33 2894/ (2018). Accessed 12 Aug 2018
72. Norbury, C.F., Gooch, D., Wray, C., Baird, G., Charman, T., Simonoff, E., et al.: The impact of nonverbal ability on prevalence and clinical presentation of language disorder: evidence from a population study. J. Child Psychol. Psychiatry 57, 1247–1257 (2016)
73. Ahlgren, C., Odén, A., Lycke, J.: High nationwide prevalence of multiple sclerosis in Sweden. Mult. Scler. J. 17, 901–908 (2011) 74. Swedish Neuro Registries: The registry for Parkinson’s disease.
http://neuro reg.se/en.html/parki nsons -disea se (2018). Accessed 11 Aug 2018
75. The National Board of Health and Welfare (Socialstyrelsen): Stroke Statistics 2016 (in Swedish: Statistik om stroke 2016) (2017)
76. Mcgrath, J., Saha, S., Chant, D., Welham, J.: Schizophrenia: a concise overview of incidence, prevalence, and mortality. Epide-miol. Rev. 30, 67–76 (2008)
77. Perälä, J., Suvisaari, J., Saarni, S., Kuoppsalmi, K., Isometsä, E., Pirkola, S., et al.: Lifetime prevalence of psychotic and bipolar I
disorders in a general population. Arch. Gen. Psychiatry 64, 19–28 (2007)
78. The National Board of Health and Welfare (Socialstyrelsen): Report on Public Health 2009 (in Swedish: Folkhälsorapport 2009) (2009)
79. Werngren-Elgström, M., Dehlin, O., Iwarsson, S.: A Swedish prevalence study of deaf people using sign language: a prerequi-site for deaf studies. Disabil. Soc. 18, 311–323 (2003)
80. National Knowledge-center on Deafblindness (Nationellt Kun-skapscenter för dövblindfrågor): Prevalence of deafblindness (in
Swedish: Förekomst av dövblindhet). https ://nkcdb .se/dovbl indhe
t/fakta -om-dovbl indhe t/forek omst/. Accessed 4 Aug 2018 81. Johansson, M.S.K., Arlinger, S.D.: Prevalence of hearing
impair-ment in a population in Sweden: prevalencia de las pérdidas audi-tivas en una población de Suecia. Int. J. Audiol. 42, 18–28 (2003) 82. Butterworth, B., Kovas, Y.: Understanding neurocognitive devel-opmental disorders can improve education for all. Science 340, 300–305 (2013)
Publisher’s Note Springer Nature remains neutral with regard to jurisdictional claims in published maps and institutional affiliations.