MASTER THESIS
T
T
o
o
A
A
n
n
a
a
l
l
y
y
z
z
e
e
T
T
h
h
e
e
R
R
e
e
l
l
a
a
t
t
i
i
o
o
n
n
s
s
h
h
i
i
p
p
b
b
e
e
t
t
w
w
e
e
e
e
n
n
B
B
O
O
D
D
,
,
N
N
i
i
t
t
r
r
o
o
g
g
e
e
n
n
A
A
n
n
d
d
P
P
h
h
o
o
s
s
p
p
h
h
o
o
r
r
u
u
s
s
C
C
o
o
n
n
t
t
e
e
n
n
t
t
s
s
a
a
t
t
C
C
o
o
n
n
s
s
t
t
a
a
n
n
t
t
D
D
i
i
s
s
s
s
o
o
l
l
v
v
e
e
d
d
O
O
x
x
y
y
g
g
e
e
n
n
C
C
o
o
n
n
c
c
e
e
n
n
t
t
r
r
a
a
t
t
i
i
o
o
n
n
I
I
n
n
M
M
u
u
n
n
i
i
c
c
i
i
p
p
a
a
l
l
W
W
a
a
s
s
t
t
e
e
w
w
a
a
t
t
e
e
r
r
T
T
r
r
e
e
a
a
t
t
m
m
e
e
n
n
t
t
.
.
Juthatip Sudthanom & Syed Faraz Ali Zaidi
May 2011
i
Abstract
In this report, the application of Principle Component Analysis (PCA) and Partial Least Square (PLS) regression analyzing methods used to understand the relationship of interdependent loads in municipal wastewater treatment plant. Two different wastewater treatment plants were chosen for analysis of the relationship between interdependent loads. Firstly, the collected data of incoming wastewater and outgoing water from both Västerås and Eskilstuna wastewater treatment plants were analyzed to find some relationship or correlation between contents and compare the data of both the plants. Secondly, the correlated contents were used to generate the regression model for predicting the value in the future, in this report we have focussed only on ammonium nitrogen value for regression model. The PCA study shows the variation between incoming and outgoing wastewater’s characteristics given by Västerås and Eskilstuna plant.
Keywords: BOD, ammonium nitrogen, nitrogen, phosphorus, suspended solids, wastewater
treatment.
ii
Acknowledgement
To complete this Master thesis report, we had received a lot of information and valuable guidance from our supervisor, Prof. Erik Dahlquist. Thus, we wish to express our deepest gratitude and appreciation to him for his generosity, critics and intellectual support.
Next, we would like to thank Mr. Forsberg Håkan, Process Engineer in Malar Energi Wastewater Treatment Plant Vasteras who generously provided a lot of informative data of the plant regarding to our study.
Sincere gratitude goes to Sven Hamp and Lena Johansson Westholm for their constructive comments and guidance about our thesis report.
The moral supports and concerns we constantly received from our family and friends are well acknowledged. We are thankful to them in supporting us for this report completion.
iii
Table of Contents
Abstract ... i
Acknowledgement... ii
Figure and table list ...iv
Chapter 1: Introduction ... 1
1.1 The importance of wastewater treatment... 1
1.2 Characteristics of wastewater ... 2
1.3 Overview of conventional wastewater treatment ... 4
1.4 Mechanical and chemical cleaning steps of Västerås WWTP……….. 5
1.5: Biological treatment steps in Västerås WWTP……….8
1.6: Sludge Handling in Västerås WWTP……….9
1.7: Overall Biological Treatment...10
Chapter 2: Background ... 12
2.1 Problem description ... 12
2.2 Objective ... 13
2.3 Material and method ... 13
2.3.1 Overview of methodology ... 13
2.3.2 Material and Method ... 13
Chapter 3: Biological wastewater treatment ... 15
3.1 Biological Nitrogen Removal (BNR) ... 15
3.1.1 Biological Nitrification ... 15
3.1.2 Biological Denitrification ... 16
3.1.3 Ammonia Stripping ... 16
3.2 Biological phosphorus removal ... 16
Chapter 4: ANALYSIS by Principal Component Analysis(PCA) ... 18
4.1 Correlation analysis... 18
4.2 Regression model for ammonium nitrogen ... 20
4.2.1 Incoming ammonium nitrogen regression model ... 20
4.2.2 Outgoing ammonium nitrogen regression model ... 21
Chapter 5: Results and Discussions ... 22
5.1 The Inter-relationship between Municipal Wastewater Components: ... 22
5.1.1 Winter (February) ... 22
iv
5.1.3 Air flow Pattern: ... 24
5.1.4 Ammonium and BOD ... 25
5.1.5 Phosphorus (filtered) and BOD ... 25
5.1.6 Total Phosphorus and BOD ... 26
5.1.7 PCA Result # 01………..27 5.1.8 PCA Result # 02………27 5.1.9 PCA Result # 03………28 5.1.10 PCA Result # 04……….28 5.2 Discussions ... 29 Chapter 6: Conclusion... 30 Bibliography ... 31 Appendix ... 32
v
Figure and table list
Figure 1: Variation of the BOD7 and NH4+ concentration in the wastewater at Västerås (Sweden) from
January 2010 to December 2010……….4
Figure 2: Scheme of a conventional wastewater treatment process configuration, as installed at Västerås WWTP………5
Figure 3:1A Inlet pumping station, Västerås WWTP ………..………..6
Figures 4 and 5: 1D-Sedimentation, Västerås WWTP ………..………7
Figure 6: 2A Biobassänger ,Västerås WWTP ………8
Figure 7: The presentation of 2B,2C and 2D, Västerås WWTP ………...9
Figure 8: Activated sludge method (Encyclopeadia Britanica)...10
Figure 9: Biological water purification, Mälarenergi (Västerås ) WWTP………..12
Figure 10: The overview of methodology………..13
Figure 11: Biological wastewater treatment, Mälarenergi (Västerås )WWTP……….15
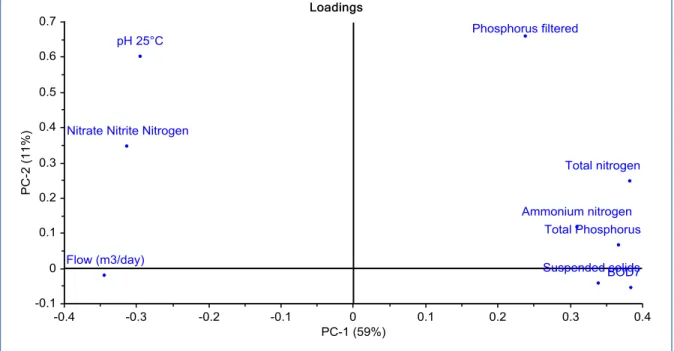
Figure 12: Principal component analysis of incoming wastewater, Västerås WWTP………..18
Figure 13: Principal component analysis of incoming wastewater, Eskilstuna WWTP……….19
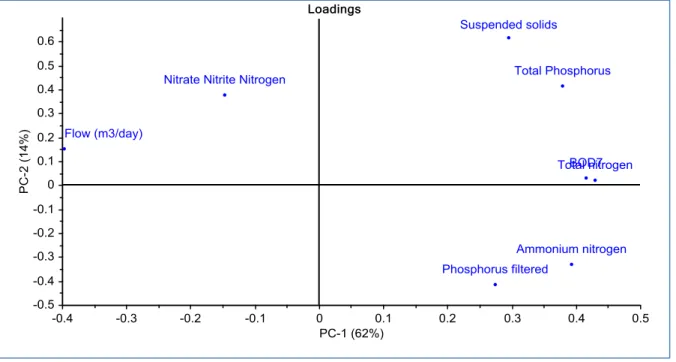
Figure 14: Principal component analysis of outgoing water, Västerås WWTP………..19
Figure 15: Principal component analysis of outgoing water, Eskilstuna WWTP………20
Figure 16: The inter-relationship between constituents of municipal wastewater for February 2010 ... ….. 22
Figure 17: The inter-relationship between constituents of municipal wastewater for September 2010 ... . 23
Figure 18: The air flow pattern per hour comparing between winter and summer time ... 24
Figure 19: Variation of the BOD7 and NH4+ concentration in the wastewater at Västerås (Sweden) from January 2010 to December 2010 ... 25
Figure 20: Variation of the BOD7 and phosphorus filtered concentration in the wastewater at Västerås (Sweden) from January 2010 to December 2010 ... 25
Figure 21: Variation of the BOD7 and total phosphorus concentration in the wastewater at Västerås (Sweden) from January 2010 to December 2010 ... 26
Figure 22: PCA for incoming wastewater in February11, 2010(09:20-09:28)………27
Figure 23: PCA for incoming wastewater in August 11, 2010(13:30)………..27
Figure 24: PCA for outgoing water in February25, 2010(08:00-08:08)………..28
Figure 25: PCA for outgoing water in August 26, 2010(08:15-08:22)………..28
Figure 26: Table of incoming wastewater data from Västerås WWTP... 32
Figure 27: Table of outgoing water data from Västerås WWTP ... 32
vi Figure 29: Table of outgoing water data from Eskilstuna WWTP ... 32
Table 1: Selected physical, chemical and biological characteristics commonly analysed in wastewater treatment and their significance in terms of process design and performance (Caballero, 2011)……..3 Table 2 : Overall Performance of Mälarenergi (Västerås ) WWTP………..11
1
Chapter 1: Introduction
Water, water and water, the life without water has no meanings, no value and no sustainability. It is as important for all animals and plants as for human beings.
Water is said to be polluted when it includes enough impurities to make it unhealthy for a specific use, such as drinking, swimming, or fishing (Nathanson, 2011). House as well as industry consume water and give out wastewater. Municipal wastewater is of domestic origin and its quantity depends on the number of people (Srinivas, 2008). There are three types of sewage: domestic sewage, industrial sewage and storm sewage. Domestic sewage possesses used water from houses and apartments; it is also called sanitary sewage. The difference between two samples of wastewater is due to their locations as well as their constituents. Domestic wastewater includes typical wastes from the kitchen, bathroom and laundry. (Bansode, 2002).In our analysis work, for municipal wastewater , we concerned with the degree of impurities (N and P compounds) removal with the passage of different seasons of the year and also compare the effect of this on chemical oxygen demand, air flow and fluid flow with constant value of dissolved oxygen.For this purpose we consulted to the two wastewater treatment plants.
1.1 The importance of wastewater treatment
Water pollution is one of the great problems in the universe for environment safety purpose.It affects the equatic life as well as humen health.
Due to the drainage of polluted wastewater into groundwater or surface water , water pollution is created and wastewater treatment is applied to control water pollution.
Wastewater treatment is also called sewage treatment which is the removal of contamination from wastewater, or sewage, before reaching natural bodies of water such as rivers, lakes and oceans (Nathanson, 2011).
Municipal wastewater treatment provides an essential community service for the protection of public health and the environment. Wastewater treatment is needed so that we can use our rivers and streams for fishing, swimming and drinking purposes.
The main objective of wastewater treatment is to restore and maintain the chemical, physical and biological integrity of waters.. There is a rapid growth in the re-use of municipal wastewater for irrigation and ground water recharge, which necessitates enhanced treatment to remove nutrients (nitrogen and phosphorus), suspended solids, and other contaminants.
2 1.2 Characteristics of wastewater
Municipal wastewater is slightly more than 99.9 percent pure water by weight. The rest, less than 0.1 percent, contains a wide variety of dissolved and suspended impurities (Nathanson, 2011).
Characteristic of municipal wastewater is based on its physical properties as well as its organic and inorganic pollutants. Physical properties of wastewater contains odor, color and turbidity caused by suspended or dissolved solids. Organic pollutants contain phenols, hydrocarbons ,biological oxygen demand (BOD), carbohydrates, fats and starches . Inorganic pollutants comprises of compounds of trace minerals, nitrogen and phosphorous.
The characteristics of municipal wastewaters are varied, depending upon the sources of discharge, the effluents from industries, land uses and groundwater levels (Bansode, 2002). There is a wide variety of constituents which spoil the properties of pure water specially for drinking purpose. Also physical attributes of municipal wastewater, organic and inorganic contaminants must be considered.
The main constituents of the wastewater are suspended solids (SS), biodegradable organics (proteins, carbohydrate and fats), nutrients (N and P compounds), pathogens (organisms which are able to transmit diseases), priority pollutants (carcinogens, mutagens and teratogens), refractory organics (surfactants, phenols and pesticides), heavy metals and dissolved inorganic compounds (calcium, sodium and sulfate) (Metcalf and Eddy, 2003). The physical and chemical dynamics of constituents are important for designing and establishing the optimal treatment option for each wastewater sample. However, the complete analysis of the composition of wastewater is impractical.
Each of the main wastewater constituents can be divided into biodegradable and non-biodegradable fractions (Water Environment Federation , 2005).
3 Table 1: Selected physical, chemical and biological characteristics commonly analysed
in wastewater treatment and their significance in terms of process design and performance (Caballero, 2011)
CHARACTERISTIC SIGNIFICANCE
Temperature To design the most suitable biological processes
Ammonia (NH4+)
Organic Nitrogen (Org N)
Nitrites(NO2-) and Nitrates (NO3-)
Total Nitrogen (TN)
Total Phosphorus (TP)
A measure of the nutrients and degree of decomposition of a wastewater
pH A measure of the acidity or basicity of a wastewater
Biological oxygen demand (BOD)
Chemical Oxygen demand (COD)
Total organic carbon (TOC)
4
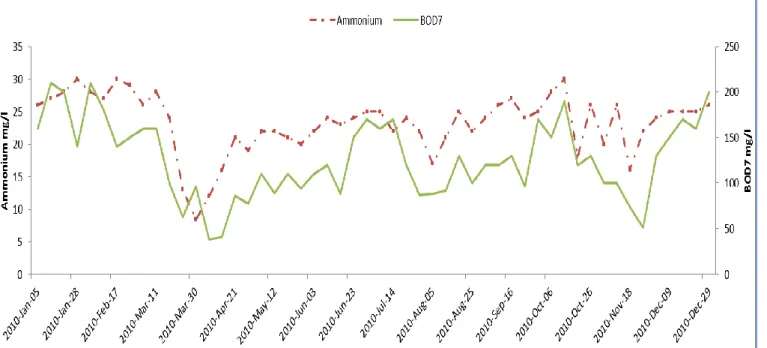
The composition of wastewater varies by place, time and source. The organic and nutrient load, and the temperature are the Important parameters that vary in terms of time.For examples, fig. 1 shows the variation of the organic content (in terms of BOD7), and the N
content (in terms of NH4+) in the wastewater of Västerås (Sweden).
Figure 1: Variation of the BOD7 and NH4+ concentration in the wastewater at Västerås
(Sweden) from January 2010 to December 2010
1.3 Overview of conventional wastewater treatment
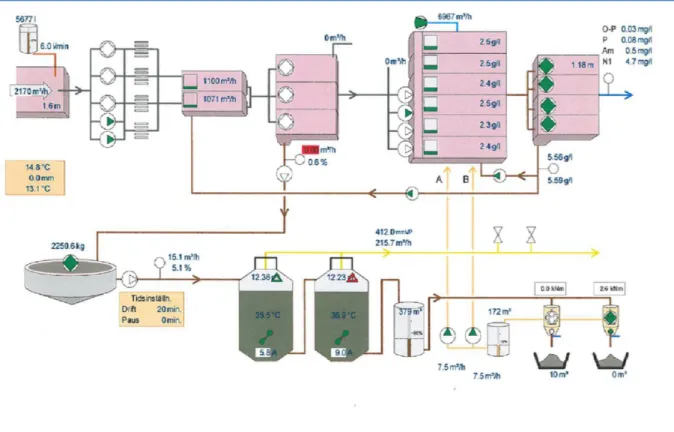
Each constituent of wastewater needs specific treatment procedures involving physical, chemical and biological systems. Figure 2 shows the different treatment processes, which can be grouped in a number of levels known as preliminary, primary, advanced primary, secondary, secondary with nutrient removal, tertiary and advanced.
5 Figure 2: Scheme of a conventional wastewater treatment process configuration, as installed at Västerås WWTP.
Here we describe each part/step of municipal wastewater treatment plant in figure: 2. 1.4 : Mechanical and chemical cleaning steps of Västerås WWTP
1.4.1: 1A-Inlet pumping station:
It is the first step having lifting height about 9 meters.there are 3 worm pumps, 2 centrifugal pumps and total capacity of this station is 16 200 cubic meters .The volumetric flow rate is 3000 cubic meter per hour.In this step ,we pre-precipitate it with iron sulphate of
6
electromagnetic measurement of the grill.
Figure 3:1A Inlet pumping station, Västerås WWTP
1.4.2:1B -Separation / grill:
In the second step, there is a separation grill which has 4 grids
havingcolumn width 3 milimeters and 2 washers. The grills are washed from organic materials. The wash water with organic materials return to
the incoming wastewater. The washed screenings for incineration. 1.4.3: 1C- Sand trap:
There are 2 sand traps having total volume 1000 cubic meters,covering an area about 176 square meters. In each sand trap,the total capacity of blower is 1920 cubic meters per hour.The sand from the sand trap is pumped to the sand washer. Therewashed from organic materials. The washed water with organicmaterials return to the incoming wastewater.
1.4.4: 1D-Sedimentation:
This section has 18 pools having total volume 5225 cubic meters and covering total area 2200 square metres.
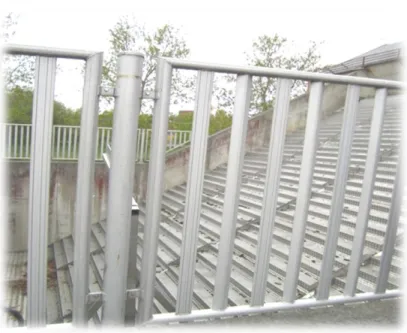
7 Figures 4 and 5:1D-Sedimentation, Västerås WWTP
1.4.5: 1E- Biopumpstation:
In biopumpstation,the lifting height is 3 meters.There are 4 frequency controlled propeller pumps having capacity 9900 cubic meters per hour.Propeller pumps lift the
8
1.5: Biological treatment steps in Västerås WWTP
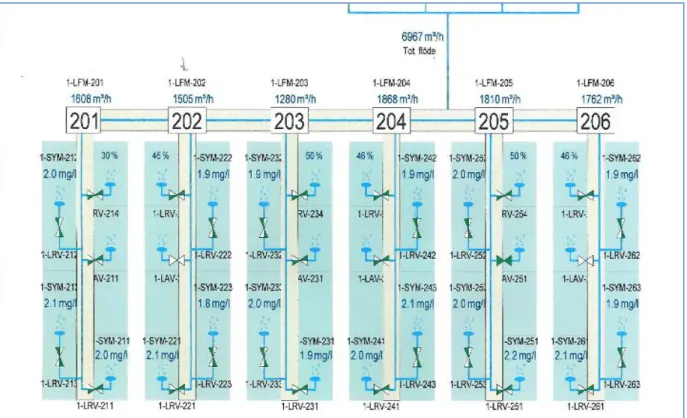
1.5.1: 2A Biobassänger(bio-pools):
Figure 6: 2A Biobassänger, Västerås WWTP
This is the main section of secondary treatment of biological water purification.It contains six channels(e.g.201,202,203,,,206),each has 2 pools so total12 pools having total capacity 5400 cubic meters per hour with total volume 12600 cubic meters.The biological nitrification ,denitrification and phosphorous removal occur in this step.
1.5.2: 2B - Blowers:
These are 4 turbo compressors used for giving air to aeration tank , having capacity 24000 cubic meters per hour of air.
1.5.3: 2C - After sedimentation basins:
In this section, processed water after biological purification step enters here.These are 18 pools having volume 9210 cubic meters with capacity 5200 cubic meters ,covering total area 2610 square meters.
1.5.4: 2D - Heat Pump (District heating / cooling):
The heat pump extracts heat and cold from the purified wastewater.
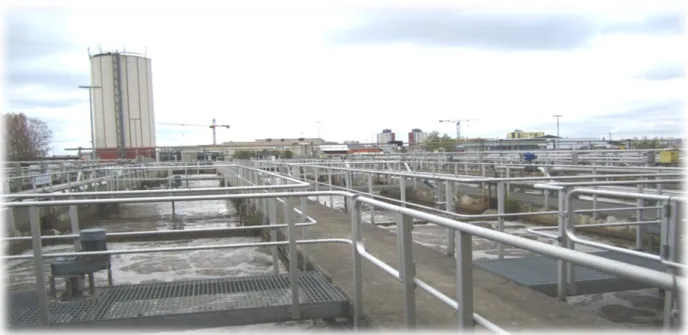
9 Figure 7: The presentation of 2B,2C and 2D, Västerås WWTP
1.6: Sludge Handling in Västerås WWTP
1.6.1: 3A - Slamsilpresser:
It's a grating (3 mm) permeable having capacity 40-45 cubic meters per hour. Hair and small debris are washed and separated.The screenings are transported to incineration. The water runs into a pool, also used for reception of external sludge. The sludge is pumped to the sludge thickener.
1.6.2: 3B - Sludge thickeners:
This section contains a Gravimetric sludge thickener having volume 545 cubic meters and also a Sludge thickeners reserve with volume: 288 cubic meters.
1.6.3: 3C - Digestion chambers 2:
This section contains 2 digestion chambers having volume 7000 cubic meters.The retention time of digestion chambers is about 20 hours at temperature:36 ⁰ C.
1.6.4: 3D - Slam Sludge Storage:
It has volume 800 cubic meters of sewage sludge to the centrifugesRejektförråd(rejects stores) with volume 500 cubic meters for the rejects from the centrifuges .Rejected water Pumped Into the Biological purification stepfor nitrification zones.
10
1.6.5: 3E - dewatering:
It conatins 2 centrifuge having total capacity 40 cubic meters per hour. It has maximum solids content: about 27% (dry weight)
1.6.6: 3F - Slam Silos of digested sludge:
It contains 2 slurry silos having total Volume of 300 cubic meters.The sludge is digested and used for agriculture, lawns and final cover of landfill. 1.6.7: 3G - Biogas methane:
It produces 1.8 million Nm3/år (normal m3/year), which methane concentration is about 62%.
The gas pressure 8 km to Growing Power, where the upgrade occurs. There will be about 1.15 million m³ of finished vehicle per year from the sewage treatment plant.
1.6.8: 3H - Torch - a safety valve:
In case of malfunction burned biogas produced in the torch at King Bed Authority.
1.7: Overall Biological Treatment:
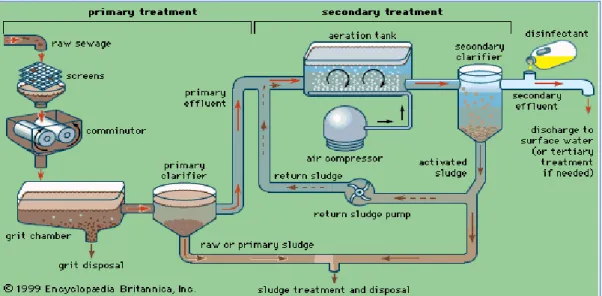
Figure 8: Activated sludge method (Encyclopeadia Britanica)
In activated sludge method, there are two most important steps, primary treatment and secondary treatment.In primary treatment, the wastewater/raw sewage first to be screened then go to grit chamber through comminutor, then towards primary clarifier.In the secondary treatment,the main thing is aeration tank,water comes into the aeration tank as primary effluent and sludge return,air enters from air compressors.Then processed water go to
11
secondary clarifier then to tertiary treatment if necessary, otherwise directly discharged to the surface water.
In the preliminary treatment,coarse material like parts of paper,wood , plastic and matel pieces are removed from the raw sewage.There is the removal of organic matter and suspended solids by screening and filtration occurs in the primary and advanced primary processes respectively. Then in the secondary treatment,free ammonium, biodegradable organic matters and inorganic nutrients(e.g. compounds of phosphorus and nitrogen) are removed.At the end if necessary, disinfection through microfiltration occurs for further removing the nutrients, suspended solids and organic matters in tertiary treatment.
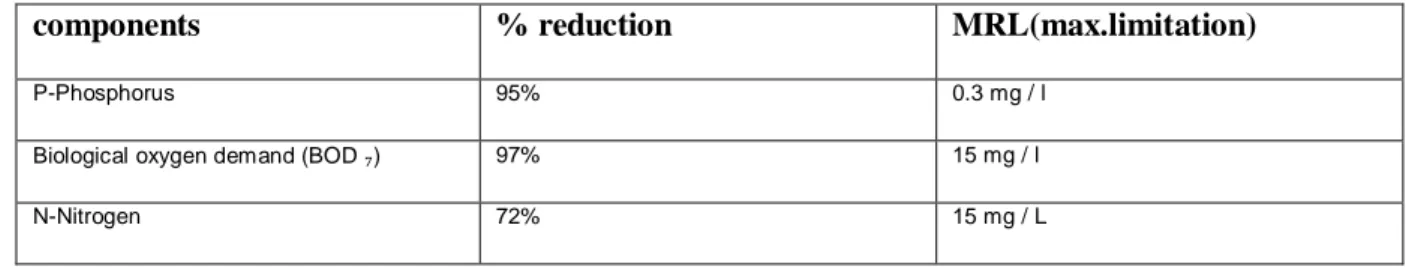
Table 2 : Overall Performance of Mälarenergi (Västerås ) WWTP:
components % reduction MRL(max.limitation)
P-Phosphorus 95% 0.3 mg / l
Biological oxygen demand (BOD ₇) 97% 15 mg / l
12
Chapter 2: Background
2.1 Problem description
The variation in standard value of dissolved oxygen (i.e. 2mg/L) by varying the aeration flow and water flow.
Generally, the treatment of wastewater is complex and uneconomical. In several cases, wastewater treatment systems fail to meet sustainability and environmental protection criteria. Same with the case in standardizing the value of dissolved oxygen in different steps of wastewater treatment plant.
Dissolved oxygen is a key element in water quality that is necessary to support aquatic life. A demand is placed on the natural supply of dissolved oxygen by many pollutants in wastewater. This is called biochemical oxygen demand or BOD and is used to measure how well a sewage treatment plant is working. If the effluent has a high content of organic pollutants , it will demand more oxygen from the water and leave the water with less oxygen for supporting fish and other aquatic life.
13
2.2 Objective
To analyze the relationship between hydraulic load, BOD, Nitrogen and Phosphorus contents at constant dissolved oxygen concentration
To analyze the comparatively data of winter and of summer.
To analyze the relationship of BOD with Nitrogen and Phosphorous contents.
To compile and compare the statistical data from the biological water purification process step at the municipal wastewater treatment plant.
2.3 Material and method
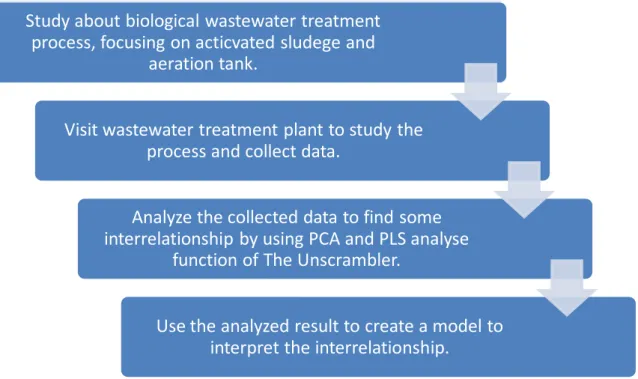
2.3.1 Overview of methodology
Figure 10: The overview of methodology
2.3.2 Material and Method
The raw material from the w.w.t.plants is the data about BOD, total nitrogen, ammonium nitrogen, nitrite nitrate nitrogen, total phosphorus, phosphorus filtered, suspended solids, water flow and pH (Västerås) for incoming and outgoing water. The collected data from
Mälarenergi WWTP Västerås and Eskilstuna Energi och Miljö (EEM) Eskilstuna plants
Study about biological wastewater treatment process, focusing on acticvated sludege and
aeration tank.
Visit wastewater treatment plant to study the process and collect data.
Analyze the collected data to find some interrelationship by using PCA and PLS analyse
function of The Unscrambler.
Use the analyzed result to create a model to interpret the interrelationship.
14
was analyzed to find any interrelationship between interdependent loads for incoming wastewater and outgoing water by using Principal Component Analysis (PCA) function of the Unscrambler. The results will be studied about the correlation between the interdependent loads.
The result of the correlation study will be used to generate the regression model to predict the ammonium nitrogen value in the future, this report will focus only on ammonium nitrogen. To generate the model we will use the PCA result and also by using Partial Least Square regression (PLS) function of the Unscrambler. Ammonium nitrate will consider to be Y (dependent value) and other related contents will consider to be X values. Before generating the model, all data should be normalized.
Also we drew some graphs in Microsoft Excel for predicting the results about the flow pattern of different constituents of municipal wastewater.
15
Chapter 3:
Biological wastewater treatment
Figure 11: Biological wastewater treatment, Mälarenergi (Västerås )WWTP.
3.1 Biological Nitrogen Removal (BNR)
Nitrogen in its different forms , present in municipal wastewater and usually not be removed by secondary treatment.Biologically, inorganic pollutants of N compounds like NH4+, NO3
-and NO2- can be removed from municipal wastewater through the combination of nitrification
and denitrification processes. For this purpose, we need aerobic zone for nitrification and anoxic zone for denitrification in the bioreactor for growing the nitrifying and the denitrifying bacteria.
3.1.1 Biological Nitrification
In biological nitrification, there are two steps involved, first is to convert ammonia to nitrite and second is as additional biological process for converting of nitrite to nitrate under aerobic conditions(i.e. in the aerobic zone). Nitrosomonas and Nitrobacter , these are autotrophic bacteria involving in the above two steps of conversions(i.e. Nitrosomonas oxidizes
16
ammonia to nitrite and Nitrobacter oxidizes nitrite to nitrate). The main result of nitrification is the conversion of ammonia to nitrate.
Nitrification is also called ammonia oxidation. (Equation 1) and (Equation 2) shows the two steps of nitrification.
2NH4+ + 3O2 2NO2- + 4H+ + 2H2O + energy Equation 1
2NO2- + O2 2NO3- + energy Equation 2
Temperature, pH, DO, organic loading and toxicity are the main parameters influencing the constancy of the nitrification process in wastewater treatment operations. In general, the growth rate of nitrifying bacteria tends to be zero at temperatures over 300C or under 100C. Similarly, the effect of pH on nitrification is reported diversely in various studies. Effectively, the pH range 7.5 - 8 is the most favourable for nitrification process.
3.1.2 Biological Denitrification
Biological denitrification is the phenomenon in which pathogens reduce nitrate to nitrite and nitrite to nitrogen gas. The nitrogen gas produced is in the form of nitric oxide (NO), nitrous oxide (N
2O) or nitrogen gas (N2).It is a very sensitive and difficult process to operate.
Denitrification is accomplished by Heterotrophic bacteria in the anoxic zone. For this process to occur and for cell growth, methanol must be added in sufficient quantity as a carbon source. Denitrifying bacteria grow very slowly and is sensitive to temperature ,and also other operating parameters such as sludge age and retention time must be varied with the variation in temperature. The pH value in denitrification is from 6.0 to 8.0.
The net removal of nitrogen is accomplished by stripping the nitrogen gas formed during denitrification out of the wastewater in a subsequent aeration process.
3.1.3 Ammonia Stripping
When nitrogen is in the gaseous ammonia form, ammonia stripping is applied to remove nitrogen from wastewater. In this process , the high pH wastewater is introduced into the top of a packed tower and air is entered from the bottom of the tower, opposite in the direction of incoming wastewater. In the result, the volatilization of ammonia is generated by the contact of wastewater droplets and fresh air, and goes out from the wastewater to the exiting air stream.
3.2 Biological phosphorus removal
The biological removal of phosphorus is the process, in which phosphates are taken up by bacteria, Acinetobacter. The regular changing of aerobic/anaerobic conditions and the absence of nitrate are the main requirements for biological phosphorus removal in the municipal wastewater treatment.
17
Phosphorus appears in wastewater as orthophosphate, polyphosphate and organically bound phosphorus. Microbes utilize phosphorus during cell synthesis and energy transport. As a result, 10 to 30 percent of the influent phosphorus is removed during traditional biological treatment (Sotirakou et al, 1999).
Phosphorus in the orthophosphate form is readily metabolized by bacteria and algae without further breakdown. Polyphosphates and organically-bound phosphorus must be hydrolyzed (broken down) to the orthophosphate form before readily metabolized by microorganisms. (Penn State Harrisburg Environmental Training Cente).
18
Chapter 4: ANALYSIS by Principal Component Analysis(PCA)
Wastewater, both incoming and outgoing, of Västerås and Eskilstuna were analyzed to find some interrelationship of the contaminants. Further analysis will generate model for predicting ammonium nitrogen value in the future.
4.1 Correlation analysis
Incoming wastewater contaminants (ammonium nitrogen, total nitrogen, nitrate nitrite nitrogen, phosphorus filtered, total phosphorus, suspended solids, pH and BOD) and water flow rate were analyzed to find some correlation by principal component analysis (PCA). The results shown from figure 6 and 7 that pH, nitrate nitrite nitrogen and water flow are independent to other contaminants. While others are depend to each other. The result from Västerås is quite clear that ammonium nitrogen correlate to total nitrogen but nitrate nitrite nitrogen is not. Total phosphorus has some relationship with phosphorus filtered but not too strong.
19 Figure 13: Principal component analysis of incoming wastewater, Eskilstuna WWTP
The contaminants of wastewater were analyzed again after the water out of the process. Phosphorus filtered and nitrate nitrite nitrogen are independent to the other contaminants. While other contaminates have some interrelationship.
20 Figure 15: Principal component analysis of outgoing water, Eskilstuna WWTP
4.2 Regression model for ammonium nitrogen
The regression models for analyzing ammonium nitrogen for both incoming and outgoing water by using partial least squares regression (PLS) and PCA results. In this report, we will focus on ammonium nitrogen only. Ammonium nitrogen is considered to be Y.
4.2.1 Incoming ammonium nitrogen regression model
BOD, total phosphorus, total nitrogen and suspended solids will be considered as X components for Västerås WWTP. Phosphorus filtered will be additional X component for Eskilstuna WWTP. 4.2.1.1 Västerås WWTP Equation 3 4.2.1.2 Eskilstuna WWTP
21 Equation 4
4.2.2 Outgoing ammonium nitrogen regression model
BOD, total phosphorus, total nitrogen and suspended solids will be considered as X
components for Västerås WWTP. Water flow will be additional X component for Eskilstuna WWTP. 4.2.2.1 Västerås WWTP Equation 5 4.2.2.2 Eskilstuna WWTP Equation 6
22 0 100 200 300 400 500 600 700 800 0 2 4 6 8 10 12 14 201 203 205 202 204 206 C h an n e l f lo w a n d s lu d ge vo lu m e n it ra te , a m m o n iu m , N ( to ta l) , P ( to ta l) , D O
February
nitrate ammonium N(total) P (total) DO sludge volume Chanel flow
Chapter 5: Results and Discussions
5.1 The Inter-relationship between Municipal Wastewater Components:
5.1.1 Winter (February)
Figure 16: The inter-relationship between constituents of municipal wastewater for February 2010
5.1.1.1 Results
1. In the given graph, nitrate has the direct relation with channel flow.
2. Nitrate also just like same pattern with sludge volume, it increases with the increasing volume and vice versa.
3. Nitrate has ignorable effect on DO value. 4. No effect on the concentration of P(total).
5. Nitrate has inversely proportional relation with the concentration of N (total). 6. Nitrate has slightly inversely proportional relation with the concentration of
Ammonium.
7. Ammonium has directly proportional relation with the concentration of N (total). 8. P (total) and DO value have no effects on other components of wastewater. 9. Ammonium has inversely proportional relation with the sludge volume. 10. Ammonium has slightly inversely proportional relation with the channel flow.
23 0 50 100 150 200 250 300 350 400 0 2 4 6 8 10 12 201 203 205 202 204 206 C h an n e l f lo w a n d s lu d ged v o lu m e n it ra te , a m m o n iu m , N (t o ta l), P (t o ta l), D O
September
nitrate ammonium N(total) P (total) DO sludge volume Chanel flow
5.1.1.1.1 In Section A (201,203,205)
Nitrate has increasing pyramidal curve trend while the values of ammonium and N (total) are being decreased.
Sludge volume and channel flow are also increased but P(total) and DO value has ignorable effects.
5.1.1.1.2 In Section B (202,204,206)
At 202, nitrate and sludge volume has maximum value while ammonium and channel flow has minimum value.
At 206, the values of N (total) and ammonium are at highest positions while sludge volume and nitrate are decreased.
5.1.2 Summer (September)
Figure 17: The inter-relationship between constituents of municipal wastewater for September 2010
24 5.1.2.1 Results
1. Nitrate has no effect on channel flow, but slightly direct relation with sludge volume, N (total) and ammonium.
2. Ammonium is slightly inversely proportional to the sludge volume and direct relation with the concentration of N (total).
3. N (total) is inversely proportional to the sludge volume.
4. P (total), DO and channel flow has no effect on other components of wastewater in September.
5.1.2.1.1 In Section A (201,203,205)
The trends of nitrate, N and ammonium are increasing while the trend of sludge volume is decreasing.
5.1.2.1.2 In Section B (202,204,206)
At 204, nitrate has max value while at 206 ammonium and N(total) showing their max trend.
5.1.3 Air flow Pattern:
25 5.1.4 Ammonium and BOD
Figure 19: Variation of the BOD7 and NH4+ concentration in the wastewater at Västerås
(Sweden) from January 2010 to December 2010
5.1.5 Phosphorus (filtered) and BOD
Figure 20: Variation of the BOD7 and phosphorus filtered concentration in the
26 5.1.6 Total Phosphorus and BOD
Figure 21: Variation of the BOD7 and total phosphorus concentration in the wastewater
27
5.1.7: PCA Result # 01
Figure 22: PCA for incoming wastewater in February11, 2010(09:20-09:28)
5.1.8: PCA Result # 02
28
5.1.9: PCA Result # 03
Figure 24: PCA for outgoing water in February25, 2010(08:00-08:08)
5.1.10: PCA Result # 04
29
5.2 Discussions
In above both figures 16 and 17, we can judge the interrelationship between different components of wastewater. In winter there are a lot of changes occur between these components as there is a wide change in channel flow and sludge volume but in summer the channel flow has ignorable variation. Similarly, there is wide difference between the values of nitrate, nitrogen (total) and ammonium concentrations in winter and summer. But there is no difference in the values of DO and P in both seasons.
In figure 18, we can see the airflow trend in a whole day in both winter and summer. In winter, the value of air flow is higher than that in summer. Also we can analyze that the trend of air flow is higher between 17:00 to 01:00 but it has the lower values between 02:00 to 16:00 .The maximum and min. values of airflow in summer are at 21:00 and 09:00 respectively. Similarly, in winter at 00:00 and 11:00 respectively.
In figure 19, there is the relationship between ammonium and BOD, which seems the directly proportional trend through whole the year. In Dec, Jan and Feb 2010, the trend shows maximum values of both ammonium and BOD while in March and November 2010, the minimum values are analyzed.
In figure 20, there is the relationship between Phosphorus (filtered) and BOD, which also showing approximate the directly proportional trend through whole the year. In Dec and Jan 2010, the trend shows maximum values of both P (filtered) and BOD while in March and November 2010, the minimum values are observed.
In figure 21, there is the relationship between Phosphorus (total) and BOD in which, there is slightly dependency on each other but in majority of the whole year, P (total) and BOD are independent and no more relation to each other except in March.
In figures 22 , there is the behavior of wastewaste influent characteristics in winter (February). Here phosphorus filtered,total phosphorus and total nitrogen showing positive behavior regarding to the loads and figure 24 shows the effluent characteristics in which ammonium nitrogen, total nitrogen and phosphorus filtered showing negative behavior regarding to flow and also be covariant to each other.
In figure 23, there is the behavior of wastewaste influent characteristics in summer (August) which shows the interrelationship of all ingredients with each other while there is no effect of flow pattern on them.while in figure 25,the effluent characteristics in which total
phosphorus,suspended solids and phosphorus filtered are covariant to each other and there is no wide change in flow pattern as compare to winter.
30
Chapter 6: Conclusions
The result of analyzed collected data shows that there is some interrelationship among wastewater contaminants. The contaminants interrelationship can be assembled into two groups by PCA results. The first group is ammonium nitrogen, total nitrogen and total phosphorus. The second group is BOD7 and suspended solids. For incoming wastewater, the two groups have strong interrelationship to each other but the relationships of the two group change when the wastewater was out of the aeration basin.
The study of interrelationship between interdependent loads in wastewater can generate model for predicting the amount of some interdependent loads in the future.
The following conclusions are given out from the results of graphs drawn in MS Excel: Nitrate concentration increases by increasing the channel flow and sludge volume. Ammonium and N(total) are inversely proportional to the sludge volume for a whole
year.
Phosph+ orous has negligible relation with other nutrients for a whole year. Air flow has higher value in winter.
Ammonium is directly proportional to BOD value. P(filtered) has direct relation with BOD.
31
Bibliography
Bansode, R. R. (2002). TREATMENT OF ORGANIC AND INORGANIC POLLUTANTS IN MUNICIPAL . Caballero, A. R. (2011). Study of bacterial communities: A wastewater treatment perspective.
Västerås, Sweden: Mälardalen University.
Encyclopeadia Britanica. (n.d.). Retrieved May 19, 2011, from
http://www.britannica.com/EBchecked/topic/666611/wastewater-treatment
Nathanson, J. A. (2011, May 19). Retrieved May 19 May 2011, 2011, from Encyclopædia Britannica: http://www.britannica.com/EBchecked/topic/666611/wastewater-treatment
Penn State Harrisburg Environmental Training Cente. (n.d.). Retrieved May 19, 2011, from
http://www.padepelearn.com: http://www.padepelearn.com/resources/modules/ww/ww-4/WW-4%20Fund%20of%20WW%20Treatment_WB_Final.pdf
Sotirakou et al. (1999). Ammonia and phosphorus removal in municipal wastewater treatment plant with extended aeration. Global Nest: the Int. J. Vol 1, No 1, 47-53.
Srinivas, T. (2008). Environmental Biotechnology. Delhi: New Age International.
Water Environment Federation . (2005). Biological Nutrient Removal (BNR) Operation in Wastewater Treatment Plants. Blacklick, OH, USA: McGraw-Hill Professional Publishing.
32
Appendix
Figure 26: Table of incoming wastewater data from Västerås WWTP
Figure 27: Table of outgoing water data from Västerås WWTP
Figure 28: Table of incoming wastewater data Eskilstuna WWTP