http://www.diva-portal.org
Postprint
This is the accepted version of a paper presented at The 15th IEEE International Conference on High
Performance Computing and Communications (HPCC 2013). Zhangjiajie , China , November 13-15,
2013..
Citation for the original published paper:
Aguilar, X., Laure, E., Fürlinger, K. (2014)
Online Performance Data Introspection with IPM.
In: Proceedings of the 15th IEEE International Conference on High Performance Computing and
Communications (HPCC 2013) (pp. 728-734). IEEE Computer Society
http://dx.doi.org/10.1109/HPCC.and.EUC.2013.107
N.B. When citing this work, cite the original published paper.
2014 IEEE. Personal use of this material is permitted. Permission from IEEE must be obtained for
all other uses, in any current or future media, including reprinting/republishing this material for
advertising or promotional purposes, creating new collective works, for resale or redistribution to
servers or lists, or reuse of any copyrighted component of this work in other works.
Permanent link to this version:
Online Performance Data Introspection with IPM
Xavier Aguilar and Erwin Laure
Swedish e-Science Research Center (SeRC) and
High Performance Computing and Visualization Department (HPCViz) KTH Royal Institute of Technology
Lindstedv¨agen 5, 10044 Stockholm, Sweden Email: {xaguilar, erwinl}@pdc.kth.se
Karl F¨urlinger
Ludwig-Maximilians-Universit¨at (LMU) Munich Computer Science Department, MNM Team
Oettingenstr. 67, 80538 Munich, Germany Email: Karl.Fuerlinger@nm.ifi.lmu.de
Abstract—Exascale systems will be heterogeneous architec-tures with multiple levels of concurrency and energy constraints. In such a complex scenario, performance monitoring and runtime systems play a major role to obtain good application performance and scalability. Furthermore, online access to performance data becomes a necessity to decide how to schedule resources and orchestrate computational elements: processes, threads, tasks, etc. We present the Performance Introspection API, an extension of the IPM tool that provides online runtime access to perfor-mance data from an application while it runs. We describe its design and implementation and show its overhead on several test benchmarks. We also present a real test case using the Performance Introspection API in conjunction with processor frequency scaling to reduce power consumption.
I. INTRODUCTION
Exascale systems featuring millions of cores will be a real-ity in a few years. These new supercomputers bring a number of challenges to the scientific community. First, high degrees of asynchronous parallelism, which require a good load balance to obtain exascale throughput. Second, power constraints in hardware. Today’s Petaflop systems consume more than 5 Megawatts, just scaling these systems to an exascale level would consume more than 1 Gigawatt of power. Therefore, exascale hardware as well as applications and systemware will have to implement different energy management techniques. For instance, increasing the power in some system resources and decreasing it in some others depending on application needs (arithmetic units, memory bandwidth, network, etc.). Finally, exascale infrastructures will be comprised of hetero-geneous components combining general-purpose processors with accelerators. In such a complex scenario consisting of heterogeneous infrastructures with high levels of concurrency and energy constraints, adaptive runtime systems and self-aware applications will play a major role.
A runtime system [1], [2], [3] is a piece of systemware responsible for matching application needs against system resources to optimize its performance. Furthermore, runtime systems hide the complexity of the underlying architecture, freeing developers from dealing with burdens such as task scheduling or resource management. Thus, it is important for a runtime system to access performance data from an application at run time without introducing much overhead. For example, accessing CPU and MPI time1spent by an application in order
1MPI time in this paper denotes the time spent in MPI communication or
synchronization routines.
to detect load imbalance. Using this information, a runtime system can distribute the work in a different way or turn off some devices to reduce power consumption while the application still runs. Moreover, through performance analysis a runtime system can detect computing requirements for some applications or tasks and assign them to appropriate hardware. However, accessing performance data online is not only useful for adaptive runtimes or self-aware applications but for performance analysis tools too. Current performance anal-ysis approaches of gathering data, storing it and analysing it afterwards with visualization tools are not scalable to an exascale level. New methods for dealing with huge amounts of performance data while it is generated need to be developed. For instance, using data mining techniques to reduce redundant data by detecting application iterations as described in [4], or building performance models to detect performance anomalies while the application runs. If an anomaly can be detected in the first stages of an application, it can be fixed on the spot, saving lots of resources wasted otherwise.
In this paper we present the Performance Introspection API (PIA), an extension to the workload and performance analysis tool IPM [5]. This API allows querying performance data from an application at run time easily and with low overheads. We show through several experiments that the level of perturbation introduced by our tool is minimal and demonstrate how it can be used in a real world example to reduce power consumption. The rest of the paper is structured as follows: in section II related work is presented. Section III introduces IPM and describes the Performance Introspection API. We explain the data available online and how it can be accessed using several examples. Section IV shows the overhead introduced by the tool and how it can be used in a real test case to reduce power consumption dynamically. Finally, the paper ends with future work and conclusions in sections V and VI.
II. RELATEDWORK
Despite the significance of online performance analysis and tuning in large-scale systems, few performance tools with online capabilities exist. Score-P [6] provides an interface that enables analysis tools to use its monitoring infrastructure remotely over TCP/IP. Our approach with the Performance Introspection API is not thought to be an stand-alone tool but an integrated monitoring system within an application or runtime system.
TAUg [7] is the closest work to our approach. It provides performance data collected by TAU [8] based on views. These views can be comprised by one or several processes defined by the user. It uses the MPI library in order to transfer data among processes within a same view in a transparent way. However, it only allows users to access one metric at a time and only provides raw performance data. In contrast, the Performance Introspection API provides presently a local view per process but allows several metrics to be accessed at the same time. It also allows users to obtain some statistics such as minimum, maximum and average execution time per MPI call for instance.
There are other tools making an online use of the collected performance data. TAUoverSupermon [9] also uses TAU as monitoring system and creates a tree of daemons sharing the collected data through the Supermon transport system. Autopilot [10] uses a set of performance sensors together with decision procedures in order to automatically tune applications. Periscope [11] uses different monitoring agents in conjunction with a set of rules and properties to do automatic performance analysis while the application is running. The Distributed Performance Consultant in Paradyn [12] in conjunction with MRNet [13] provides a scalable framework for online auto-mated performance diagnosis. Embedded Gossip [14] spreads performance data among processes including it transparently into the MPI messages sent by the application. Although these tools manage performance data online, only a few of them such as TAUg or TAUoverSupermon provide online access to this performance data as the Performance Introspection API does.
III. IPM PERFORMANCEINTROSPECTIONAPI A. Architecture
IPM2 [5] is a performance tool aimed at providing reports on several program events introducing minimum overhead. Such events can be MPI operations, file I/O operations, CUDA or OpenMP events among others. It has been widely used by HPC centres such as NERSC to collect more than 310K batch profiles in the past 6 years.
After program execution IPM generates a rich report con-taining statistics for each chosen event on each application entity, that is, processes or threads. It also has a tracing mode with which traces containing timestamps for each event can be generated. However, its strong point is its non-intrusive and scalable profiling mode where only statistics of events are collected.
IPM is designed in a modular way to better fit user and system needs. It is comprised of a core, a transport module and a set of modules customizable at its compile time.
The core module is responsible for initializing all the data structures within IPM and setting up the environment properly. The transport module defines the mechanism for gathering the data from all processes at the end of the run to compute statistics across tasks. At the moment this module is only available for MPI but it could be extended to other communication mechanisms such as MRNet[13] or UPC[15]. Finally, the set of customizable modules defines what kind
2IPM stands for Integrated Performance Monitoring
of information is collected from the application: MPI per-formance data, OpenMP, I/O operations, processor hardware counters, GPU performance information, etc.
In summary, IPM is a performance analysis tool focused in the non-intrusive and scalable measurement of performance data. Moreover, its modularized design allows the addition of measurement capabilities for additional hardware such as GPU cards or additional programming models.
B. Performance Introspection API
The Performance Introspection API (PIA) is designed to be a simple and lightweight interface to access performance data while the application runs. It is written in C and can be used from C, C++ and Fortran.
The programming interface here presented starts providing each process a local view of its own performance state. This view is already useful to other higher level components such as schedulers or runtime systems. Furthermore, this local view on the performance state can be used to construct a global view too. However, this is out of the scope of this paper and remains as future work.
There are two different data entities a user can access with the Performance Introspection API as the application runs, user-defined code regions and activities.
C. User-defined regions
User-defined regions are measurement intervals defined within the application by the user. For instance, functions, tasks, loops or blocks of code. These delimited regions can be nested and are annotated in the source code with the routine ipm region. This routine has two parameters. The first one defines if the region starts or ends using the tags IPM START and IPM END. The second parameter is the region’s name. For each region the associated performance data is fixed and includes performance metrics such as wall clock time of the region, CPU time, MPI time within the region, number of executed instances and hardware performance counters. As all these metrics are accumulated during the program execution, the amount of memory needed to store them is small, in the order of kBs
IPM builds internally a call tree with all defined re-gions as they are executed, assigning a unique region ID to each of them. The method pia get current region returns the ID of the current region being executed and the method pia find region by namereturns a region ID by its name. This call has the region name defined by the user as input parameter. The Performance Introspection API allows also the naviga-tion of the call tree of user-defined regions within a program using pia child region and pia parent region. These methods have a region ID as input parameter and return the correspond-ing region ID accordcorrespond-ing to the region call tree. That is, the child region or the parent region. The performance data of a region can be obtained using pia get region data. This routine has the region ID as input parameter and the structure containing the performance data as output parameter.
The code example in listing 1 shows how to use the Performance Introspection API to consult the total time, MPI
time and number of instances executed for a defined code region called foo.
Listing 1. Accessing the performance data for a user-defined region
v o i d f o o ( ) { / / D e f i n i n g r e g i o n ’ s f o o s t a r t i p m r e g i o n ( IPM START , ” f o o ” ) ; / / Do w h a t e v e r h e r e / / D e f i n i n g r e g i o n ’ s f o o e n d i p m r e g i o n ( IPM END , ” f o o ” ) ; } i n t main ( i n t a r g c , c h a r ∗ a r g v [ ] ) { p i a r e g i d t i d ; p i a r e g d a t a t d a t a ; f o o ( ) ; / / O b t a i n r e g i o n ID i d = p i a f i n d r e g i o n b y n a m e ( ” f o o ” ) ; / / O b t a i n p e r f o r m a n c e d a t a / / f o r t h a t r e g i o n p i a g e t r e g i o n d a t a (& d a t a , i d ) ; f p r i n t f ( s t d e r r , ”%f W a l l t i m e \n ” , \ d a t a . wtime ) ; f p r i n t f ( s t d e r r , ”%f MPI t i m e \n ” , \ d a t a . mtime ) ; f p r i n t f ( s t d e r r , ”%d t i m e s e x e c u t e d \n ” , \ d a t a . c o u n t ) ; } D. Activities
Activities are statistics associated to certain events such as MPI calls, Posix-IO calls or OpenMP phases. For instance, we could consult the activity for MPI Recv, obtaining information on how many times it has been called, total time inside the call, maximum and minimum time or number of bytes received in the current MPI process for the whole run or in a user-defined region. These statistics are computed on the fly from the data already stored in memory by IPM, thus, no extra memory to keep activity information is used.
In order to access the performance data for an activity, the user needs its activity ID using pia find activity by name. This method has the activity name as input parameter and returns its corresponding activity ID. Once we have the ID we can access the performance data using pia get activity data or pia get activity data in region. These routines have the ac-tivity ID as input parameter and the acac-tivity data struct as out-put parameter. The function pia get activity data in region also has the region name as input parameter. The code snippet in listing 2 shows how to obtain the associated data to MPI Send for the whole process from the beginning of the run.
IV. EVALUATION
In the next subsections we evaluate the efficiency and usability of our Performance Introspection API. The efficiency is evaluated through several experiments showing the overhead introduced by the tool. Regarding the usability, a real test case using the Performance Introspection API to reduce power consumption is shown.
Listing 2. Obtaining performance data associated to MPI Send
/ / A c t i v i t y names c h a r ∗ a c t 1 = ” MPI Send ” ; / / A c t i v i t y ID p i a a c t t i d ; / / A c t i v i t y d a t a p i a a c t d a t a t a d a t a ; / / Data f o r t h e f i r s t a c t i v i t y r e g a r d i n g t h e w h o l e p r o c e s s p i a i n i t a c t i v i t y d a t a (& a d a t a ) ; i d = p i a f i n d a c t i v i t y b y n a m e ( a c t 1 ) ; p i a g e t a c t i v i t y d a t a (& a d a t a , a i d ) ; f p r i n t f ( s t d e r r , ” MPI Send h a p p e n e d %d t i m e s \n ” , a d a t a . n c a l l s ) ; f p r i n t f ( s t d e r r , ”%d b y t e s t r a n s f e r r e d \n ” , a d a t a . n b y t e s ) ; A. Efficiency
The efficiency and overhead of IPM have been widely discussed in [16]. Therefore, we will focus in the overhead introduced by the Performance Introspection API.
In the first experiment we measured the time for accessing performance data associated to a user-defined region. We wrote an application that creates thousands of user-defined regions and accesses the performance data of one of them randomly chosen. We ran this application several times and calculated the average time for accessing a region. Fig. 1 shows this access time using pia get region data as the number of defined regions increases on an AMD Opteron 6274 at 2.2 Ghz. As we can see, the access time is very small, not exceeding 300 ns for 20,000 regions. Furthermore, we can see how this access time is almost constant for the first 8,000 regions where all the measurements are within the range of 238-248 ns. This small variability in the measurements (only 10 ns) is caused by the nature of the experiment in which the region accessed was not always the same but randomly selected every time.
As previously mentioned, the performance data linked to a defined region is accessed through its region ID. This region ID can be obtained as a return value when defining the region or using the function pia find region by name. However, obtaining a region ID by its name has a cost of 4 microseconds and increases with the number of regions defined. Thus, it is preferable to use the numeric ID when accessing the performance data, avoiding lookups by name when possible.
The other data entity we can access using the Performance Introspection API is activities. The data used for computing activities is stored within IPM in a hash table as explained in [16]. Therefore, we designed a benchmark in order to test the access time for an activity as the hash table fills up. Our benchmark stores 10 million random events in a hash table of 32K entries increasing on each step the number of unique keys used for these events. Fig. 2 provides the time in microseconds for accessing the activity MPI Send among 10 million random events as the number of unique hash keys increases on an AMD Opteron 6274 based system. As it is shown in the figure, the access time increases slightly as the hash table fills up and collisions become more probable (having more unique keys results in more entries used in the hash table). However, as pointed in [16], in the vast majority of applications the observed fill rate for the hash table is below 50% and their access time is between 800 and 850 microseconds.
TABLE I. TOTAL EXECUTION TIME FOR THESWEEP3D BENCHMARK AND PERCENTAGE OF OVERHEAD INTRODUCED BYIPMAND THE
PERFORMANCEINTROSPECTIONAPI.
MPI Processes Original Sweep3D Sweep3D with IPM +
PIA Overhead 1032 226.1s 225.768s 0% 2064 244.975s 245.437s 0.19% 4080 267.72s 269.448s 0.65% 8160 306.751s 308.234s 0.48% 150 200 250 300 350 0 4000 8000 12000 16000 20000 Access time (ns)
Number of user-defined regions
Average access time to a user-defined region data
Fig. 1. Average time in nanoseconds for accessing the performance data associated to a user-defined region.
700 750 800 850 900 950 1000 1050 1100 0 4000 8000 12000 16000 20000
Access time (us)
Number of unique hash keys
Access time to an activity among 10 million events
Fig. 2. Access time in microseconds to an activity among 10 millions of events in the activities hash table.
As the reader can notice, the access time for activities is higher than for regions. As previously mentioned, the main reason is that region information is stored in memory whereas activity statistics are calculated on demand.
Finally, one more experiment was performed in order to measure the total overhead introduced by IPM and the Per-formance Introspection API. In this test we used Sweep3D, a solver that models 1-group-time-independent discrete ordinates (Sn) 3D cartesian (XYZ) geometry neutron transport problem. Utilizing our Performance Introspection API we checked on each program iteration the total time, the average time and the number of times executed for the MPI Send and MPI Recv calls. We also accessed the performance information (wall-clock time, MPI time and number of instances executed) for the main function sweep on each program iteration.
We ran the benchmark in a Cray XE6 system based on
AMD Opteron 12-core ”Magny-Cours” (2.1 Ghz) processors. Each node has 24 cores divided between 2 sockets and 32GB of DDR3 of memory. The nodes are interconnected with a Cray Gemini Interconnect network.
Table I shows the execution times for the Sweep3D benchmark with and without IPM and the Performance In-trospection API. In this experiment, we run the benchmark several times for each test case using a base grid of 10x10x400 with weak scaling up to 8,160 processors. It is clearly seen how the overhead introduced in this case does not perturb the application, being less than 1%. It is also noticeable that the overhead does not depend on the number of processes because the Performance Instrospection API operates locally on each process. Thus, the overhead does not increase with the number of MPI tasks and fluctuates under 1% due to the natural runtime variations in HPC systems.
B. Application Test Case
In this section we present an example on how the Per-formance Introspection API can be used in conjunction with processor frequency scaling to reduce power consumption. For the experiment we implemented a basic molecular dynamics kernel simulating a random collection of Argon atoms in a flat box. On one hand, molecular simulations are very common in HPC systems. On the other hand, a basic MD kernel is easy to implement and allows us to have a benchmark with a scientific value added.
The potential used to govern the simulation of the system is the Lennard-Jones or 6-12 potential. The program was parallelized using MPI and the linked-cell method. That is, the box is divided into cells in which particles are situated. These particles can only interact with particles in the same cell or adjacent cells due to a cutoff radius. Thus, reducing the computation complexity and the amount of communication between processors.
For the purposes of the experiment we unbalanced the number of atoms assigned to each processor. The cells situated in the inner part of the box have most of the atoms whereas the ones in the outer part are almost empty. The algorithm works as follows, for each timestep, it computes the forces resulting from the potential of the particles within the same cell. Then, it computes the forces from the potential of particles in adjacent cells. Once the forces have been calculated, it computes new positions for particles and redistributes particles among processors.
We ran the simulation on two different systems. The former, based on AMD Opteron 8425HE processors with a total of 24 cores and 32 GB of memory. The latter based on AMD Opteron 6274 processors with a total of 64 cores and
(a) Computation for two iterations of the molecular dynamics code. X-axis is time and Y-axis processes. Colour ranges from green light meaning short computation to dark blue meaning long computation. Black is MPI operations.
(b) MPI operations for two simulation iterations. X-axis is time and Y-axis MPI processes. Light green is MPI Waitall and dark green MPI Reduce. Black is outside MPI.
Fig. 3. Computation and MPI calls for two iterations of the particles simulation.
132 GB of memory. This second system also had a Chauvin Arnoux CA 8230 power measurement device that allowed us to measure the total power consumption for the whole node in real-time.
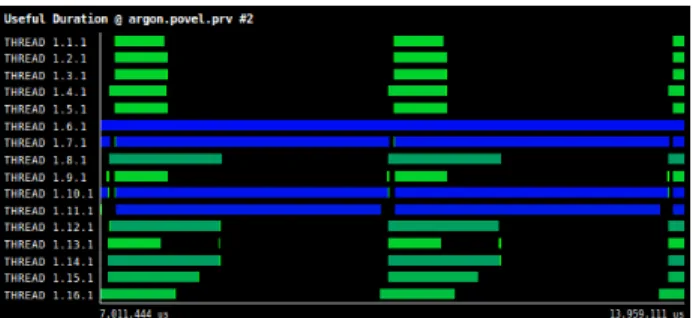
Fig. 3a shows a timeline of our application using Paraver[17], a performance visualizer tool. The timeline de-picts the computation along two iterations of our simulation using 16 MPI processes. The X-axis is time and the Y-axis MPI processes. The colour ranges from light green to dark blue, meaning light green a short computational burst and dark blue a large one. Black is MPI.
As we can clearly see in the picture, the work among processes is unbalanced. Some processes such as thread 1.6.1 are really busy whereas others are not, for instance, thread 1.2.1. Fig. 3b presents the MPI operations for the same two iterations. The caption shows how the processors with fewer particles finish their calculation faster and spend most of their time waiting for other processes in MPI Wait (light green) and MPI Reduce (dark green).
We used the Performance Introspection API to measure the time spent in computation and in MPI for each simulation timestep. Each process accesses its local data from previous iterations and proportionally reduces its processor frequency regarding its ratio between MPI time and computation. If a processor spends most of its time waiting for particles from others processors, it can reduce its clock frequency, maintain-ing the runnmaintain-ing time but reducmaintain-ing the power consumption.
Other more complex strategies than just checking previ-ous iterations to readjust clock frequency could be chosen.
Fig. 4. Computation for two iterations of the molecular dynamics code using frequency scaling for load balancing. X-axis is time and Y-axis processes. Colour ranges from green light meaning short computation to dark blue meaning long computation. Black is MPI operations.
Nevertheless, in our basic molecular dynamics kernel the load among processors does not change radically between consecutive iterations. The probability that the workload in the processor is similar to previous iterations is high. Thus, using only past iterations to adjust clock frequency worked fine for our experiment.
Fig. 4 shows the same two iterations from Fig. 3a but with the frequency scaling in use. As can be seen in the picture, reducing the frequency on some processors provides a better work balance although the number of particles per processor is the same as before. Furthermore, the time per iteration does not increase considerably because the heavily-loaded processors which determine the loop time maintain their old clock frequency.
Table II illustrates percentage of time in computation and in MPI for some iterations for a few representative processes: one with a very high workload, other with a medium workload and another with a very light load. The upper left part of the table shows the statistics for the normal run whereas the right part does the same for the frequency scaled version. As we can see in the table, reducing the clock frequency for the lightly-loaded process increases its percentage of computation from 19.49% to 45.72%, reducing its MPI time from 80.51% to 54.28%. Moreover, this change is bigger for the moderately-loaded process, moving from being idle half of the time to be almost 100% of its time in computation. The maximum loop time in this case only increases by 3.5% due to the performance variability between runs and the overhead for changing the clock frequency.
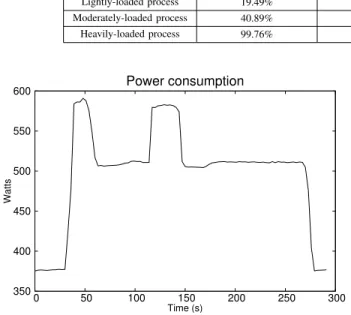
Fig. 5 gives the power consumption for the molecular dynamics application running on 64 processors. The node consumes around 375 Watts when it is empty with all its processors in an idle state. When we launch our MPI ap-plication, the power consumption raises to 580 Watts. In that moment we start collecting performance data with IPM. Despite that, the application waits for 5 iterations before using the Performance Instrospection API to access the collected data. The reason is that we want the application in a stable state when we start checking its performance. We understand by stable state the phase when the applications presents minor fluctuations in its performance due to its iterative behaviour: the initialization phase is finished, the caches are already filled, etc. At that point, the application accesses its performance data and each process changes its processor frequency according to
TABLE II. PERCENTAGE OF TIME IN COMPUTATION AND INMPIFOR THEMDCODE.
Original code IPM + PIA and Frequency Scaling
Computing time MPI time Computing time MPI time
Lightly-loaded process 19.49% 80.51% 45.72% 54.28% Moderately-loaded process 40.89% 59.11% 99.10% 0.90% Heavily-loaded process 99.76% 0.24% 96.85% 3.15% 350 400 450 500 550 600 0 50 100 150 200 250 300 Watts Time (s) Power consumption
Fig. 5. Power consumption in a node of 64 processors using the Performance Introspection API and frequency scaling.
its workload. We can see in the picture how the total power consumption is reduced then about 13% (first peak in the graph).
However, the workload per processor in the system changes dynamically along time due to the particle movement between cells. Therefore, each process recalibrates its clock frequency every five timesteps. In this particular test case, experiments showed that five timesteps was a proper interval to keep a good ratio between energy saved and overhead introduced by changing clock frequencies.
We can see this effect in the second peak in the graph. After two minutes of simulation some processors receive more work and the application has to increase their clock frequency again. Thereby, the application is able to keep a similar iteration time among all processors. Nevertheless, after some more iterations, a few processors become less loaded and we can lower the clock frequency again. Consequently, reducing the total power consumption again.
V. FUTUREWORK
We plan to integrate IPM and the Performance Introspec-tion API with the work described in [1]. There, a prototype of an adaptive runtime system for large-scale parallel numerical simulations is presented. This runtime system faces the chal-lenge of improving the performance of parallel applications through task scheduling. Moreover, it has been designed to be able to react dynamically to application’s changing behaviour. At the moment, the data associated to a user-defined region is fixed. In the future, the user could decide at run time what information is collected using configuration files. Moreover, right now the Performance Introspection API returns accumu-lated statistics. Therefore, we plan to implement methods for allowing incremental performance data, so to speak, a profile
history or profile snapshots. In this manner, it will be easier for a user to access incremental data from the last time it was accessed. For instance, the total time of a function for each call or the loop time on each loop iteration.
We also want to implement a global performance view for the whole application. That is, one process could access the performance state of other processes. In order to achieve this global view among processes, we will explore different options. Among them, we will explore the use of PGAS languages and global arrays for data distribution within our tool.
The Performance Introspection API needs to be extended to query performance information per thread about OpenMP re-gions as the application runs. Furthermore, IPM should also be extended to capture performance data from new programming models such as PGAS languages or OpenMP Task extensions. The increase in granularity of performance data will bring new challenges in data collection and online access. Thus, we also want to explore data mining and machine learning methods for data collection and analysis while the application runs. On the one hand, using some data mining methods such as clustering or Principal Component Analysis (PCA) could help to reduce the amount of data collected. For instance, if several entities have similar behaviour, collecting data only from one of them. On the other hand, using machine learning methods could help IPM to learn how to detect performance anomalies automatically as the application runs. Thus, the end-user or a runtime system could be warned by IPM about performance problems at run time.
VI. CONCLUSIONS
Applications running in upcoming exascale systems will have to deal with high levels of concurrency, heterogeneity and energy constraints. In such a complex scenario, runtime systems and performance monitoring will become a necessity to have good application performance. Access to online per-formance data will be crucial to make decisions on how to proceed with computations or how to manage resources.
Furthermore, using only application-level indicators might not always translate to actual performance differences. For instance, in a molecular dynamics application load balancing could be performed utilizing the number of particles without going down to the performance data level. However, this load balancing might not be optimal due to dynamically changing conditions in the numerics of the application or the hardware side.
In this paper we have presented the Performance Introspec-tion API, a set of C funcIntrospec-tions to query the performance state of an application while it runs. That is, it provides dynamic performance data access at run time. Thus, making possible for an application or runtime system to take decisions on
how to guide computations according to the performance state. This API has been built in top of IPM, a powerful and very lightweight profiling tool. As we previously saw in section IV, the total overhead introduced in our test case (Sweep3D) never exceeded the 1% of the total running time.
The Performance Introspection API and IPM provide a portable and robust monitoring infrastructure that can be easily adapted to any user requirement. In that way, the end user is free from burdens such as programming his own timers or learning how to interact directly with the processor counters through PAPI[18]. The current version of the Performance Introspection API offers only a local view of the performance state within each process. Thus, some extra implementation effort from the user’s side is needed if a global view for the whole application is required. However, this issue will be solved in the next version of our API.
REFERENCES
[1] M. Schliephake, X. Aguilar, and E. Laure, “Design and implementation of a runtime system for parallel numerical simulations on large-scale clusters,” Procedia Computer Science, vol. 4, no. 0, pp. 2105 – 2114, 2011, proceedings of the International Conference on Computational Science, ICCS 2011. [Online]. Available: http://www.sciencedirect.com/science/article/pii/S1877050911002882 [2] L. V. Kale and S. Krishnan, “Charm++: a portable concurrent object
oriented system based on c++,” in Proceedings of the eighth annual conference on Object-oriented programming systems, languages, and applications, ser. OOPSLA ’93. New York, NY, USA: ACM, 1993, pp. 91–108. [Online]. Available: http://doi.acm.org/10.1145/165854.165874 [3] K. Devine, E. Boman, R. Heaphy, B. Hendrickson, and C. Vaughan, “Zoltan data management services for parallel dynamic applications,” Computing in Science Engineering, vol. 4, no. 2, pp. 90 –96, mar/apr 2002.
[4] G. Llort, J. Gonzalez, H. Servat, J. Gimenez, and J. Labarta, “On-line detection of large-scale parallel application’s structure,” in Parallel Distributed Processing (IPDPS), 2010 IEEE International Symposium on, april 2010, pp. 1 –10.
[5] IPM WWW site, http://www.ipm2.org.
[6] Score-P WWW site, http://www.vi-hps.org/projects/score-p/.
[7] K. Huck, A. Malony, S. Shende, and A. Morris, “Taug: Runtime global performance data access using mpi,” in Recent Advances in Parallel Virtual Machine and Message Passing Interface, ser. Lecture Notes in Computer Science, B. Mohr, J. Tr¨aff, J. Worringen, and J. Dongarra, Eds. Springer Berlin / Heidelberg, 2006, vol. 4192, pp. 313–321, 10.1007/11846802 44. [Online]. Available: http://dx.doi.org/10.1007/11846802 44
[8] TAU WWW site, http://www.cs.uoregon.edu/Research/tau/home.php. [9] A. Nataraj, M. Sottile, A. Morris, A. Malony, and S. Shende,
“Tauoversupermon: Low-overhead online parallel performance monitoring,” in Euro-Par 2007 Parallel Processing, ser. Lecture Notes in Computer Science, A.-M. Kermarrec, L. Boug, and T. Priol, Eds. Springer Berlin / Heidelberg, 2007, vol. 4641, pp. 85–96, 10.1007/978-3-540-74466-5 11. [Online]. Available: http://dx.doi.org/10.1007/978-3-540-74466-5 11
[10] R. L. Ribler, H. Simitci, and D. A. Reed, “The autopilot performance-directed adaptive control system,” Future Generation Computer Systems, vol. 18, no. 1, pp. 175 – 187, 2001, i. High Performance Numerical Methods and Applications. II. Performance Data Mining: Automated Diagnosis, Adaption, and Optimization. [Online]. Available: http://www.sciencedirect.com/science/article/pii/S0167739X01000516 [11] M. Gerndt, K. F¨urlinger, and E. Kereku, “Periscope: Advanced
tech-niques for performance analysis,” in Proceedings of the 2005 Inter-national Conference on Parallel Computing (ParCo 2005). Citeseer, 2005, pp. 15–26.
[12] P. C. Roth and B. P. Miller, “On-line automated performance diagnosis on thousands of processes,” in Proceedings of the eleventh ACM SIGPLAN symposium on Principles and
practice of parallel programming, ser. PPoPP ’06. New York, NY, USA: ACM, 2006, pp. 69–80. [Online]. Available: http://doi.acm.org/10.1145/1122971.1122984
[13] P. C. Roth, D. C. Arnold, and B. P. Miller, “Mrnet: A software-based multicast/reduction network for scalable tools,” in Proceedings of the 2003 ACM/IEEE conference on Supercomputing, ser. SC ’03. New York, NY, USA: ACM, 2003, pp. 21–. [Online]. Available: http://doi.acm.org/10.1145/1048935.1050172
[14] W. Zhu, P. Bridges, and A. Maccabe, “Embedded gossip: lightweight online measurement for large-scale applications,” in Distributed Com-puting Systems, 2007. ICDCS’07. 27th International Conference on. IEEE, 2007, pp. 58–58.
[15] Unified Parallel C (UPC) Consortium and others, “Upc language specifications,” Lawrence Berkeley National Lab Tech Report LBNL– 59208, 2005.
[16] K. Fuerlinger, N. Wright, and D. Skinner, “Effective performance measurement at petascale using ipm,” in Parallel and Distributed Systems (ICPADS), 2010 IEEE 16th International Conference on, dec. 2010, pp. 373 –380.
[17] BSC WWW site, http://www.bsc.es/computer-sciences/performance-tools.
[18] D. Terpstra, H. Jagode, H. You, and J. Dongarra, “Collecting perfor-mance data with papi-c,” in Tools for High Perforperfor-mance Computing 2009. Springer, 2010, pp. 157–173.